


Abstract
The feasibility of a tokamak fusion reactor working in a reduced H-mode confinement, typical of the type III (or grassy) ELMs regime is here analyzed with two codes. The first is COREDIV that provides an integrated and self-consistent description of both the core and SOL plasma. The analysis is complemented by the 2D code TECXY which models the SOL more accurately and can then provide better estimates of the power deposited on the divertor targets. As for the present version of the EU-DEMO, the auxiliary power is fixed at 50 MW and q95 = 3.5, while the energy confinement time is downgraded to 0.6 times the standard H-mode. The major radius R is increased by 1 m step from 9 up to 12 m and the toroidal magnetic field BT by 1 T step from 6 up to 8 T, with density kept at its Greenwald limit. An interesting working window around R = 11 m and BT = 7 is identified with the fusion gain Q ≈ 30. The impurity seeding by either Xe or Kr, which can reduce the power input into the SOL and hence the load on the plates, can however affect the sustainment of the H-mode, even if degraded. Argon is then considered for enhancing the radiated power inside the SOL. The TECXY analysis of this issue shows that the loads on to the target can be maintained at a very acceptable level, still preserving the core performance. Using liquid tin as divertor target material can be very advantageous for exhausting the power entering the divertor chamber provided argon is used in conjunction. In conclusion the option of a reactor working in a safer and simpler low confinement mode should not be put aside prematurely.
Export citation and abstract BibTeX RIS
1. Introduction
The foreseen tokamak fusion reactors exhibit considerable problems concerning the exhaust of particle and power onto the divertor targets, not yet fully solved. Already in the ITER basic H-mode scenario [1] the ELMs are expected to induce huge thermal and mechanical stresses. Also, in the inter-ELM phase the peak loads could easily overcome the technical limits due to the predicted very narrow convection channel. The present solutions are still questioned to be fully compatible with the postulated high core performance. Conversely type III ELMs mode, with small and grassy ELMs would practically eliminate these problems at the origin, but the reduced core confinement mode would ask for increased reactor dimensions to preserve an acceptable overall performance. The unavoidably higher cost would partially be balanced by a simpler design, now rid of all the extra complications needed for mitigating the mentioned problems. The viability of this route is investigated with the code COREDIV that provides a self-consistent scenario, by coupling a simplified 2D treatment of the edge with a 1D core description. Its main features are described in DEMO related papers, early [2] and more recent ones [3, 4]. The SOL is then treated more accurately by the 2D multi-fluid edge code TECXY that considers the real edge geometry. Its details can be found in [5].
The key points of this study are that the following constraints should hold: (1) fusion gain Q, ratio of the fusion power to that of the auxiliary heating, Q ≡ Pfus/Paux ⩾ 30; (2) power crossing the separatrix PSOL > PL-H, threshold value for the L-H mode back transition [1]; (3) peak load onto either divertor target below the technically manageable level, here assumed qpk,max = 10 MW m−2, following ITER [1]. Other reference values anyway can range from 5 MW m−2, in the prudent approach of EU-DEMO [6], to 15 MW m−2 for more aggressive views as I-DTT [7] or even beyond in case of liquid metals targets [8].
The plan of the paper is as follows. In section 2 the COREDIV search for convenient scenarios of a low-confinement DEMO is illustrated. Section 3 describes the global and local (on targets) properties of the SOL predicted by the code TECXY for the most attractive scenario. Puffing argon is here considered for enhancing the radiative losses inside the SOL. Section 4 is devoted to illustrate some possible alternatives to the basic arrangement considered in section 3, namely the use of tin as liquid target and the effect of a faster cross-field transport of the energy inside the SOL. In section 5 the conclusions are outlined together with the main remarks.
2. Investigation with the self-consistent code COREDIV
The COREDIV code has been used to investigate self consistently many current experiments in particular JET [25] and Asdex [26]. The first step of the present exercise is to analyse the effect of the main plasma parameters: geometry (tokamak major radius R) and toroidal magnetic field (BT) values, on the Q-factor, on the power crossing the separatrix (PSOL) and on that deposited onto the divertor plates. Starting from the scenario of the revised 2018 version of the EU-DEMO [9] with a fixed q95= 3.5, R is increased by 1 m step from 9 m up to 12 m and BT by 1 T step from 6 T up to 8 T, while the electron density is fixed at the Greenwald limit [1], which in turn scales as 1/R, Paux at 50 MW and the H-factor for the standard H-mode energy confinement time (τEIPB98(y,2) [1]) at H98 = 0.6. This latter value is the lowest one compatible with Q ⩾ 30 inside the selected region of the R-BT plane, according to a relevant exploration made with a H98 step = 0.1. This has then excluded a true L-mode since τL, derived from [10], results always ≈ 0.4 × τEIPB98(y,2) for the final plasma parameters here considered. Only the lower single null divertor configuration is considered in the simulation. The dependence of plasma current (Ip) and line averaged plasma density (<ne,line>) on R and BT are presented in table 1.
Table 1. Plasma density and current for different magnetic field and major radius.
| Major radius R [m] | Ip [MA] | <ne,line > [×1020 m−3] | ||||
|---|---|---|---|---|---|---|
| BT = 6 T | BT = 7 T | BT = 8 T | BT = 6 T | BT = 7 T | BT = 8 T | |
| 9 | 18 | 21 | 24 | 0.681 | 0.795 | 0.903 |
| 10 | 20 | 23.33 | 26.66 | 0.61 | 0.712 | 0.81 |
| 11 | 22 | 25.66 | 29.33 | 0.556 | 0.649 | 0.741 |
| 12 | 24 | 28 | 32 | 0.51 | 0.595 | 0.68 |
In the simulations, 71.6% of the alpha power (Pα) heats the electrons and the remaining 28.4% the ions, as suggested in other papers [11, 12], while the very important parameter ζ = D/χe, ratio between the particle and heat cross-field diffusion coefficients in the core is set to 0.35, as for the past COREDIV simulations [3, 4, 11]. Its magnitude determines the amount of the He ashes accumulation, and then that of the produced fusion power. Significantly lower values can drop Pfus at a hardly acceptable level, as verified here for ζ = 0.2. The influence of the magnitude of ζ is extensively discussed in [13] for the ITER performance. However, this free parameter cannot yet be checked against present day experiments because of the very small quantity of He produced. Indeed, also the experiments where He is puffed from outside, see [14], or is the main ion species are not suitable for such comparison. The reason is the much lower particle energy (some keV at maximum) that makes dominant the interaction with ions, contrarily to the high energy fusion α particles (3.5 MeV) interacting mostly with electrons. Moreover, for the He puffing case, the source location contributes to exalt the difference with a reactor situation.
Another important parameter is the density peaking, quantified by the ratio between the central and the line averaged values k = ne,0/<ne,line>, here fixed to 1.35, considered a reasonable mid-way compromise between the almost flat true H-mode and the L-mode profile, for which k ≈ 1.5. However here for a variation 1.1 ⩽ k ⩽ 1.35 only the burning tritium fraction, defined as twice the ratio between the α particle and the fuel input fluxes 2Γα/ΓD-T, is strongly affected, while are scarcely influenced Pα and PSOL, which mostly count for our purposes.
The first wall is made by tungsten, whose injection in the plasma is in turn calculated from the sputtering by all ions present in the plasma, including self-sputtering and seeded impurities, according to the data available in the literature [15–18]. Radiation from impurities is then computed from their content inside the plasma, core and SOL. All is done self consistently, with the warning however that the SOL model is rather simple and the SOL contribution will be refined in the next section by TECXY calculations.
The main results for no extra impurity seeding are presented in figure 1 as a function of R and for the three mentioned values of BT. The figure shows that a quite promising solution to a low-confinement option for DEMO would be R = 11 m and BT = 7 T, for which Q ≈ 40. At this case we will limit our analysis in the present work. Other options with higher Q values are in our opinion too demanding either in term of the power to be exhausted inside the SOL (BT = 8 T) or in term of the cost (R = 12 m). Clearly higher H98 values would allow shifting the interesting region towards the low left corner of figure 1. Another important outcome of this exercise is that the power input into the SOL is just enough for maintaining a H-mode, being only slightly above PL-H, even if the need of PSOL > PL-H is perhaps not so stringent for a low-confinement H-mode as for a standard one. Then, the margin for additional impurities radiating significantly inside the core is rather narrow. Such a study carried out for xenon (ZXe = 50) and Krypton (ZKr = 36) is presented in figure 2. Here as a function of the impurity concentration in the core are compared from top to bottom: (a) the Q values and the effective charge state Zeff; (b) PSOL together with PL-H; (c) the power radiated inside the core and that deposited on the divertor plates. The differences between the two gases are rather small, we would say almost negligible within the approximation of the present calculations. The concentration for both needs to be maintained approximately <0.01% for maintaining the H-mode. However, the total power to plate should simultaneously be kept below 100 MW at least, for a technically sustainable heat removal rate, according to an optimistic rough scaling for the larger major radius from recent studies on the EU-DEMO [6]. The figure shows the incompatibility of the two requirements with Xe or Kr only. Another way of radiating mostly within the SOL has to be found in order to reduce the plates load. This task can be fulfilled by injecting argon as the next section will describe. Here we remark only that xenon is lightly favoured for the core radiation while krypton for the edge radiation, as expected.
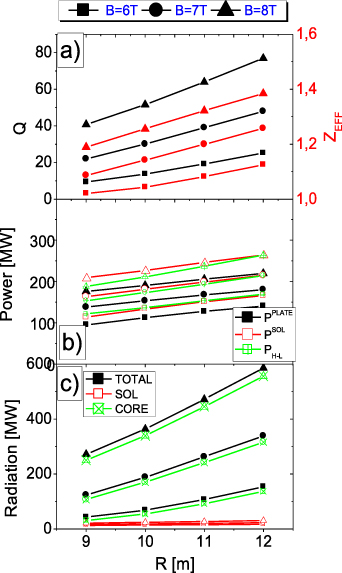
Figure 1. Plasma parameters versus major radius and toroidal magnetic field (B): (a) Q-factor and Zeff, (b) power to plate (PPLATE), to SOL (PSOL) and H–L power threshold (PHL) and (c) radiation in SOL, in the core, and total radiation.
Download figure:
Standard image High-resolution image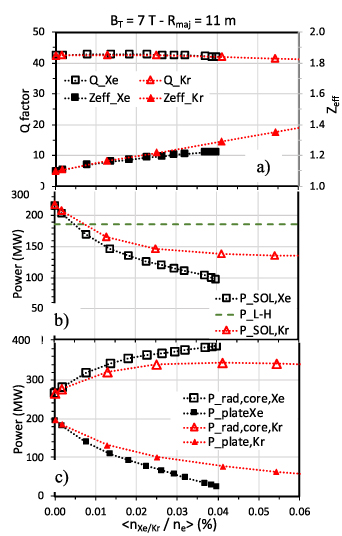
Figure 2. Some global parameters for BT = 7 T, R = 11 m; ne0/ne,line = 1.35; ζ = 0.35. Xe (black), Kr (red): (a) Q-factor and ZEFF; (b) power to SOL (PSOL) and H–L power threshold (PLH) and (c) radiation in the core and power to the plates.
Download figure:
Standard image High-resolution image3. TECXY modelling of the SOL with argon seeding
The main features of the code TECXY and its reliability have been described many times in recent papers [19–21], to which and to the references therein we address the reader interested in the relevant details. Here we only remind that TECXY is particularly suited to a wide exploration of the operating parameter space of a tokamak, due to the analytical model employed to describe the neutral dynamics, instead of the Monte Carlo technique which usually requires very long computing times. The price to pay for this is the inaccuracy when deep plasma detachment from the divertor plates is attained, which however would accompany also the Monte Carlo method when the details of the divertor design and shape, and of the neutrals sources and sinks are not fully defined.
The computing meshes have been scaled from the revised 2018 version of EU-DEMO [9] linearly to the larger dimension preserving both the plasma and the vessel shapes. All the components of the magnetic field have been also corrected for the ratio of the new to the original toroidal value. In such way the poloidal field twist and hence the safety factor profile q are preserved. It has been checked that the loop integral of the new poloidal field along the plasma border produces the correct value of the plasma current. The resulting mesh is presented in figure 3.
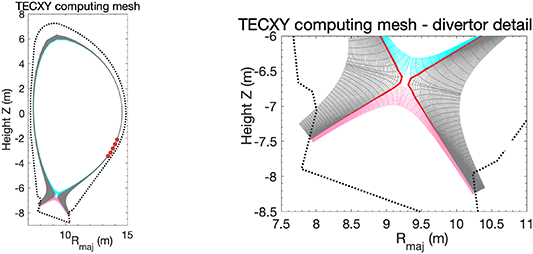
Figure 3. TECXY computing meshes. Left: the whole mesh; right: divertor details. The three different regions—core, main SOL and private region—are marked with different colours. The red circles on the left delimit the usual puffing region for the seeded impurities.
Download figure:
Standard image High-resolution imagePSOL is everywhere assumed to be equal to 200 MW which is roughly 1.2 times the PL-H threshold, as done in [12]. The cross-field transport coefficients are adjusted in order to give a cross-field e-folding decay length inside the power transport channel, λq, whose magnitude at the outer equator is quite close to that of the ion poloidal gyroradius, ρi,pol, as done in [9, 12]. It results λq ≈ 3 mm, as for the present version of the EU-DEMO [7]. The reasons for a value higher than that of the present empirical scaling laws [22], λq,scaling ≈ 1 mm, are detailed in [6], and also in [19, 20] for the I-DTT device. They can be summarised briefly as follows: (i) the scaling is based on a data base with λq > ρi,pol, that makes its extrapolation uncertain to DEMO where the opposite is true. The importance of the ρi,pol magnitude, in turn, is supported by the energy confinement time (τE ∝ Ip ∝ Bpol ∝ 1/ρi,pol), and by its tight link with λq suggested in [23]; (ii) theoretical arguments based on turbulence models [24] would foresee a much longer length, λq ≈ 5 mm. The value here chosen is then a compromise between these two evaluations.
The investigation is carried out for a plasma density at the outboard equator close to ne,sep ≈ 2.7 × 10¹⁹ m−3 (ne,sep ≈ ne,line/2.5) and varying the Ar injection rate. We selected only three cases, namely seeding argon alone and puffing either Xe or Kr at a rate producing the maximum average concentration which could be really tolerated for an acceptable core performance. The maximum puffing rate has been set to keep the maximum average concentration below ⩽0.02%, a bit higher than the just presented results of COREDIV simulations, because the code approximations do not rule out a larger concentration. This approach provides a quick and reliable general picture of the Ar puffing effects in the possible real situations, since furthermore both Kr and Xe are poor radiators inside the SOL. We point out that when quoting the impurity concentration in TECXY we refer to the value averaged along the main plasma—SOL boundary. The consequences for the bulk properties are derived assuming this value constant inside the core, i.e. an impurity density profile equal to that of the main plasma density.
Concerning the global quantities, the main results are presented in figure 4 for the total power deposited onto the plates, in figure 5 for the peak power onto the more loaded outer target and in figure 6 for the resulting dilution of the main plasma as a function of the Ar concentration averaged along the separatrix. The outcome from the analysis of these figures is that Xe or Kr are both almost irrelevant for mitigating the target loads at the concentration admitted by a good core performance. Nonetheless injecting argon can solve all problems at the very cheap price to dilute the plasma fuel less than 4% (nH/ne ⩾ 96%). For the maximum seeding rate allowed by the code stability the radiated fraction of the input power rises to ≈70% and the peak loads fall down to ≈2 MW m−2. A further drop, i.e. full detachment, is not accessible to the code but is not prevented by physics of course, provided a slightly higher dilution be accepted.

Figure 4. Total power delivered onto both targets versus the argon concentration averaged along the separatrix. Argon only (□); Krypton + Argon (O) Xenon + Argon (Δ). PSOL = 200 MW.
Download figure:
Standard image High-resolution image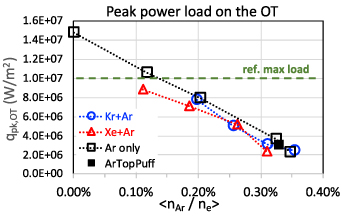
Figure 5. Peak power load onto the outer target versus the Ar concentration averaged along the separatrix. Argon only: □, ▪ = top puffing; Krypton + Argon: O; Xenon + Argon: Δ. PSOL = 200 MW. The dashed green line is the reference max tolerable level.
Download figure:
Standard image High-resolution image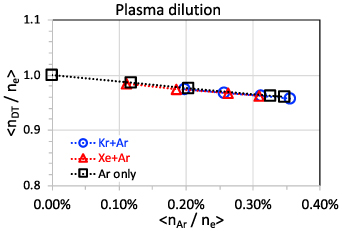
Figure 6. Plasma dilution as the hydrogenic ions concentration versus the Ar one, both averaged along the separatrix. Argon only (□); Krypton + Argon (O) Xenon + Argon (Δ). PSOL = 200 MW.
Download figure:
Standard image High-resolution imageIt is also interesting to note how the seeding affects the overall power transport inside the SOL shifting a noticeable fraction from the outside divertor towards the inside one, as shown in figure 7, where we plot the total exhausted power (volume loss + plate load) in the inner and in the outer divertor as a function of argon concentration. The two powers start from being largely unbalanced for no argon—much larger power to the outer divertor—but progressively converge to an almost equal value close to detachment conditions for an Ar concentration cAr ≈ 0.35%. This effect is independent of the puffing location as shown by the full symbols, which refer to a top puffing (the normal one being close to the outer divertor, see figure 3) and is related to the fact that Ar is a strongly recycling impurity. The change in the transport affects mainly the position of the stagnation point in the main SOL, as illustrated in figure 8. Here the power transported along the main SOL flux tube is plotted versus the poloidal distance from the top of the separatrix, for the cases of no argon and with maximum Ar concentration. The stagnation point is located in the first case where the outer plasma surface is almost equal to the inner one and shifts a little bit outwards when argon is seeded, implying an extra power to be diverted from the outer towards the inner divertor. As an exercise we tried to reassign this quantity to the outer driven power, and of course to subtract it to the left driven part, and the result is depicted by the blue cross symbols. The almost perfect overlap of these latter points to the 'No Argon' curve clearly confirms our interpretation. We need also to remark here that the IN/OUT unbalance is very closely related to the profile of the power input source, practically identical to the full curves, as calculated from the electron and ion cross-field power flow, which includes fluid, conduction and viscosity terms. The slight difference between the 'divertor' values in figures 7 and 8 is due only to the numerical approximations of the line, surface and volume integrals and are completely negligible within the precision of the present calculations.

Figure 7. Total power driven to either the outer (O) or the inner divertor (□) as sum of the power deposited onto the plate and the volume losses (radiation charge exchange etc.). Full symbols (•, ▪) are for the Ar top puffing case.
Download figure:
Standard image High-resolution image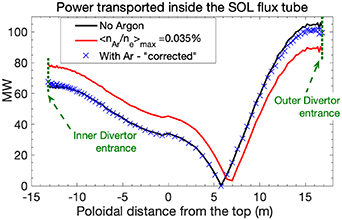
Figure 8. Power transported to either the inner or the outer divertor chamber for no argon (-) and highest Ar seeding (-). Blue crosses (×) are derived from the red curve by artificially considering the stagnation point at the same position of no Ar case.
Download figure:
Standard image High-resolution image4. Non-standard arrangements
In this section we will deal with situations slightly different from those described in the previous section. The consequences of larger cross-field transport, λq = 4 mm, probable in a reduced confinement scenario are illustrated in section 4.1. In section 4.2 the liquid divertor target made by tin is considered. We remark here that also an advanced divertor scenario configuration has been examined, namely the X divertor [7], but no significant difference in the general behaviour has been found. All the advantages of these configurations transfer almost rigidly to the case of low confinement case with no other peculiarity.
4.1. The effect of faster cross-field energy transport, λq = 4 mm
A faster cross-field transport is expected to smear out the power over a longer radial distance and then to mitigate all the issues of the power to be exhausted from the divertor plates. As specified in the introduction we chose to assign to the cross-field diffusion coefficients (D⊥, χ⊥) an increment of 1/0.6 in order to maintain the length run in one confinement time τE, defined by  , at the same value of a standard H-mode. This resulted in λq ≈ 4 mm. Despite the apparently small increase the effect is not at all negligible, as summarized by the figure 9, which presents the peak loads on the outer target versus the argon concentration. By referring to the figure 5 it is clear that the request of any extra mitigation inside the SOL is now much less stringent, being the peak load only slightly above the reference value of 10 MW m−2 for the predicted level of either Xe or Kr concentration, with no argon seeding. Adding this latter then it appears rather easy to approach detachment for already a significantly lower concentration, ≈ 0.2% against the previous 0.35%.

Figure 9. Plot of the peak load qpk on the outer target versus the average Ar concentration along the separatrix for λq = 4 mm. Argon only (□); Krypton + Argon (O) Xenon + Argon (Δ). PSOL = 200 MW. The dashed green line is the reference max tolerable level.
Download figure:
Standard image High-resolution imageThe fact that the product qpk × λq is left almost unchanged with respect to λq = 3 mm allows daring some projections for λq = 1 mm (the empirical scaling value), which were not run because the computational mesh is inadequate to such short scale length. Assuming a linear trend with λq on the basis of the mentioned observation, we could quote a peak load with no seeding of qpk ≈ 43 MW m−2 and an Ar concentration cAr ≈ 0.6% for attaining the lowest level of qpk ≈ 3 MW m−2. The associated D-T fuel dilution at ≈ 92% corresponds to a reduction of the fusion power to ≈ 85% of the original vale, still acceptable in our opinion.
4.2. The use of liquid divertor targets, specifically Sn
For outlining the behaviour of liquid metal targets in a reactor we limit here the analysis to the liquid tin. The other option still present in the DEMO studies, namely lithium, has indeed been set in second position by a previous analysis [19], further confirmed also for a more compact device with a DEMO-like SOL as the I-DTT [20].
The COREDIV simulations have shown that it is very hard to find a satisfying self-consistent solution. Indeed, the lack of a strong radiator as tungsten causes initially a high load on the targets and large Sn particle release rates. Even though the non-negligible Sn radiating ability in the core alleviates in turn the load, the resulting core concentration is always at such a level to bring PSOL well below the PL-H threshold value. The exploration of such situations has led to estimate as acceptable cSn ≡ <nSn/ne> ⩽ 0.025%. We then searched for a solution to this issue by means of the more refined SOL calculations with TECXY. Here the liquid target is modelled in order to produce a self-consistent particle release rate, as extensively described in the mentioned previous papers [19, 20] and related references therein. The way here followed is to fix a target arrangement in order to have an evaporation release rate close to the sputtering rate. This implies usually a peak liquid temperature around 1000 °C and allows having a quite wide free range for the temperature, usually 500 °C–1500 °C, for controlling the evaporation rate. The investigation is then carried out for fixed PSOL = 200 MW and λq ≈ 3 mm, as before, by varying the Ar injection rate for controlling the SOL radiation and hence the target loads. A region is then searched for where consistency is reasonable between the calculated Sn concentration and the value of PSOL, i.e. around cSn ≈ 0.025%. We also remind that an independent knob for controlling PSOL would be seeding either Kr or Xe, not considered in this preliminary exercise.
Figure 10 shows that the desired acceptable Sn concentration can be found already for cAr > 0.05%, which is a rather low plasma contamination. Both Sn evaporation and sputtering decrease at a very comparable rates, despite the total load drop is not huge at all. This is due to the strong non-linearity of evaporation with the liquid temperature and of sputtering by hydrogenic ions with the low plasma temperatures (Te,strike pt ⩽ 8 eV). Lowering the total release rate in turn depresses also the self-sputtering to a final level that the enhanced sputtering by argon cannot balance. Argon progressively replaces tin in such a way that the total radiation is moderately affected, showing a visible decrease only for the maximum Ar concentration, as presented in figure 11. Consistently with the cases considered in the previous section for comparable total power to target in the range < 70 MW the target peak loads are well below the limit for a safe management of the power exhaust and rather close to plasma detachment as shown in figure 12. The advantage now with tin is the stability of this situation.
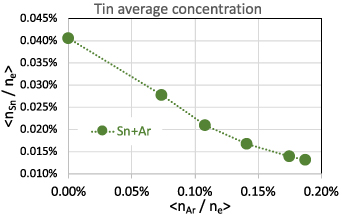
Figure 10. Plot of the average tin concentration versus the Argon concentration, PSOL = 200 MW.
Download figure:
Standard image High-resolution image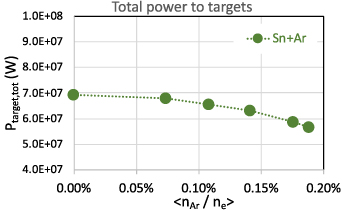
Figure 11. Plot of the total power deposited on both targets versus the Argon concentration, for liquid tin targets. PSOL = 200 MW.
Download figure:
Standard image High-resolution image
Figure 12. Plot of the peak power load on either target versus the Ar concentration, for liquid tin targets. PSOL = 200 MW. The reference maximum level is just the upper horizontal axis and it is addressed by a blue arrow.
Download figure:
Standard image High-resolution image
5. Conclusions and remarks
This paper analyses the performance of a reactor operating in a much more prudent scenario than foreseen now for the EU-DEMO. The approach is to avoid some border limit requests that coexist in the present DEMO design, namely exceeding simultaneously by a factor ⩾1.1 both the standard H-mode energy confinement and the Greenwald limit for the plasma density. We instead took as reference a downgraded H-mode with H98 = 0.6 and density not greater than the Greenwald limit, maintaining also a safe value for the plasma current, limited to a value for which the safety factor q95 is ⩽3.5.
Clearly to obtain an acceptable fusion performance the volume of the plasma must be increased. The analysis has been carried out in two steps. First with the code COREDIV, which couples the core simulation to the edge features, in particular with the amount of the released impurities that can then contaminate in turn the core and affect the fusion performances. A rather wide area in the parameter space of major radius and toroidal magnetic field has been explored, namely 9 ⩽ R ⩽ 12 m, and 6 ⩽ BT ⩽ 8 T. A very interesting window around R = 11 m and BT = 7 T has been identified and then successively analyzed with the code TECXY for the issues concerning the SOL and divertor plates behaviour. Despite the fusion power, similar to the EU-DEMO, is spread over a large surface, the need for a higher power crossing the separatrix for sustaining a H-mode, yet downgraded, still leaves the problem of a technically sustainable heat removal rate from the divertor plates. The results nonetheless show that the situation can be well manageable for a cross-field e-folding decay length of the power transport channel slightly longer than that foreseen for the standard H-mode. Otherwise the help of argon as additional impurity to be fed from outside could greatly solve any problem without affecting negatively the bulk performances, since both the associated core radiation and the implied plasma dilution are quite negligible. Conversely, the use of heavier noble gases as krypton or xenon can indeed be used to control the core radiation, but their amount needs to be kept so low for a good core performance that scarcely affects the SOL radiation. Finally, also the use of liquid targets, specifically of tin, is permitted with no preclusion. Rather it would allow even less amount of argon to approach plasma detachment form the divertor plates than for standard tungsten plates. Moreover, the recovery from a back transition to a true L-mode would be much easier essentially because of the reduced height of the step to be overcome.
We finally want to face the obvious objection of a high cost for the option supported by this paper that suggests to reconsider seriously the present high-performance scenario for a reactor. Its reliability suffers, in the author's opinion, from large uncertainties that cast heavy clouds on the undertaken way towards a reactor. Indeed, the consistency between high density and improved H-confinement is not at all still granted. Rather it is usually observed the opposite. Further the associated huge ELMs, which are reliably foreseen at present, are controlled or mitigated only at expense of reduced confinement, as physically expected since one has to modify the edge pedestal which is the basis of the high confinement. Other ELM free scenarios presently investigated on several devices are still in a very premature stage and appear accessible for scenarios quite far from the reference one with high plasma current. Furthermore, the issue of how to get rid of impurities and He ashes, task which is carried out by the ELMs in the present day devices, is not yet faced at the author's knowledge.
Moreover, all the techniques that appear as candidate to solve the above problems are not cheap at all, and should be fully considered in the overall cost of a reactor, as well as their full long-term reliability. A very short and not exhaustive list is the pellet injection for improving the density peaking and hence to overcome the Greenwald limit, the shallow pellet injection for ELMs pacing, the resonant and also non-resonant magnetic perturbation again for ELMs control, the correction of the toroidal magnetic ripple for increasing the confinement by minimizing the fast particle loss. Finally, even in the fortunate event that a strong technological progress, for example with liquid metals, would make unnecessary the ELMs mitigation, they would highly limit the use of a cheap auxiliary power as the ion cyclotron resonance heating (ICRH) because of the huge coupling problems that they have caused so far in the devices where ICRH is used.
Acknowledgments
This work has been carried out within the framework of the EUROfusion Consortium and has received funding from the Euratom research and training programme 2014–2018 and 2019–2020 under Grant Agreement No. 633053. The views and opinions expressed herein do not necessarily reflect those of the European Commission. This scientific work was supported by Polish Ministry of Science and Higher Education within the framework of the scientific financial resources in the year 2020 allocated for the realization of the international co-financed project.