


Abstract
Toroidal modeling utilizing the MARS-Q code (Liu et al 2013 Phys. Plasmas 20 042503) shows that large (compared to electromagnetic torque) neoclassical toroidal viscous (NTV) torque can be achieved in the plasma core region in reference MAST(-U) L-mode plasmas, by applying the n = 2 (n is the toroidal mode number) 3D fields generated by the magnetic coils used for controlling the edge localized mode and/or by the error field correction coils. Large NTV torque, occurring at relatively slow plasma flow, in combination with strong variation of the torque amplitude versus the coil phasing of the 3D coils, offers a tool to control the plasma toroidal rotation profile in spherical tokamaks. To effectively employ the toroidal NTV torque, the potentially fast initial flow needs to first be damped by 3D fields. MARS-Q quasi-linear initial value simulations demonstrate that this is achievable in MAST-U, within the designed 3D coil current capability for the device.
Export citation and abstract BibTeX RIS
1. Introduction
In magnetically confined plasmas, flow and flow shear affect both the plasma confinement and many types of MHD instabilities. Whilst controlling the overall flow amplitude has been extensively pursued in both experiments and theory, few studies have been performed to intentionally control the radial flow profile of toroidal rotation by applying 3D magnetic perturbations [1].
On the other hand, having the capability of flow profile control is always beneficial for tokamak operations. For instance, suppressing the type-I edge localized mode (ELM) by resonant magnetic perturbations (RMP) [2–6] has been found to be sensitive to the location of the zero-crossing position in the plasma rotation (either perpendicular electron flow according to two-fluid theory [7] or toroidal ion flow according to the single fluid theory [8] or the toroidal E× B flow [9, 10]). Variation of the toroidal flow profile has been found to be effective in stabilizing the resistive wall mode via drift kinetic damping [11]. Controlling the toroidal fluid flow profile is the primary focus of this study, while understandably this will also help to control the E× B flow profile.
It is now well recognized that the toroidal neoclassical viscous (NTV) torque can be used as a powerful tool to control the plasma flow [1, 12]. The NTV torque is generated by the presence of small amplitude 3D magnetic field perturbations in tokamak plasmas. The key feature of the NTV torque is its global distribution along the plasma minor radius, contrary to the resonant electromagnetic torque which is more localized near rational surfaces for a given 3D perturbation [13, 14]. This global nature makes it attractive to employ the NTV torque to control the plasma flow profile.
Controlling plasma rotation profile by the 3D field induced NTV torque is indeed a viable option for tokamaks. This, however, often requires relatively slow initial flow of the plasma. This is because the toroidal NTV torque is typically small in tokamaks. On the other hand, Landau resonant effects, e.g. between a 3D perturbation and the precessional drift of trapped thermal particles, can substantially enhance the NTV torque [15, 16]. Since the toroidal precession of trapped thermal particles is typically very slow, the resonance can only be possible if the plasma flow is also slow (for a static RMP field, the perturbation frequency in the plasma frame is of the same order as the plasma rotation frequency).
Due to their lower moment of inertia, plasmas in spherical tokamaks (ST) such as MAST(-U) often rotate at fast speed. However, fusion reactors based on the ST concept may not have fast toroidal flow [17]. This study investigates the feasibility of the plasma flow profile control by NTV for MAST-U, via toroidal simulations with the MARS-Q code [18]. We aim to answer the following three key questions for MAST-U:
- Is a large NTV torque achievable in MAST(-U), provided that the initial plasma flow is sufficiently slow?
- Is it possible to tune NTV torque amplitude in the plasma core versus edge regions, by scanning the coil phasing for RMP coils?
- Is it possible to damp an initially fast plasma flow in MAST-U, using the new design for the MAST-U RMP coils, to a sufficiently slow speed by resonant torques, so that the NTV torque can be employed to modify the flow profile?
Note that the above questions are posed in a logical manner - it only makes sense to address the given question, if the answer to the previous one is positive. Therefore, in what follows, we shall answer these questions in the same order. We emphasize, however, that the ordering of these questions should be reversed in terms of real application. In particular, as it should be evident from the above discussions, the purpose of damping the initially fast plasma flow is to create a favorable condition for later flow profile tailoring via the (resonant) NTV torque.
As for the plasma equilibria, we shall use those reconstructed from MAST L-mode discharges as reference scenarios for MAST-U. The reason for considering L-mode plasmas is two-fold. First, this study only targets the initial MAST-U operations. Secondly, flow profile control can be investigated in either L-mode or H-mode plasmas, with the key ingredient, i.e. the NTV torque, acting in a similar fashion. Both MAST 3D coils and the new RMP coils designed for MAST-U will be considered to address the first two questions. A model for the designed MAST-U 3D coils will be assumed to answer the third question above. We mention that strong damping of initially fast plasma flow, using the MAST RMP coils in the n = 2,3,4,6 configurations, has previously been successfully modeled for MAST plasmas [19, 20].
In this work, we shall use exclusively the n = 2 fields to control the plasma flow profile. This is partially for the purpose of reducing the potential danger of causing mode locking by the n = 1 field in MAST-U (the n = 1 field error has been intentionally minimized during the machine construction phase). The paper is organized as follows. The higher-n, e.g. n = 3 or 4, fields are not considered due to the lack of spectrum control with the MAST-U coil design. In addition, high-n fields are generally less effective in damping/controlling the plasma core flow.
Section 2 briefly introduces the MARS-Q formulation and describes the modeling input. Section 3 reports toroidal torque computations, as well as the torque distribution optimization via scanning the coil phasing among various 3D coils, based on the MARS-Q computed linear resistive plasma response. Section 4 reports MARS-Q quasi-linear initial value simulation results for flow damping in reference MAST discharges, assuming the 3D coil system designed for MAST-U. Section 5 draws conclusion.
2. Formulation and modeling input
The MARS-Q model has been reported in references [18] and [21]. The main part of the code solves the single fluid, resistive, full MHD equations in the linearized form for the  perturbations (n is the toroidal mode number), in toroidal geometry

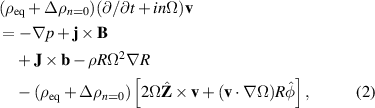


where R is the plasma major radius,  the unit vector along the geometric toroidal angle φ of the torus,
  the unit vector in the vertical direction in the poloidal plane. The plasma resistivity is denoted by η. The variables
  represent the perturbed density, velocity, magnetic field, current, pressure, and plasma displacement, respectively. The equilibrium plasma density, field, current, and pressure are denoted by
  , respectively. Γ = 5/3 is the ratio of specific heats. Δρn = 0 is the n = 0 component of the density change (due to density pumpout) to be discussed later. We also assume that the n = 0 plasma flow
  has the toroidal component only,
  , with Ω being the angular frequency of the toroidal rotation, which we wish to control in this study.
In the presence of 3D field perturbations, the linear MHD equations are solved as a driven problem, where the source term is the coil current  in 3D coils, i.e. in the ELM control coils and the error field correction coils (EFCC) in the case of MAST-U. In other words, at the geometrical location of the 3D magnetic coils, we have

We point out that 3D coils are located in the vacuum region outside the plasma region. No scrape-off-layer is included into the MARS-Q model.
The solution to the above equations (1)–(6) provides the plasma response to the applied 3D vacuum field. Various toroidal torques associated with 3D field response are then computed as quadratic perturbation terms, based on the linear plasma response. The surface averaged torques due to 3D fields are used as the momentum sink terms in the n = 0 toroidal momentum balance equation

which in turn is derived from the n = 0 force balance equation [22, 23]
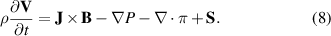
In the above two equations,  is the n = 0 plasma flow velocity,
  the viscous tensor (including neoclassical terms), and
  denoting the source term for the force that leads to the toroidal torque source
  . The quantity
  is the flux surface averaged toroidal moment. The toroidal torques, produced by 3D fields, are the resonant electromagnetic torque (
 ), the NTV torque (TNTV), as well as the torque associated with the Reynolds stress tensor (TREY). The first term from the right hand side of equation (7) represents the momentum radial diffusion and pinch
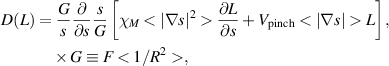
where s labels the radial coordinate, F is the equilibrium poloidal current flux function, χM the (anomalous) toroidal momentum diffusion coefficient, and  the pinch velocity. The pinch term is neglected in all the simulations reported in this work, since no well established pinch model is available for these MAST plasmas. Moreover, previous MARS-Q modeling for MAST [19], without inclusion of the pinch term, produced quantitative agreement of the flow damping with experiments, indicating that the momentum pinch may not play a significant role in MAST plasmas. The momentum diffusion coefficient is assumed to be ∼ 1 m2/s. This is the typical value for MAST plasmas according to the neoclassical prediction [24].
Next, we assume that a momentum balance has been achieved before applying 3D fields, satisfying
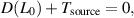
where the source term may contain momentum input due to, e.g. tangential neutral beam injection, as well as toroidal torque that produces intrinsic rotation.
After application of 3D fields, we define  , and obtain the following momentum balance equation for the change of momentum ΔL
Note that we implicitly assumed here that the application of 3D fields does not affect the momentum diffusion coefficient nor the momentum source term. This is a model assumption. In particular, the presence of 3D fields may alter the intrinsic torque, thus leading to an extra term to equation (9). This is neglected in our present model, which appears to be capable of quantitatively re-producing the experimentally observed flow damping by RMP fields in MAST [14, 20].
In the presence of the diffusion operator, equation (9) requires two boundary conditions, at the plasma center and edge, respectively. We assume a Neumann type of boundary condition  at the plasma center. At the plasma edge, we implemented either homogeneous Neumann or Dirichlet boundary condition for ΔL in MARS-Q. Chosen in this work is the Dirichlet boundary condition at the plasma edge. For tokamak plasmas, this is a reasonable approximation of the more generic Robin boundary condition, as demonstrated in reference [25], by considering a thin scrape-off layer surrounding the plasma.
We note that the significant difference between these two types of boundary conditions is that the homogeneous Neumann (Dirichlet) condition does not allow (does allow) momentum transport across the plasma boundary. The numerical results, reported in reference [18], showed the crucial influence of the choice of the boundary condition on the simulated toroidal momentum damping and the RMP field penetration dynamics. In practice, a proper choice of the boundary condition should generally be dictated either by the experimental condition on the plasma edge rotation, or by other physics beyond the fluid theory.
To complete the discussion on the boundary conditions, we also mention that, at the radial location of the resistive wall, a jump condition has been implemented for the tangential components of the  magnetic field perturbation [26]. An ideal wall boundary condition is posed at the computational boundary, with vanishing normal component of the perturbed magnetic field.
Similarly, we derived an equation for the radial particle balance [21]
The equation is again written for the change of the plasma density, Δρn = 0, assuming that a particle balance has been achieved prior to application of 3D fields. The first two terms of the right hand side of equation (10) are due to 3D fields. The last term is due to particle diffusion. MARS-Q simultaneously solves equations (1)–(6) and (9)–(10), leading to a quasi-linear initial value formulation.
We now focus on discussing the NTV physics which play an important role in both momentum and particle transport considered in this work. The radial NTV particle flux and the toroidal NTV torque satisfies the so-called flux-force relation  , with the particle flux for each species j = i, e being calculated as [15, 16]
where nj, ej and ωtj are the number density, electric charge and thermal frequency of jthth particle, respectively, R0 the plasma major radius,  the inverse aspect ratio, q the safety factor, ψp the equilibrium poloidal flux, and V the plasma volume enclosed by the flux surface. The factor λn scales as square of the perturbed field amplitude and the toroidal mode number n, and generally depends on the plasma collisionality regime. In the limit of low collisionality, λn is proportional to the resonant operator
  , where
  is the toroidal E× B rotation frequency and ωd is the particle's toroidal precessional drift frequency due to ∇B and magnetic curvature. An analytic approximation for λn has been proposed to smoothly connect results obtained at various collisionality limits [15].
  is the so-called neoclassical offset rotation [27]. The NTV theory thus predicts that the toroidal torque as well as the particle flux vanishes when the plasma rotation relaxes to the neoclassical offset rotation.
We mention that the NTV torque can also be computed by the drift kinetic solver incorporated into the MARS-K code [28]. A successful benchmark has been carried out between Shaing's semi-analytic formulation and the MARS-K formulation based on full toroidal geometry, for the NTV torque calculation [29].
In this work, we shall mainly consider the possibility of flow profile control for L-mode plasmas in MAST-U. The modeling is however based on existing discharges from MAST. We choose one discharge (22 264) from a series of experiments performed with connected double-null (CDN) configuration, shown in figure 1. This plasma configuration enters H-mode at relatively small n = 2 EFCC current, but remains in L-mode in discharge 22 264, when large n = 2 EFCC current is applied (the H- to L-mode transition occurs at about 230 ms). Two time slices (200 ms versus 250 ms) will be considered, with the major difference in the strongly damped plasma flow at the later time.
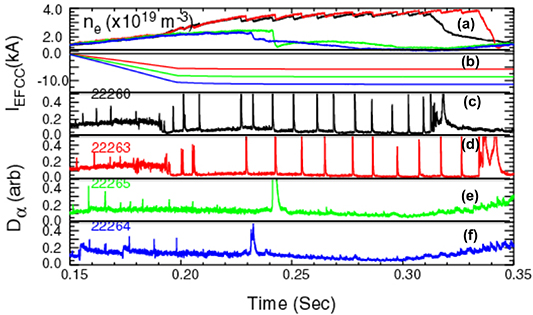
Figure 1. A series of connected double-null discharges in MAST, where the n = 2 EFCC current is progressively increased to brake the plasma toroidal flow. Shown are (a) the line averaged electron density, and (b) the EFCC current waveform, for several discharges. The  signals for these discharges are plotted in (c)–(f), respectively. The CDN discharge 22 264, at the highest EFCC current, remains in L-mode and is adopted as one of the reference plasmas for modeling.
Download figure:
Standard image High-resolution imageThe other discharge (30 128) will be chosen from a series of n = 2 RMP coil phasing scan experiments in MAST with lower single-null (LSN) configuration, reported in figure 2. In this series of discharges, the toroidal phase of the applied n = 2 RMP coil current is varied with respect to that of the n = 1 EFCC current, which is kept at constant level. Note that the plasma density was not kept the same in all discharges even before the application of the RMP field, due to different initial fueling conditions. Discharge 30 128, with the coil phasing of 30°, experiences the strongest plasma flow damping and remains in L-mode. For our modeling, we again choose two time slices from this discharge, one before the flow damping (at 250 ms) and one after the flow damping (at 350 ms). The reconstructed plasma equilibria, taking into account both magnetic and kinetic profile measurements, are reported in the next figures.

Figure 2. A series of lower single null discharges in MAST, where the toroidal phase  of the ELM control coil is varied to influence the toroidal plasma flow. The LSN discharge 30 128, with
  , achieves the strongest flow damping and is adopted as one of the reference plasmas for modeling.
Download figure:
Standard image High-resolution imageFigure 3 shows the plasma boundary shapes for the CDN discharge 22 264 and the LSN discharge 30 128, at selected time slices. The geometrical location of the RMP coils, as well as that of the EFCC, is also plotted on the R-Z plane. Note that the EFCC are the same for MAST and MAST-U, consisting of 4 large window-frame coils along the toroidal angle. MAST-U has new design for the RMP coils (dashed lines) as compared to that in MAST (solid lines). Along the toroidal angle, there are 4 coils in the upper row and 8 coils in the lower row in MAST-U, whereas 6 coils in the upper row and 12 coils in the lower row in MAST. The coil current capacity is designed at 8.4 kAt for MAST-U, for both RMP coils and EFCC. In particular, the RMP coils consist of 4 turns with 2.1 kA per turn, and the EFCC have 3 turns with 2.8 kA per turn.

Figure 3. The plasma boundary shapes and the geometrical location of the RMP coils in MAST (dashed lines) and MAST-U (solid lines) for (a) connected double null discharge 22 264 at 200 ms (dashed line) and 250 ms (solid line), respectively, and (b) lower single null discharge 30 128 at 250 ms (dashed line) and 350 ms (solid line), respectively. Shown in (b) is also the EFCC location, being the same for MAST and MAST-U.
Download figure:
Standard image High-resolution imageThe basic equilibrium profiles for discharges 22 264 and 30 128 are shown in figures 4 and 5, respectively. The motional Stark effect (MSE) was employed to measure the safety factor. The thermal ion temperature and the toroidal rotation profiles were measured by the charge exchange recombination spectroscopy. The electron density and temperature were measured by the Thompson scattering system in MAST. In both discharges, the toroidal plasma flow is well damped at later time, by the applied 3D fields. This will have implications on the computed NTV torque, as will be reported later on. Note also that the reconstructed on-axis safety factor is near or above 1 in discharge 22 264, whilst being close or below 1 in discharge 30 128.

Figure 4. The plasma equilibrium profiles of (a) the safety factor, (b) the pressure normalized by  , (c) the plasma density normalized to unity at the magnetic axis, and (d) the toroidal rotation frequency normalized by the Alfven frequency, reconstructed for MAST discharge 22 264 at 200 ms (dashed lines) and 250 ms (solid lines), respectively. ψp is the equilibrium poloidal flux normalized to 0 at the magnetic axis and 1 at the plasma boundary.
Download figure:
Standard image High-resolution image
Figure 5. The plasma equilibrium profiles of (a) the safety factor, (b) the pressure normalized by  , (c) the plasma density normalized to unity at the magnetic axis, and (d) the toroidal rotation frequency normalized by the Alfven frequency, reconstructed for MAST discharge 30 128 at 250 ms (dashed lines) and 350 ms (solid lines), respectively. ψp is the equilibrium poloidal flux normalized to 0 at the magnetic axis and 1 at the plasma boundary.
Download figure:
Standard image High-resolution image3. Toroidal torques at slow plasma flow
In what follows, we report MARS-Q results on toroidal torque computation and optimization for discharges 22 264 and 30 128. The torques are computed using the perturbed quantities (the perturbed plasma current, magnetic field, velocity as well as the plasma displacement) associated with the linear plasma response computed by the code. Three torques are compared: the resonant electromagnetic torque, the NTV torque, and the toroidal torque due to Reynolds stress. We consider the MAST coils first. As mentioned before, the n = 2 plasma response is computed at given (fixed) plasma toroidal rotation in this section. The plasma flow will be allowed to vary in the self-consistent quasi-linear simulations to be reported in section 4.
We try to answer the first question posed in section 1, namely whether large NTV torque can be generated by RMP coils in MAST(-U) plasmas, if the plasma toroidal flow is sufficiently slow. In order to utilize the NTV torque for controlling the plasma flow profile, the NTV torque has to be at least as large as the other two types of torques (i.e. those associated with Maxwell and Reynolds stresses) by amplitude. The answer to this question is shown in figures 6 and 7.

Figure 6. The MARS-Q computed surface averaged toroidal torque densities, produced by the upper row (left panels), lower row (middle panels) and EFC (right panels) coils in MAST, at 1 kAt current amplitude and with the n = 2 configuration, for (a)–(c) the CDN discharge 22 264 at 250 ms and (d)–(f) the LSN discharge 30 128 at 350 ms. Compared are the resonant electromagnetic torque (labeled as 'JXB'), the NTV torque (labeled as 'NTV'), and the toroidal torque associated with the Reynolds stress (labeled as 'REY'). ψp is the equilibrium poloidal flux normalized to 0 at the magnetic axis and 1 at the plasma boundary.
Download figure:
Standard image High-resolution image
Figure 7. The MARS-Q computed surface averaged toroidal torque densities of the resonant electromagnetic torque (left panels), the NTV torque (middle panels), and the toroidal torque associated with the Reynolds stress (right panels), for (a)–(c) the CDN discharge 22 264 at 250 ms and (d)–(f) the LSN discharge 30 128 at 350 ms. Compared are torques produced by the upper row ('UPP'), lower row ('LOW') and EFC ('EFC') coils, all at 8.4 kAt and in the n = 2 configuration, as well as by the measured n = 2 error field ('EF') in MAST. ψp is the equilibrium poloidal flux normalized to 0 at the magnetic axis and 1 at the plasma boundary.
Download figure:
Standard image High-resolution imageFigure 6 compares the MARS-Q computed toroidal torque densities among the three types of torques, assuming the MAST reference equilibria from the CDN discharge 22 264 at 250 ms and the LSN discharge 30 128 at 350 ms, where the plasma flow speed has been substantially reduced due to the application of 3D fields. The results are obtained assuming each individual row of RMP/EFC coils in MAST. The oscillation behavior of the torque density profiles are related to the rational surfaces. In particular, when a static field is applied to a rotating plasma, resonances occur between the field perturbation and continuum waves (shear Alfvén wave and sound wave) of the plasma, leading to a peculiar "resonant splitting" effect, where the resonant surfaces radially shift away from the rational surface from both sides, creating more oscillations in the response solution and in the resulting torques, as has been systematically shown in reference [31].
The torque associated with the Reynolds stress tensor is generally small compared to the other two types, in particular in the plasma core region. Comparing the electromagnetic and the NTV torques, the latter is larger than the former in the plasma core region, whilst being generally smaller near the plasma edge. This means that the NTV torque can be exploited for controlling the plasma core flow, whilst controlling the plasma edge flow probably involves combination of all three types of torques induced by 3D fields.
Comparing the overall torque amplitude generated by different rows of coils (at the same current), all three rows give the similar level for the CDN discharge 22 264. This is because the two rows of the RMP coils have similar distance to the plasma in this CDN discharge. The EFCC are located further away from the plasma, but on the other hand with much larger coil size. For the LSN discharge 30 128, the lower row of RMP coils is located closest to the plasma, the torques generated by the lower row are the largest as expected. We remark that a unit current (of 1 kAt) is assumed in figure 6. The torque amplitude is proportional to the square of the applied coil current amplitude.
Figure 7 makes the torque comparison in a different way. Here we compare the torque densities generated by different rows of coils, for a given torque type. In addition, we also compare the toroidal torque generated by the n = 2 intrinsic error field (EF) in MAST [30]. To make quantitative comparisons, we assume 8.4 kAt coil current in RMP and EFC coils here (this is the maximally allowed coil current in MAST-U). Evidently, the torque due to the n = 2 EF is small compared to that generated by 3D coils at maximum current. The EF will be neglected in quasi-linear simulations reported later on, where 8.4 kAt coil current is assumed in both RMP coils and EFCC. Evidently, figure 7 also shows that the n = 2 EF cannot be ignored, if small current (say ∼ 1 kAt) were assumed in RMP and EFC coils.
Next, we address the second question from section 1. For the CDN discharge 22 264, because of the up-down symmetry (with respect to the plasma) in the geometrical location of the two rows of the RMP coils, we shall scan the toroidal phase of the n = 2 coil current in the lower row, while fixing the coil phase for the upper row. The EFCC are neglected here. For the LSN discharge 30 128, since the role of the upper row of the RMP coils is much smaller than that of the lower row, as shown by figure 7(d)–(f), we shall neglect the upper row, and scan the relative coil phase between the lower row and EFCC. Furthermore, we shall compare the volume integrated net torques in the plasma core and edge regions separately. The core and edge regions are defined as  and
and  , respectively, with ψp being the equilibrium poloidal flux normalized to 0 at the magnetic axis and 1 at the plasma boundary.
We remark that this separation of core from edge regions is certainly not uniquely defined. Our choice gives a rough guidance for controlling the relative torque amplitude between the plasma core and edge. This can be viewed as the simplest way of controlling the plasma rotation profile. Fine local tuning of the plasma rotation profile is possible but requires more specific objective functions to be defined. For practical applications, this simple two-region separation may offer more robust solutions for the plasma flow profile control. For instance, during ELM control by RMP fields, our first-order objective is to minimize the core flow damping (to avoid mode locking) whist optimizing the edge flow damping (to allow field penetration into the plasma pedestal).
The MARS-Q computed core and edge net torques versus the n = 2 coil phase scan for the lower row of the RMP coils are plotted in figure 8, for both CDN discharge 22 264 (upper panels) and LSN discharge 30 128 (lower panels). Note that the net torque is generally negative, indicating deceleration of the plasma flow. Variation of the coil phasing results in the change of the linear plasma response fields, which in turn modify the toroidal torques as quadratic forms of the linear perturbation. In the plasma core region, the dominant net torque is contributed by NTV, for both discharges. Moreover, even parity coil configuration, i.e. with zero phase of the lower row coil current, produces the largest net core torque in both cases. The net edge torque is mainly contributed by the Reynolds stress in discharge 22 264 and by the resonant electromagnetic torque in discharge 30 128. The coil phasing, that provides the largest/smallest net edge torques, is different between these two discharges.

Figure 8. The MARS-Q computed net torques, integrated over the plasma core region (left panels) and edge region (right panels), respectively, for (a) and (b) the CDN discharge 22 264 at 250 ms and (c) and (d) the LSN discharge 30 128 at 350 ms. Compared are contributions from the resonant electromagnetic torque ('JXB'), the NTV torque ('NTV'), and the toroidal torque associated with the Reynolds stress ('REY'). The plasma core region is defined as  and the edge region as
  , with ψp being the equilibrium poloidal flux normalized to 0 at the magnetic axis and 1 at the plasma boundary. For both discharges, 1 kAt coil current is assumed with varying n = 2 current phase for the lower row of MAST RMP coils. For discharge 22 264, 1 kAt current is assumed for the upper row of MAST RMP coils with fixed 0° phase, while neglecting the EFCC. For discharge 30 128, 1 kAt current is assumed for the EFCC with fixed 0° phase, while neglecting the upper row of RMP coils.
Download figure:
Standard image High-resolution imageThe large core NTV torque is due to the resonant enhancement effect. The resonance occurs in the particle phase space. Compared to the non-resonant NTV torque which is typically small in a tokamak plasma, the resonant NTV torque can be orders of magnitude larger. For this to happen, however, two key conditions have to be satisfied [15]. One is the frequency match, between the toroidal precessional drift frequency of trapped thermal particles and the perturbation frequency in the plasma frame. For DC RMP field, the perturbation frequency in the plasma frame is essentially the plasma rotation frequency. Since the precession frequency is typically small for thermal particles, this phase space resonance can only occur at slow plasma rotation. The second condition is the plasma collisionality. Too high collisionality reduces the particle-wave Landau resonances. These two conditions are well satisfied in the plasma core region in these MAST discharges, yielding large net core NTV torque. The much smaller net edge NTV torque is due to high collisionality in the plasma edge. We mention that the NTV torque also scales quadratically with the perturbed field but in the Lagrangian form  . For plasma response field, the Eulerian part
  is typically small compared to that associated with the plasma displacement. This means that the amplitude of
  may not be larger near the plasma edge than that in the plasma core, even if the Eulerian portion is larger near the edge.
Figure 9 plots the total net torques, i.e. the sum of all three types of torques, in the core versus edge regions, while scanning the n = 2 coil phase for the lower row RMP coils. These plots show the possibility of varying the relative torque amplitude between the plasma core and edge (thus controlling the plasma rotation profile), by tuning the coil phasing in RMP coils. The flexibility is most evident for the CDN discharge 22 264 with two rows of RMP coils being powered on (figure 9(a)). Here, the maximal (minimal) net core torque is obtained with the even (odd) RMP coil configuration, whilst the maximal (minimal) net edge torque is obtained with the coil phasing of about 120° (300°). The odd parity configuration corresponds to 180° phase for the lower row of RMP coils.

Figure 9. The MARS-Q computed total torques (sum of the resonant electromagnetic torque, the NTV torque and the toroidal torque associated with the Reynolds stress), integrated over the plasma core region (in red) and edge region (in blue), respectively, for (a) the CDN discharge 22 264 at 250 ms and (b) the LSN discharge 30 128 at 350 ms. The plasma core region is defined as  and the edge region as
  , with ψp being the equilibrium poloidal flux normalized to 0 at the magnetic axis and 1 at the plasma boundary. For both discharges, 1 kAt coil current is assumed with varying n = 2 current phase for the lower row of MAST RMP coils. For discharge 22 264, 1 kAt current is assumed for the upper row of MAST RMP coils with fixed 0° phase, while neglecting the EFCC. For discharge 30 128, 1 kAt current is assumed for the EFCC with fixed 0° phase, while neglecting the upper row of RMP coils.
Download figure:
Standard image High-resolution imageFor LSN discharge 30 128 with the EFCC and the lower row of RMP coils (figure 9(b)), the net edge torque is relatively small compared to that in the core. It is therefore more effective to control the plasma core flow in this case, by tuning the coil phasing. We point out that the large net core torque comes from the NTV contribution provided by the lower row of RMP coils (figure 6(e)), which are close to the plasma surface for the LSN configuration (figure 3(b)). The maximal (minimal) net core torque is obtained again with the even (odd) RMP coil configuration, similar to that in discharge 22 264.
4. Damping of fast initial flow
Having obtained positive answers to the previous two questions posed in section 1, we now address the third question, namely whether it is possible to brake the plasma flow to sufficiently slow speed in MAST(-U) plasmas by 3D fields at the first place, in order to allow the flow profile control with the NTV torque. In what follows, we shall consider several reference plasmas from MAST discharges, all having fast plasma flow. The first two discharges are 22 264 and 30 128 at early stage (before the flow damping by 3D fields). Two additional L-mode CDN discharges will also be considered, both having on-axis safety factor below 1 and fast toroidal flow. The key global parameters for all the equilibria studied in this work are listed in table 1.
Table 1. Key equilibrium parameters for reference MAST plasmas studied in this work, for the plasma major radius R0, the toroidal vacuum magnetic field B0 defined at R0, the plasma current Ip, the on-axis electron number density ne(0), the on-axis toroidal rotation frequency Ω(0), the on-axis safety factor q0, the safety factor at 95% equilibrium poloidal flux surface q95, and the normalized plasma beta βN.
| Discharge | Time | R0 | B0 | Ip | ne(0) | Ω(0) | q0 | q95 | βN |
|---|---|---|---|---|---|---|---|---|---|
| # | (ms) | (m) | (T) | (MA) | (1019m−3) | (krad/s) | |||
| 22 264 | 200 | 0.88 | 0.46 | 0.73 | 3.46 | 139.6 | 1.47 | 5.71 | 1.84 |
| 22 264 | 250 | 0.85 | 0.48 | 0.73 | 2.04 | 9.9 | 0.95 | 5.05 | 1.03 |
| 30 128 | 250 | 0.85 | 0.45 | 0.63 | 2.54 | 84.6 | 0.96 | 4.36 | 3.98 |
| 30 128 | 350 | 0.86 | 0.44 | 0.62 | 2.58 | 15.6 | 0.71 | 3.62 | 2.07 |
| 28 912 | 290 | 0.84 | 0.43 | 0.80 | 5.19 | 122.7 | 0.75 | 4.46 | 3.10 |
| 29 222 | 290 | 0.81 | 0.50 | 0.81 | 3.73 | 170.8 | 0.78 | 5.28 | 2.37 |
The MAST-U ELM control and error field control coils will be considered in the remaining studies, with the maximal coil current capability of 8.4 kAt for both sets. We again consider two rows of RMP coils for all CDN plasmas (neglecting the EFCC), whilst the EFCC combined with the lower row of RMP coils for the LSN plasma (neglecting the upper row of RMP coils).
Before performing quasi-linear initial value simulations for the flow damping, we repeat the exercise of finding the extreme values for coil phasing that maximize/minimize the net core/edge toroidal torques, based on the linear plasma response, in this subsection. These extreme values of coil phasing will then be chosen for quasi-linear simulations to be reported in subsection 4.2. Note that the key difference from the studies reported in section 3 is the fast initial plasma flow assumed below.
4.1. Torques with MAST-U 3D coils
Figure 10 plots various toroidal torque density profiles for the CDN discharge 22 264 and the LSN discharge 30 128. The major difference, compared to that reported in figure 6, is that the NTV torque now generally provides the smallest contribution to the total torque, when the plasma flow is fast. The largest contribution, in particular in the plasma core region, is provided by the resonant electromagnetic torque in both discharges, indicating that the initially fast plasma flow has to be damped by the resonant torque in MAST-U, before the NTV torque can be employed to control the plasma flow profile.

Figure 10. The MARS-Q computed surface averaged toroidal torque densities, produced by the upper row (left panels), lower row (middle panels) and EFC (right panels) coils designed for MAST-U, at 1 kAt current amplitude and with the n = 2 configuration, for (a)–(c) the CDN discharge 22 264 at 200 ms and (d)–(f) the LSN discharge 30 128 at 250 ms. Compared are the resonant electromagnetic torque ('JXB'), the NTV torque ('NTV'), and the toroidal torque associated with the Reynolds stress ('REY'). ψp is the equilibrium poloidal flux normalized to 0 at the magnetic axis and 1 at the plasma boundary.
Download figure:
Standard image High-resolution imageThe above observations are also confirmed by figure 11, showing the net core and edge torques while scanning the n = 2 coil current phase in the lower row of the RMP coils. The net resonant electromagnetic torque generally dominates in both the core and edge regions, with the only exception of the net edge torque in discharge 30 128 (figure 11(d)), where the Reynolds stress torque is comparable to the resonant torque by amplitude. It is evident that the coil phasing can still be used as a tool to control the core versus edge flow damping in these MAST plasmas.

Figure 11. The MARS-Q computed net torques, integrated over the plasma core region (left panels) and edge region (right panels), respectively, for (a) and (b) the CDN discharge 22 264 at 200 ms and (c) and (d) the LSN discharge 30 128 at 250 ms. Compared are contributions from the resonant electromagnetic torque ('JXB'), the NTV torque ('NTV'), and the toroidal torque associated with the Reynolds stress ('REY'). The plasma core region is defined as  and the edge region as
  , with ψp being the equilibrium poloidal flux normalized to 0 at the magnetic axis and 1 at the plasma boundary. For both discharges, 1 kAt coil current is assumed with varying n = 2 current phase for the lower row of MAST-U RMP coils. For discharge 22 264, 1 kAt current is assumed for the upper row of MAST-U RMP coils with fixed 0° phase, while neglecting the EFCC. For discharge 30 128, 1 kAt current is assumed for the EFCC with fixed 0° phase, while neglecting the upper row of RMP coils.
Download figure:
Standard image High-resolution imageAlthough not shown here, the resonant electromagnetic torque also provides the dominant contribution in the other two CDN MAST discharges reported in figure 12. The sum of all three torque contributions is shown in this figure. These two discharges are similar in many aspects, with the exception of the plasma density and the toroidal flow speed (table 1). Interestingly, the toroidal speed, normalized by the Alfvén speed, is similar too for these two discharges (Ω(0) = 0.112ωA in discharge 28 912 and Ω(0) = 0.109ωA in discharge 29 222). Not surprisingly, the variation of the computed net core/edge torques versus the coil phasing also follows similar patterns. Figure 12 also plots the total net torque (acting on the whole plasma volume) as the sum of the core and edge contributions, versus the coil phasing. Evidently the strongest overall flow damping is obtained for these two discharges, if the coil phasing is chosen to be ∼ 200°.
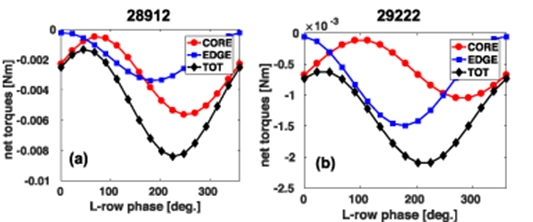
Figure 12. The MARS-Q computed total torques (sum of the resonant electromagnetic torque, the NTV torque and the toroidal torque associated with the Reynolds stress), integrated over the plasma core region (in red) and edge region (in blue), respectively, for (a) discharge 28 912 at 290 ms and (b) discharge 29 222 at 290 ms. The plasma core region is defined as  and the edge region as
  , with ψp being the equilibrium poloidal flux normalized to 0 at the magnetic axis and 1 at the plasma boundary. Shown is also the total net torque (in black) integrated over the plasma volume. For both discharges, 1 kAt coil current is assumed for both rows of MAST-U RMP coils, while varying the n = 2 current phase for the lower row at fixed 0° phase for the upper row. The EFCC are neglected.
Download figure:
Standard image High-resolution imageWe note that the toroidal torques, computed assuming the linear plasma response, only provide qualitative indication on potential effect of 3D fields on the plasma flow damping. Whether the given torque can indeed damp the plasma flow (and to which degree) can only be determined by solving the toroidal momentum balance equations. Because of the non-linear coupling between plasma flow and plasma response, quantitative results can only be obtained by modeling the whole dynamic process. This is carried out with the MARS-Q code in this work as reported in the next subsection.
4.2. Quasi-linear simulations of flow damping with MAST-U coils
The MARS-Q initial value simulations are performed assuming various extreme values for the coil phasing reported in subsection 4.1. These extreme values are listed in table 2. Four objective functions (OF) are defined based on the toroidal torques computed in subsection 4.1, i.e. OF-A to OF-D as defined in table 2. The first two choices (OF-A and OF-B) of objective functions are motivated by our desire to damp the plasma flow in different manner in different regions, if possible. The general goal here is of course to globally damp the plasma flow (OF-C). On the other hand, we also wish to see how much flow damping can be achieved, if we choose the 'worst' coil phasing that minimizes the overall toroidal torque (OF-D). We remark that these choices of OF are certainly not exclusive.
Table 2. The optimal coil phasing based on the MARS-Q computed toroidal torques for various MAST discharges, assuming the MAST-U 3D coils and according to different objective functions (OF), OF-A: maximizing the ratio of the net core-to-edge torques; OF-B: minimizing the ratio of the net core-to-edge torques; OF-C: maximizing the total net torque acting on the whole plasma volume; OF-D: minimizing the total net torque.
| Discharge | Time | ||||
|---|---|---|---|---|---|
| # | (ms) | OF-A | OF-B | OF-C | OF-D |
| 22 264 | 200 | 315° | 225° | 90° | 270° |
| 30 128 | 250 | 90° | 225° | 0° | 180° |
| 28 912 | 290 | 0° | 90° | 220° | 45° |
| 29 222 | 290 | 0° | 100° | 210° | 35° |
Obviously both CDN discharges 28 912 and 29 222 have similar optima, due to the fact that both have similar plasma parameters and the same (RMP) coils. Discharges 22 264 and 30 128 generally have different optima, due to the differences both in the plasma configuration (CDN versus LSN) and in the coil configuration (two RMP rows versus EFCC combined with the lower RMP row).
We remark that it is not the purpose of this work to re-produce experimental results in these MAST discharges using MARS-Q. Such studies have previously been carried out [19, 20]. The MARS-Q simulations reported below primarily aim at answering the third question posed in section 1, namely whether the new MAST-U RMP coils (in combination with EFCC) can be utilized to damp fast plasma flow.
Figure 13 reports the MARS-Q simulation results for the LSN discharge 30 128, starting from the fast initial flow at 250 ms and assuming the coil phasing (90°) that maximizes the ratio of the net core-to-edge torques (OF-A). The key result is the eventual strong flow damping (figure 13(d)), including that in the plasma core, due to the applied 3D field. The damping process, interestingly, involves two stages. During the first stage, for the simulation time up to ∼ 90 ms, the resonant electromagnetic torque is dominant (figure 13(b)), resulting in a steady but slow damping of the plasma flow. This is followed by a sharp transition phase, when the NTV torque provides the dominant contribution and the toroidal flow is quickly damped until reaching a steady state profile during the second stage of evolution. The resonant field amplitude also sharply increases (figure 13(a)), at all n = 2 rational surfaces, during the transition phase.

Figure 13. The MARS-Q quasi-linear simulation results based on the equilibrium from MAST LSN discharge 30 128 at 250 ms, assuming 8.4 kAt MAST-U coil current for both the EFCC and the lower rows of RMP coils (the upper row is neglected). The n = 2 current phase is fixed at 0° for the EFCC and 90° for the lower row of RMP coils. Shown are (a) time traces of the amplitude of the resonant radial field components at corresponding rational surfaces ranging from q = 2/2 (the lowest curve) to q = 15/2 (the top curve), (b) time traces of the net toroidal torques for the resonant electromagnetic torque ('JXB'), the NTV torque ('NTV'), and the toroidal torque associated with the Reynolds stress ('REYNOLDS'), (c) profile evolution of the plasma density, and (d) profile evolution of the plasma toroidal rotation frequency. Plots (c)–(d) show the profiles at ∼ 12.5 ms time interval, with the thick blue (red) line indicating the initial (final) profiles of the simulation. The vertical dashed lines indicate locations of rational surfaces associated with the n = 2 perturbation.
Download figure:
Standard image High-resolution imageWe emphasize that the whole process evolves in a self-consistently manner within the MARS-Q model. This also means that the optimal coil phasing of 90°, predicted assuming the initial toroidal rotation according to OF-A, may not be optimal during the whole dynamic process where the flow profile evolves. Nevertheless, this optimal coil phasing, based on initial flow, helps to provide sufficient toroidal torque in the plasma core region at the beginning of the quasi-linear simulation, which in turn kicks off the flow damping process. Finally, we remark that, although not being the focus of this study, the applied 3D field also induces global density pumpout during the process, as shown by figure 13(c). The density pumpout is a result of the particle diffusion and radial particle fluxes (associated with fluid convection as well as NTV) due to 3D fields, within the MARS-Q model [21]. In this specific case, the plasma density becomes very small in the outer plasma region with ψp > 0.6, towards the end of the simulation. The physics mechanism of the density pumpout, due to 3D fields, is multifaceted, including (macroscopic) MHD activity, field line stochasticity induced by magnetic islands overlapping, potential enhancement of plasma turbulence, as well as particle fluxes associated with NTV. The MARS-Q model captures the MHD effect and the neoclassical effect, whilst ignoring the effects associated with field line stochasticity and (enhanced) turbulence. We also note that a lower limit for the density, of ∼ 10−3 of the on-axis value, is posed during the MARS-Q simulations, in order to prevent the density from being vanishing or even negative.
In the opposite case for the coil phasing, that minimizes the ratio of the core-to-edge torques (OF-B), the MARS-Q simulation shows much weaker flow damping (figure 14). In this case, the simulation reaches steady state after about 20 ms. No two-stage evolution occurred even when the simulation was carried out for much longer time. Note that a sharp transition does occur for the net NTV torque at about 10 ms simulation time (figure 14(b)), but this does not lead to strong damping of the plasma flow. The weak core flow damping in this case is related to the small torque in the plasma core region (figure 11(c) and (d)) during the initial phase of simulation. Certain level of density pumpout, on the other hand, is still obtained by MARS-Q with this coil phasing. Comparing the final steady state rotation profiles shown in figures 13(d) and 14(d), we find that the plasma core flow profile can indeed be significantly tailored by tuning the coil phasing.

Figure 14. The MARS-Q quasi-linear simulation results based on the equilibrium from MAST LSN discharge 30 128 at 250 ms, assuming 8.4 kAt MAST-U coil current for both the EFCC and the lower rows of RMP coils (the upper row is neglected). The n = 2 current phase is fixed at 0° for the EFCC and 225° for the lower row of RMP coils. Shown are (a) time traces of the amplitude of the resonant radial field components at corresponding rational surfaces, (b) time traces of the net toroidal torques for the resonant electromagnetic torque ('JXB'), the NTV torque ('NTV'), and the toroidal torque associated with the Reynolds stress ('REYNOLDS'), (c) profile evolution of the plasma density, and (d) profile evolution of the plasma toroidal rotation frequency. In plots (c) and (d), the thick blue (red) line indicates the initial (final) profiles of the simulation, and the vertical dashed lines indicate locations of rational surfaces associated with the n = 2 perturbation.
Download figure:
Standard image High-resolution imageThe MARS-Q simulation with coil phasing that maximizes the net torque over the whole plasma volume (OF-C) shows stronger and faster flow damping than that shown in figure 13 with OF-A. The overall evolution pattern is otherwise similar to that shown in figure 13 (e.g. two-stage process is again observed). On the other hand, the evolution pattern with OF-D (minimizing the overall torque) is similar to that reported in figure 14.
The MARS-Q simulated non-linear dynamics, however, are different for the CDN discharge 22 264. One example is shown in figure 15, assuming the coil phasing obtained with OF-A. The toroidal flow is substantially damped outside the plasma minor radius of ψp = 0.2, but the on-axis flow is not much affected by the 3D field. Strong density pumpout, on the other hand, is obtained. In particular, the strong flow damping near the q = 2 surface leads to mode locking in this simulation. We remark that the full mode locking process cannot be properly simulated with the quasi-linear model, which neglects non-linear effects due to the presence of large magnetic islands. In fact, numerical crash of the simulation will occur if the simulation is pursued further in this case, due to lack of non-linear physics in the MARS-Q model.

Figure 15. The MARS-Q quasi-linear simulation results based on the equilibrium from MAST CDN discharge 22 264 at 200 ms, assuming 8.4 kAt MAST-U RMP coil current for both upper and lower rows (the EFCC are neglected). The n = 2 current phase is fixed at 0° for the upper row and 315° for the lower row of RMP coils. Shown are (a) time traces of the amplitude of the resonant radial field components at corresponding rational surfaces, (b) time traces of the net toroidal torques for the resonant electromagnetic torque ('JXB'), the NTV torque ('NTV'), and the toroidal torque associated with the Reynolds stress ('REYNOLDS'), (c) profile evolution of the plasma density, and (d) profile evolution of the plasma toroidal rotation frequency. In plots (c) and (d), the thick blue (red) line indicates the initial (final) profiles of the simulation, and the vertical dashed lines indicate locations of rational surfaces associated with the n = 2 perturbation.
Download figure:
Standard image High-resolution imageLarge flow damping beyond the ψp = 0.2 surface is simulated for all four choices of coil phasing from table 2 for discharge 22 264. Time traces for these four choices of coil phasing are compared in figure 16(a)–(b), for the net density pumpout fraction and the toroidal rotation frequency at the q = 2 surface, respectively. Note that similar density pumpout level, of about 40%, is achieved in all four cases after 28 ms, though the case with OF-C sees an interesting transient density pumping effect, during the initial phase of MARS-Q simulation. The plasma rotation at the q = 2 surface nearly vanishes toward the end of the simulation in all four cases, but with different flow damping rate. In particular, the case with OF-C (maximizing the overall net torque across the plasma volume) sees the fastest flow damping.

Figure 16. Time traces of the MARS-Q simulated net density pumpout (left panels) and flow damping at the q = 2 surface (right panels), for (a) and (b) the CDN discharge 22 264 starting at 200 ms and (c) and (d) the LSN discharge 30 128 starting at 250 ms. For both discharges, 8.4 kAt coil current is assumed with different n = 2 current phase (cases OF-A to OF-D) according to table 2, for the lower row of MAST-U RMP coils. For discharge 22 264, 8.4 kAt current is assumed for the upper row of MAST-U RMP coils with fixed 0° phase, while neglecting the EFCC. For discharge 30 128, 8.4 kAt current is assumed for the EFCC with fixed 0° phase, while neglecting the upper row of RMP coils.
Download figure:
Standard image High-resolution imageSimilar comparison is made for the four MARS-Q simulations for the LSN discharge 30 128, assuming the optimal coil phasing obtained with OF-A to OF-D (figure 16(c)–(d)). Two-stage core flow damping, shown at the q = 2 surface in figure 16(d), is obtained with the coil phasing that maximizes either the core net torque (OF-A) or the total net torque (OF-C). On the other hand, minor flow damping is achieved with the other two choices of the coil phasing (OF-B and OF-D). The density pumpout fraction, however, is larger with these two choices of coil phasing (OF-B and OF-D). This shows that the optimal coil phasing that maximizes the core flow damping does not necessarily lead to the strongest density pumpout. In fact, figure 16 shows that there is no overall correlation between the plasma flow damping and the density pumpout due to 3D fields, at least for the MAST plasmas simulated here.
We point out that the two-stage flow damping shown in figure 16 is not always associated with the switching of the dominant role from the electromagnetic torque to the NTV torque, as that reported in figure 13. One exception is the case OF-A from figure 16(b), where the second, sharp transition phase occurs at ∼ 18 ms, despite the fact that the electromagnetic torque remains dominant at this moment of time (figure 15(b)). On the other hand, it is known that the electromagnetic torque alone can also induce a sharp transition phase in flow damping [32]. This induction motor model based mechanism, which can be used to explain the result from figure 15, is different from the one reported in figure 13.
The strong on-axis flow damping for the LSN discharge 30 128 (figure 13(d)), and the lack of that for the CDN discharge 22 264 (figure 15(d)), requires understanding. This is particularly important if we wish to control the plasma core flow up to the magnetic axis. Note that for both discharges, the coil phasing has already been tuned to maximize the net core torque. Three major differences can be identified between these two cases. One is the on-axis safety factor, which is below 1 in discharge 30 128 at 250 ms but above 1 in discharge 22 264 at 200 ms (table 1). The other is the plasma pressure - discharge 30 128 at 250 ms has much higher βN value than discharge 22 264. The third obvious difference is in the combination of 3D coils: for the LSN discharge 30 128, the EFCC are assumed, whilst only the RMP coils are assumed for discharge 22 264.
It is possible that a large 2/2 kink component is driven by 3D field in the plasma with q0 below 1, thus leading to more flow damping near the magnetic axis. Comparison of the perturbation structure of the linear plasma response, plotted in figure 17, however, shows somewhat larger 2/2 component in the plasma core region for the LSN discharge 30 128, but no drastic difference from that of the CDN discharge 22 264. The m =−1 harmonic is relatively larger though in discharge 30 128. The overall response amplitude, in terms of the plasma displacement, is certainly larger in discharge 30 128. This is unlikely driven by the q0 value but can be driven by the (higher) plasma pressure.

Figure 17. The MARS-Q computed linear plasma response in terms of the poloidal Fourier harmonics of the normal displacement (left panels) as well as the displacement amplitude on the poloidal cross section (right panels), for (a) and (b) the CDN discharge 22 264 at 200 ms and (c) and (d) the LSN discharge 30 128 at 250 ms. For both discharges, 8.4 kAt coil current is assumed with the n = 2 current phase according to OF-A from table 2, for the lower row of MAST-U RMP coils. For discharge 22 264, 8.4 kAt current is assumed for the upper row of MAST-U RMP coils with fixed 0° phase, while neglecting the EFCC. For discharge 30 128, 8.4 kAt current is assumed for the EFCC with fixed 0° phase, while neglecting the upper row of RMP coils.
Download figure:
Standard image High-resolution imageTo further test this issue, we consider two other MAST plasmas (discharges 28 912 and 29 222 from table 1) with q0 below 1, but otherwise similar plasma and coil configurations to that for discharge 22 264. Note that discharge 28 912 also has reasonably high βN value. On the other hand, no significant on-axis flow damping is obtained with the MARS-Q simulations, as shown in figures 18 and 19. This excludes the role of the on-axis safety factor, as well as the βN factor, as the possible reason for the large on-axis flow damping shown in figure 13. The 3D field produced by the EFCC is the most likely reason for causing the on-axis flow damping. The 3D coils located at the outboard mid-plane is known to produce field spectrum that facilitates the plasma core flow damping [33].

Figure 18. The MARS-Q quasi-linear simulation results based on the equilibrium from MAST discharge 28 912 at 290 ms, assuming 8.4 kAt MAST-U RMP coil current for both upper and lower rows (the EFCC are neglected). The n = 2 current phase is fixed at 0° for the upper row and 220° for the lower row of RMP coils. Shown are (a) time traces of the amplitude of the resonant radial field components at corresponding rational surfaces, (b) time traces of the net toroidal torques for the resonant electromagnetic torque ('JXB'), the NTV torque ('NTV'), and the toroidal torque associated with the Reynolds stress ('REYNOLDS'), (c) profile evolution of the plasma density, and (d) profile evolution of the plasma toroidal rotation frequency. In plots (c) and (d), the thick blue (red) line indicates the initial (final) profiles of the simulation, and the vertical dashed lines indicate locations of rational surfaces associated with the n = 2 perturbation.
Download figure:
Standard image High-resolution image
Figure 19. The MARS-Q quasi-linear simulation results based on the equilibrium from MAST discharge 29 222 at 290 ms, assuming 8.4 kAt MAST-U RMP coil current for both upper and lower rows (the EFCC are neglected). The n = 2 current phase is fixed at 0° for the upper row and 210° for the lower row of RMP coils. Shown are (a) time traces of the amplitude of the resonant radial field components at corresponding rational surfaces, (b) time traces of the net toroidal torques for the resonant electromagnetic torque ('JXB'), the NTV torque ('NTV'), and the toroidal torque associated with the Reynolds stress ('REYNOLDS'), (c) profile evolution of the plasma density, and (d) profile evolution of the plasma toroidal rotation frequency. In plots (c) and (d), the thick blue (red) line indicates the initial (final) profiles of the simulation, and the vertical dashed lines indicate locations of rational surfaces associated with the n = 2 perturbation.
Download figure:
Standard image High-resolution image
We also remark that discharges 28 912 and 29 222 have similar plasma conditions (except the difference in the plasma density as reported in table 1) as well as with the same set of 3D coils being employed, yet the simulated flow profile evolution differs, as shown by figures 18(d) and 19(d). This indicates that the flow damping is sensitive to the details of the plasma equilibrium. The density pumpout appears to be more robust - large density pumpout is obtained for both discharges.
5. Conclusion and discussion
MARS-Q modeling has been performed to study the feasibility of applying the n = 2 3D fields, within the coil capability of the MAST-U spherical tokamak, to control the plasma toroidal rotation profile in this new device. The present study focuses on the L-mode regime. Both linear resistive plasma response computations and quasi-linear initial value simulations have been carried out, based on reference CDN and LSN plasmas from MAST. These investigations help to answer the three key questions posed in the Introduction section.
Various toroidal net torques, in the core and edge regions of the plasma, are computed based on the linear plasma response. We find that large NTV torque is achievable in MAST(-U) plasmas, provided that the initial plasma flow is sufficiently slow. In fact, the NTV torque becomes the dominant contributor to the total torque due to 3D fields in the plasma core region, at slow plasma flow. In the plasma edge region, the NTV torque is not dominant even at slow plasma flow. In the opposite limit of fast initial flow, the MARS-Q computed net toroidal torque is generally dominated by the resonant electromagnetic contribution, in both the core and edge regions of the plasma.
In the case of slow initial flow, it is possible to significantly vary the NTV torque amplitude in the plasma core region, by tuning the coil phasing among the 3D field coils. This is demonstrated by considering two typical combinations of 3D coils. One combination, applied to the CDN plasma configuration, assumes fixed n = 2 coil current phase in the upper row of the ELM control coils, while scanning the current phase in the lower row. The other combination, applied to the LSN configuration, assumes fixed current phase for the EFCC, while scanning the current phase for the lower RMP row. The possibility of achieving large NTV torque in the plasma core, as well as strong variation of the latter with respect to the coil phasing, allows flexibility in controlling the plasma flow profile in spherical tokamaks such as MAST-U, when the initial flow speed is not fast.
For the above slow flow condition to be satisfied, 3D fields need to be applied to the MAST-U plasmas, in order to damp the (potentially) initial fast flow, relying primarily on the resonant electromagnetic torque. This has been shown to be feasible by MARS-Q simulations for the reference MAST plasmas, with either CDN or LSN configuration, by utilizing the MAST-U 3D coils at the maximal coil current capacity of 8.4 kAt. In particular, the EFCC system is found to be effective in damping the plasma on-axis flow. Even without EFCC, the ELM control coils are capable of reducing the plasma flow to zero level, in the wide plasma region beyond the minor radius of ψp = 0.2. In addition, MARS-Q modeling finds that there is no overall correlation between the plasma flow damping and the density pumpout for the MAST plasmas simulated in this work.
The findings from this study will help to guide designing future RMP experiments in MAST-U, for the purpose of demonstrating flow profile control capability in spherical tokamaks.
Acknowledgments
The work was supported by US DoE Office of Science under Contract DE-SC0018992 and DE-FG02-95ER54309. Disclaimer: This report was prepared as an account of work sponsored by an agency of the United States Government. Neither the United States Government nor any agency thereof, nor any of their employees, makes any warranty, express or implied, or assumes any legal liability or responsibility for the accuracy, completeness, or usefulness of any information, apparatus, product, or process disclosed, or represents that its use would not infringe privately owned rights. Reference herein to any specific commercial product, process, or service by trade name, trademark, manufacturer, or otherwise, does not necessarily constitute or imply its endorsement, recommendation, or favoring by the United States Government or any agency thereof. The views and opinions of authors expressed herein do not necessarily state or reflect those of the United States Government or any agency thereof.