


Abstract
Improvements in the H-mode pedestal pressure and global energy confinement were observed on DIII-D with both 3 and 6 MW of neutral beam (NBI) heating with neon injection. The pedestal pressure increased, primarily associated with a significant increase in the pedestal density with a relatively smaller decrease in the pedestal temperature. At the same neon injection rate, a rapid decrease in edge localized mode (ELM) frequency and ∼35% increase in plasma stored energy were observed in the 3 MW discharge, while in the 6 MW discharge, the ELM frequency was gradually decreased and the plasma stored energy gradually increased by up to 20%. The measured pedestal widths from both 3 and 6 MW discharges matched the EPED1.0 width scaling,  , within 20% deviations before and after neon injection. The peeling-ballooning mode (PBM) stability analysis showed that after neon injection, the ballooning stability boundary was increased, while the peeling stability boundary only dropped once the neon level was relatively high. The ballooning stability boundary increase with neon injection is consistent with increase of the ion diamagnetic stabilization (i.e. including the contribution from carbon, neon as well as deuterium ions) which is used in the criterion to determine when the calculated linear growth rates of PBM are unstable. Consequently, the new ELITE computed PBM boundaries were more consistent with the operating points than when only deuterium was included. This in turn indicates that the impurity may help to improve pedestal pressure through affecting ion diamagnetic frequency in the pedestal region, which could positively lead to the ballooning stability boundary extension.
Export citation and abstract BibTeX RIS
1. Introduction
Actively 'seeding' the divertor with impurity particles is an important way to reduce the power load on the divertor targets for both present tokamaks and the next generation of highly powered tokamaks, like ITER or DEMO [1–3]. The seeding impurities used for divertor radiation in ITER are still under discussion [4, 5]. One important issue is their impact on the structure of plasma edge transport barrier termed the H-mode 'pedestal' [6], since the pressure at the top of the pedestal strongly influences global confinement and fusion performance [7, 8].
Many seeding impurity experiments exploring the positive impact of impurity injection on the H-mode pedestal and plasma confinement have been conducted based on different operational scenarios and plasma facing components (carbon or metals, etc) around the world [2–5, 9–27]. Recent experimental reviews about the effects of impurities on pedestal and global confinement [28, 29] are available.
When JET and ASDEX-Upgrade (AUG) tokamaks changed their carbon walls into fully metal walls, the plasma energy confinement was affected and the discharges typically needed additional gas-fueling to avoid tungsten accumulation in the core [30]. The confinement loss with metal walls with respect to the carbon walls was significantly recovered by nitrogen injection in both JET [4, 20, 21] and AUG [24, 30] tokamaks. On the Alcator C-Mod tokamak with a molybdenum wall [31], the plasma confinement was also improved with moderate impurity seeding of N, Ne or Ar [27, 28]. A consistent observation on the above three tokamaks with metal walls was that the confinement improvement stemmed from the pedestal [11, 30] and that the increased pedestal height was related to an increase of pedestal top temperature and an inward shift of the pressure profile [10, 14, 27, 28].
The lithium induced ELM-free phases with enhanced confinement have been observed and widely studied on NSTX [16, 17, 22, 23, 26, 32] and DIII-D [15] tokamaks. These enhanced confinement phases are also related to the pedestal height improvement. The application of lithium leads to either recycling reduction (in NSTX) or the fostering of edge modes (in DIII-D), both effects increasing the pedestal top temperature and shifting the pressure profile inwards and consequently increasing the pedestal height [15, 23, 26, 28, 32].
Is the increase of pedestal top temperature and inward shift of the pressure profile the universal mechanism for all the impurity enhanced pedestal and confinement experiments in tokamaks? More studies are still needed to fully understand the pedestal and confinement improvements with impurity injection and applications to future generation tokamaks, like ITER and DEMO.
A dedicated experiment focusing on the effects of impurity (neon) on H-mode pedestal and confinement in DIII-D has been conducted recently. We have found that, at proper neon injection level, the pedestal pressure is considerably increased with no clear pedestal density or pressure profile shift but an increase of pedestal height. The peeling-ballooning stability analysis shows that the ballooning stability improved after neon injection, with most operating points close to the stability boundaries consistent with the peeling-ballooning theory predictions. However, the operating points in the highest enhanced pedestal phase in higher heating power discharges (6 MW relative to 3 MW) exceeded the ballooning stability boundary computed with the ELITE [33] code including only the diamagnetic stabilization effect of the main ions to achieve higher normalized pressure gradient. By modifying the diamagnetic stabilization model to include the contribution from neon, carbon as well as deuterium ions, the ballooning stability boundaries were more consistent with the experimental observations. Our analysis indicates that, rather than the effects of density or pressure profile inward shift, the increase of the ion diamagnetic stabilization due to the increase of impurities could be a possible mechanism for the pedestal improvement in the DIII-D neon injection experiment with a carbon wall. More detailed neon enhanced pedestal experiment studies will be described in the following sections.
The rest of this paper is organized as follows. In section 2, the experimental setup and some data analysis methods used in this paper are described. In section 3, effects of neon injection on the pedestal and confinement improvements are described in detail, and the experimental pedestal widths are compared to the predictions of the EPED model [7, 34] before and after neon injection. Next, a mechanism is proposed to explain the pedestal and confinement improvement after neon injection in this section. In section 4, summaries, discussions and conclusions are presented.
2. Experimental setup, profile fitting and MHD equilibrium generation
The basic scenario of the discharges discussed in this paper involves ramps of the impurity injection rate at two neutral beam injection (NBI) heating power levels (3 and 6 MW). A single null divertor configuration is used with the favorable  drift towards to the X-point as shown in figure 1. All discharge conditions have
 ,
,  ,
,  and average triangularity
  . Because the plasma facing surfaces of DIII-D are graphite, carbon is the dominant intrinsic impurity. In this experiment, neon is chosen as the external impurity which is injected from vessel top (see figure 1). Neon injection rates range from 0.15 Torr.l s−1 to 0.5 Torr.l s−1, corresponding to
  electrons s−1.

Figure 1. Typical magnetic configuration used in the neon injection experiment. Neon was puffed from vessel top. The Thomson scattering (TS) measuring points are marked as magenta dots. The charge exchange recombination (CER) measuring points are marked as red dots.
Download figure:
Standard image High-resolution imageThe electron temperature and density profiles are measured with the multi-pulse Thomson scattering system (TS) which is able to provide high spatial (∼20% of the pedestal width) and temporal (∼1–5 ms and usually < 3 ms) resolution measurements of plasma pedestal [15, 35]. The TS measuring points for this experiment are illustrated in figure 1. Pedestal characteristics are derived from a modified tanh function [36] is used to fit the electron temperature ( ), density (
 ) and pressure (
 ) data in the pedestal region at each TS pulse. This method can provide a measure of the time evolution of electron pedestal height and width as shown in figure 2. For the H-mode stability analysis, data from several TS pulses taken from the same phase of the inter-ELM period when the plasma is approximately stationary are combined to improve the statistics and obtain more accurate profiles [15]. Due to uncertainties in equilibrium mapping for the experimental data, an adjustment of the location of Thomson data relative to the separatrix is made based on UEDGE divertor modeling code [37] results which is consistent with power flow in the scrape-off layer [38, 39]. Based on the UEDGE results, the locations of the
  and
and  profiles measured by the TS system are simultaneously adjusted so that the separatrix is located one half-width out from the symmetry point of the Te profile tanh fit in normalized poloidal flux space [38, 40].
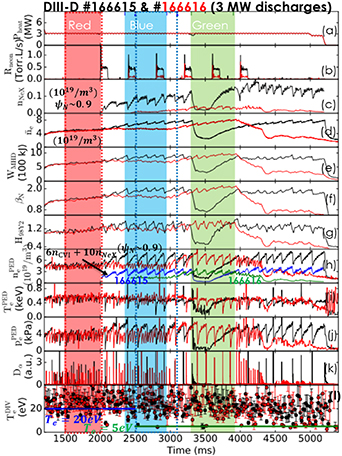
Figure 2. Time evolution of the (a) neutral beam heating power, (b) neon injection rate, (c) neon density at  , (d) line-averaged electron density, (e) plasma stored energy
  , (f) global normalized beta, (g) energy confinement enhancement factor
  , (h) pedestal electron density
  and electron contributions from neon and carbon at the pedestal top (sharing Y-axis with
  , blue line for #166615 and green line for #166616), (i) pedestal electron temperature, (j) pedestal electron pressure,(k) divertor
  signal and (l) electron temperature near the lower outer strike point for DIII-D 3 MW discharges 166615 (black) and 166616 (red). In (l), the blue and green lines are used to indicate
  and
and  respectively. The color bands show the time windows for ELM averaging in discharge 166616, and the dashed rectangles illustrate the time windows for ELM averaging in discharge 166615.
Download figure:
Standard image High-resolution imageThe charge exchange recombination (CER) spectrometers [41] are configured with alternating channels set for neon and carbon to provide ion temperature, carbon impurity density, neon density, and poloidal and toroidal rotation speeds measurements in the pedestal. The main ion density (deuterium density) is derived from charge balance. The CER measuring points for this experiment are also illustrated in figure 1. Ion profiles are aligned relative to the separatrix so that the radial electric field using radial force balance has a value of about 0 at the separatrix. The point at which the ion temperature stops dropping and begins to rise in the SOL due to ion orbits crossing the separatrix is also used to align the ion profiles [15]. Ion profiles are conditionally time averaged in the same way as the electron profiles by combining the CER data from the same phase of multiple inter-ELM periods.
A 'kinetic' MHD equilibrium reconstruction which provides more accurate equilibria for the MHD stability analysis is performed with the EFIT code [15, 40, 42, 43]. In addition to the usual equilibrium magnetic diagnostics, the experimentally measured total pressure profiles and more accurately calculated current density are used to constrain this equilibrium fit. The total pressure is the sum of the electron pressure measured by TS system, the impurity ion pressure measured by the CER system, the main ion pressure from charge neutrality, and the fast ion pressure determined by the NUBEAM [44] code. The fast ion pressure in the pedestal region is negligible but can contribute significantly to the plasma core pressure. The core current density profile is determined by the motional Stark effect (MSE) diagnostic [45]. The flux surface average toroidal current density profile in the pedestal region is obtained as the sum of the parallel bootstrap current calculated with the NEO code [46, 47], the Ohmic current density, and the neutral beam driven current, minus a small poloidal current. After an initial computation of the kinetic equilibrium, the pressure profile is adjusted to take into account the difference in mapping between physical and poloidal flux space between the kinetic equilibrium and the magnetics only equilibrium used for the profile fitting and the kinetic equilibrium is recomputed. This iteration also resolves effects of the flux geometry on the bootstrap current and poloidal current calculations.
3. Detailed study of the H-mode pedestal improvements with neon injection
3.1. Effects of neon level on the H-mode pedestal improvements
Effects of neon level on the pedestal and confinement improvements are studied at two constant heating powers (3 and 6 MW). In each heating power case, two discharges are presented showing that the neon effects on the pedestal and confinement improvements are reproducible. For these two discharges, the only difference is the neon injection rate.
Figure 2 shows the time evolution of the 3 MW discharges 166615 (black lines) and 166616 (red lines) from 1200 to 5400 ms. These time evolution parameters include the neutral beam heating power, neon injection rate, neon density at  , line-averaged density, plasma stored energy, global normalized beta, energy confinement enhancement factor
  , pedestal electron density, pedestal electron temperature, pedestal electron pressure, divertor Dα signal, which is used to monitor ELM instabilities, and electron temperature near the lower outer strike point, which is measured by the divertor Thomson scattering system [48]. The pedestal electron parameters were obtained by the method described in section 2. For the discharge 166615 with neon injection rate of 25% duty cycle at 0.5 Torr.l s−1, the plasma almost immediately responded to the neon injection, which began at 2 s. Figure 2(c) shows the build-up of neon density at
  after 2 s. It decreased due to the ELM bursts and re-built up during the inter-ELM phases. In this discharge, from 2.0 to 3.29 s, the line averaged density increased by ∼35%–45% and the plasma stored energy increased up to ∼35%, the global normalized beta increased from 1.5 to around 1.9, and the ELM frequency was significantly reduced. During the inter-ELM phase, the pedestal electron density increased by ∼60%, while the pedestal electron temperature quickly saturated to a value a little smaller than the value before neon injection. Consequently, the pedestal electron pressure had an increasing trend during the inter-ELM phase similar to the pedestal electron density. The blue and green lines in figure 2(h) show the electron contributions from neon and carbon at the pedestal top for the discharge 166615 and 166616 respectively. They can account for a lot (not all) of the increase in the pedestal electron density-about 50%. In addition, the impurity injection often decreases the ELM frequency so the pedestal density could build up higher. This physics does not require a change in source, just longer period between ELMs. During this inter-ELM phase, the
  factor also increased by up to ∼25%. After 3.29 s, the plasma dropped back to the L-mode confinement regime following an ELM for 250 milliseconds, and then went back to the high confinement regime. As for the discharge 166616 with lower neon injection rate of 25% duty cycle at 0.15TL/s, the plasma very moderately responded to the neon injection from 2 to 3 s, but when there was enough neon in the plasma after 3 s, the pedestal electron density and other parameters exhibited a similarly increasing trend to the discharge 166615 as shown in figures 2(d)–(k). Note that in these two discharges, the electron temperature near the lower outer strike point was around 10–35 eV before and after neon injection as shown in figure 2(l). This indicates that the lower outer divertor was still in the attached state [49].
Figure 3 illustrates the effects of neon injection on the profiles in the pedestal region in a typical 3 MW discharge 166616. The profiles are obtained by the method described in the section 2. The red, blue and green profiles use the data from the last 20% of the inter-ELM period in an overall time window of 500–600 ms duration near 1765 ms, 2650 ms and 3615 ms respectively. The detailed time windows for each of the time points are highlighted by the same color band in figure 2. These time windows which were chosen based on the pedestal and ELM characteristics look approximately stationary. This rule applies in all the profiles analysis in this paper.
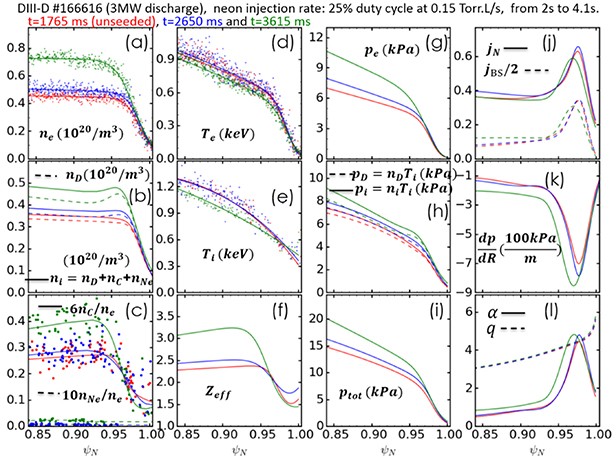
Figure 3. Experimental profiles just before an ELM in the 3 MW discharge 166616 near 3 time points 1765 ms (red), 2650 ms (blue) and 3165 ms (green): (a) electron density, (b) total ion density, which is defined as the sum of deuterium  density, carbon
  density and neon
  density,
  (solid) and deuterium density (dash), (c)
  (solid) and
  (dash) concentrations as fractional contributions to the charge balance, (d) electron temperature, (e) ion temperature, ( f ) effective charge, (g) electron pressure, (h) total ion pressure (solid) and deuterium pressure (dash), (i) total pressure, ( j) normalized current density (solid), and bootstrap current contributions to the parallel current (dash), (k) total pressure gradient with respect to midplane major radius, (l) normalized pressure gradient (solid) and safety factor (dash). The time points used the data from the last 20% of the inter-ELM phase in the time windows as shown with color bands in figure 2.
Download figure:
Standard image High-resolution imageAs described above the plasma responded to the neon injection very moderately in the first 1000 ms duration (2–3 s) after neon injection in discharge 166616, the profiles near 2650 ms (blue lines) in the pedestal region of this discharge show a moderate change in figure 3. In this period (2–3 s), compared to the profiles before neon injection (red lines), the pedestal electron and ion temperature did not show obvious changes, the pedestal electron and ion density increased by a small amount, and as a result, the pedestal electron, ion and total pressure increased by a small amount. In the later time near 3165 ms after neon injection, the pedestal profiles (green lines) showed a strong change compared to the profiles before neon injection (also see figure 2). The pedestal height of the electron density increased by a factor of ∼1.6 and its width also increased. At this time, the pedestal electron temperature decreased by a small amount. Consequently, the pedestal electron pressure increased by a factor of ∼1.5. Notably, the neon did not dilute the carbon impurity concentration which increased by a factor of ∼1.4 as shown in figure 3(c). The deuterium and total ion density also increased significantly as shown in figure 3(b). The ion temperature profile decreased by a small amount and became flatter in the pedestal region; as a result, the pedestal deuterium and total ion pressure increased. Combining all of these profiles changes, the pedestal total pressure profile became higher and wider near 3165 ms after neon injection as shown in figure 3(i).
The profiles of normalized current density  and normalized pressure gradient α in the pedestal region, which are important in determining the peeling-ballooning stability, are shown in figures 3( j ) and 3(l). The α and
  are defined as follows [15],
where R is the major radius,  is the toroidal field,
  are values at the geometric plasma centre,
  represents a flux surface average,
  is the plasma volume,
  is the pressure, and
  is the toroidal flux within a magnetic surface.
 is the current density important for PBM stability [33, 50] which includes contributions from the flux surface average parallel current
  and the Pfirsh-Schluter current,
  ,
,  is
is  at the separatrix. The normalized current density
  is the average of
  and
and  which is then normalized to the total plasma current density. The neoclassical bootstrap current in the pedestal is the dominant term in
  that is also shown in figure 3(j).
  is self-consistently calculated in a 'kinetic' equilibrium constructed with the EFIT code [42].
Based on the above information, the peeling-ballooning mode (PBM) stability analysis was performed with the ELITE code [33] for the three time points of figure 3 as shown in figure 4. The X and Y axes in figure 4 represent peak values of normalized pressure gradient, α, and normalized current density,  , in the pedestal region. The stability boundary for each time point is determined by the ratio of growth rate to diamagnetic stabilization term on the grid, and then tracing the contour for which this ratio is 1 [15]. The form of the diamagnetic stabilization term used in this paper is derived from BOUT++ calculations described in reference [7]. The experimental operating points are computed from the 'kinetic' profiles as depicted in figure 3. If the operating points of the discharges are above or to the right of the stability boundary, the discharges are predicted to be unstable. The stability boundaries are only computed in the region near the operating points and are expected to extend to regions of lower α and
  . As shown in figure 4, these three operating points, which use the data from the last 20% of the ELM cycle, are all at the instability threshold within the experimental uncertainties consistent with the peeling-ballooning theory predictions.
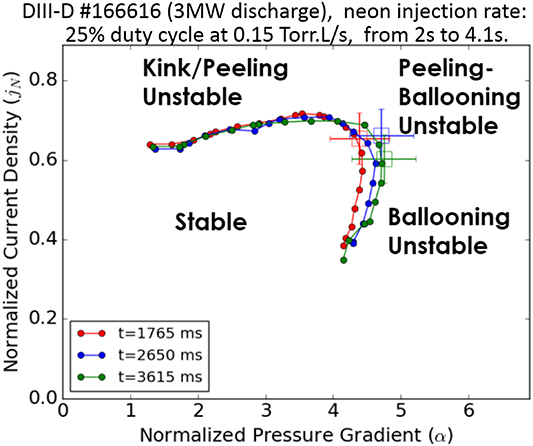
Figure 4. Comparison of the experimental data corresponding to the profiles shown in figure 3 to PBM stability thresholds (dot-lines) in a space of normalized pedestal pressure gradient and normalized pedestal current density. The threshold (dot-line) was computed with the ELITE code, and the operating space is stable below the line.
Download figure:
Standard image High-resolution imageFrom 1765 ms to 3615 ms, with increasing neon level in the plasma, the ballooning stability threshold increased by a small amount which let the plasma reach a higher α value. The normalized pressure gradient, α, profile at 3615 ms also was wider than the other two time points (see figure 3(l)). Since α is proportional to the  as shown in equation (1) (where
  is the safety factor), the shift of the peak α inward to a region of lower q results in a further significant improvement of pressure gradient in real space after neon injection as shown in figure 3(k). Note that, although the ballooning stability boundary increased after neon injection in figure 4, the peeling stability boundary was not changed after neon injection. This may be due to the relatively low neon injection level in discharge 166616. For approximately 3.3 times higher neon injection rate in discharge 166615, the peeling stability boundary was reduced after neon injection, and the ballooning stability boundary was also increased as shown in figure 5. The operating points, based on the data from the last 20% of the ELM cycle, were in the stable region. More studies on discharge 166615 will be discussed in later sections.
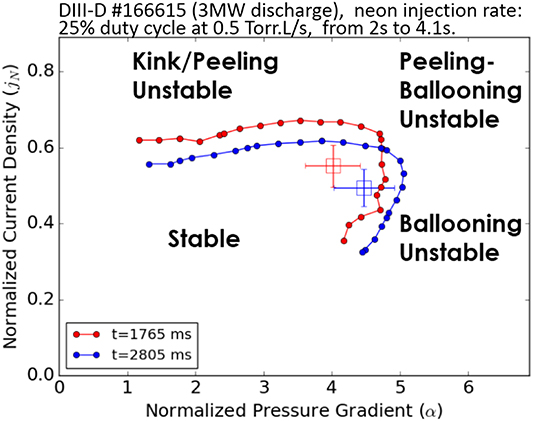
Figure 5. Comparison of the experimental data just before an ELM from the 3 MW discharge 166615 near 1765 ms (red) and 2805 ms (blue) respectively to PBM stability thresholds (dot-lines) in a space of normalized pedestal pressure gradient and normalized pedestal current density. The threshold (dot-line) was computed with the ELITE code, and the operating space is stable below the line. The two operating points use the data from the last 20% of the inter-ELM phase in a time window of 500 ms and 600 ms respectively as illustrated with dashed rectangles in figure 2.
Download figure:
Standard image High-resolution imageEffects of neon level on pedestal and confinement are also studied in the 6 MW discharges. The time evolution of the 6 MW discharges 166612 (black lines) and 166613 (red lines) from 1200–5400 ms is shown in figure 6. These waveforms represent the same parameters as described in figure 2. For the discharge 166613 with neon injection rate (50% duty cycle at 0.5 Torr.l s−1), in which the neon injection began at 2 s, but the waveform was partially overlaid by the waveform from discharge 166612 (black), the plasma parameters after neon injection gradually changed and began to show big changes around 3.8 s. Figure 6(c) shows the gradually build up of the neon density at  after 2 s. From 2 to 3.8 s, the line averaged density gradually increased up to ∼55%, the plasma stored energy increased up to ∼15% and the global normalized beta increased from 2.0 to around 2.25. The
  factor slightly increased by ∼7%. In this period, the ELM frequency gradually decreased as indicated by divertor Dα signals as shown in figure 6(k). In a general trend, the pedestal electron density gradually increased up to ∼55%, the pedestal electron temperature gradually decreased by ∼30% and pedestal electron pressure gradually increased by ∼20%. From 3.8 to 4.4 s, although the pedestal electron density increased during the ELM cycle, the pedestal electron temperature generally dropped; as a result, pedestal electron pressure only increased by a small amount. The plasma stored energy and confinement factor during this period showed a slight drop. The electron contributions from neon and carbon at the pedestal top increased from < 30% (at 2 s) to > 50% (at 4.5 s) as shown in figure 6(h). In the discharge 166612 (black) with a lower neon injection rate (25% duty cycle at 0.5 Torr.l s−1), in which the neon injection also began at 2 s, all the parameters shown in figure 6 had a similar trend compared to 166613 from 1.2 to 4.0 s. Perhaps due to the lower neon injection level in discharge 166612, the pedestal parameters response to the neon injection is more moderate than in the discharge 166613 during this period. After 4 s, the discharge 166612 lost some heating power and the plasma confinement decreased probably due to the beginning of a significant n = 2 core MHD mode at 4.1 s (not shown here). As shown in figure 6(l), in these two discharges, the electron temperature near the lower outer strike point was around 15–40 eV before neon injection. After neon injection, the electron temperature near the lower outer strike point began to show a clear decrease after 2.5 s during the inter-ELM phases as indicated by the green line with
  . But there were also many time points in which the electron temperature was still higher than 5 eV during the inter-ELM phases. The lower outer divertor was close to the detached state during the inter-ELM phases after neon injection. This has little influence on the pedestal studies in this paper.
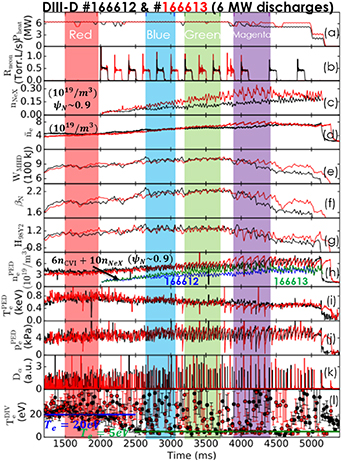
Figure 6. Time evolution of the (a) neutral beam heating power, (b) neon injection rate, (c) neon density at  , (d) line-averaged electron density, (e) plasma stored energy
  , ( f ) global normalized beta, (g) energy confinement enhancement factor
  , (h) pedestal electron density
  and electron contributions from neon and carbon at the pedestal top (sharing Y-axis with
  , blue line for 166612 and green line for #166613), (i) pedestal electron temperature, (j) pedestal electron pressure, (k) divertor
  signal and (l) electron temperature near the lower outer strike point for DIII-D 6 MW discharges 166612 (black) and 166613 (red). In (l), the blue and green lines are used to indicate
  and
and  , respectively. The color bands show the time windows for ELM averaging in the discharge 166613.
Download figure:
Standard image High-resolution imageFigure 7 illustrates the profile changes before (red lines) and after (blue, green and magenta lines) neon injection in a typical 6 MW discharge 166613. All of these four color profiles use the data from the last 20% of the inter-ELM period in an overall time window of 400–500 ms duration near 1765 ms (red lines), 2765 ms (blue lines), 3465 ms (green lines) and 4165 ms (magenta lines) respectively. And the detailed time windows for each of the time points are highlighted by the same color band in figure 6.
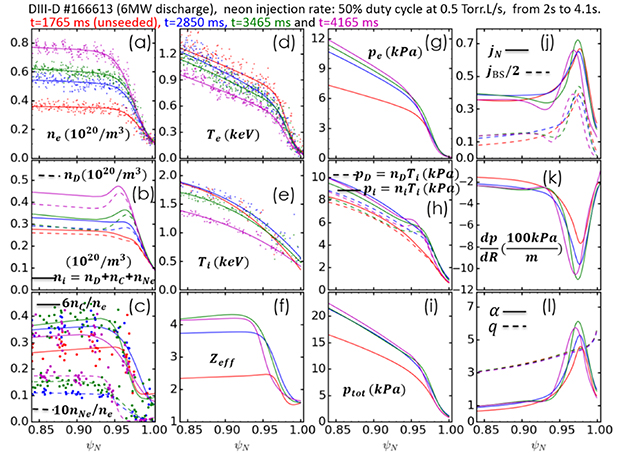
Figure 7. Experimental profiles just before an ELM from the 6 MW discharge 166613 near 4 time points 1765 ms (red), 2850 ms (blue), 3465 ms (green) and 4165 ms (magenta): (a) electron density, (b) total ion density, which is defined as the sum of deuterium ( ) density, carbon (
 ) density and neon (
 ) density,
  (solid)and deuterium density (dash), (c)
  (solid) and
  (dash) concentrations as fractional contributions to the charge balance, (d) electron temperature, (e) ion temperature, (f) effective charge, (g) electron pressure, (h) total ion pressure (solid) and deuterium pressure (dash), (i) total pressure, ( j) normalized current density (solid), and bootstrap current contributions to the parallel current (dash), (k) total pressure gradient with respect to midplane major radius, (l) normalized pressure gradient (solid) and safety factor (dash). The time points used the data from the last 20% of the inter-ELM phase in the time windows as depicted with color bands in figure 6.
Download figure:
Standard image High-resolution imageAs the gradual evolution trend of the discharge 166613 depicted in figure 6, the gradual increasing trend of profiles after neon injection are also exhibited in figure 7. After neon injection, the pedestal electron density gradually increased up to a factor of ∼2.2 near 4165 ms, the pedestal electron temperature gradually decreased by ∼30% near 4165 ms, as a result, the pedestal electron pressure followed the trend of electron density and gradually increased by a factor of ∼1.6 near 4165 ms. As shown in figure 7(c), from 1765 ms to 3465 ms, the neon injection did not dilute the carbon concentration but increased its concentration by a factor of ∼1.4 near 3465 ms. Near 4165 ms, the neon showed some dilution effect as the carbon concentration was reduced but it was still higher than the value before neon injection. The increase in carbon concentration with neon injection in these and the 3 MW cases is likely the result of the decrease in ELM frequency as ELMs are known to be effective at flushing medium Z impurities [51–54]. And as shown in figure 7(b), the total ion density and deuterium density increased with time. Following the gradual decrease of the pedestal ion temperature after the start of neon injection, a larger decrease of ∼25% was observed at 4165 ms. The ion density increase dominated resulting in the pedestal deuterium and total ion pressure increasing with neon injection as shown in figure 7(h). Combining all of these profiles changes, the pedestal total pressure increased by a factor ∼1.35 by 4165 ms.
The peeling-ballooning stability analysis was also performed with the ELITE code for the 4 time points of figure 7 as shown in figure 8. The PBM stability boundary and operating points were computed as described for the 3 MW discharge. The operating points at time 1765, 2765 and 4165 ms were either above the stability threshold or at the stability boundary within the experimental uncertainties. The operating point at 3465 ms had the biggest deviation from the PBM stability boundary and will be discussed more in section 3.4. From 1765 to 3465 ms, after neon injection, the ballooning stability boundary was extended and peeling stability boundary showed a slight decrease. This helped the plasma to reach higher pressure gradient as shown in figures 8 and 7(k). At time 4165 ms, there was more neon injected into the plasma as shown in figure 7(c). Both the peeling stability boundary and ballooning stability boundaries were reduced. The plasma reached relatively smaller normalized pressure gradient at 4165 ms than the value at 3465 ms as shown in figure 8. Compared to the ballooning stability limit before neon injection at 1765 ms, the ballooning stability limit at 4165 ms was still improved.
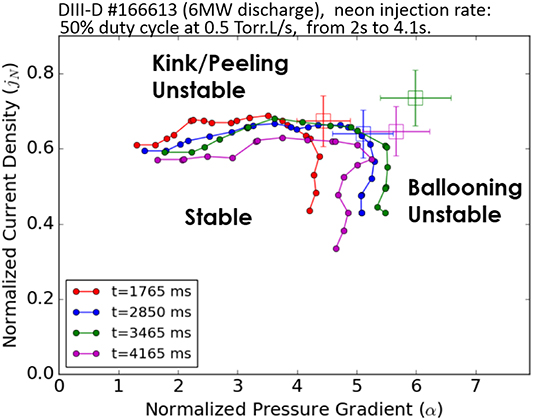
Figure 8. Comparison of the experimental data corresponding to the profiles shown in figure 7 to PBM stability thresholds (dot-lines) in a space of normalized pedestal pressure gradient and normalized pedestal current density. The threshold (dot-line) was computed with the ELITE code, and the operating space is stable below the line.
Download figure:
Standard image High-resolution image3.2. Effects of heating power on the H-mode pedestal improvements with neon injection
Two discharges with the same settings including the neon injection rate (25% duty cycle at 0.5 Torr.l s−1) from 2 to 4 s, but only different heating powers (3 MW and 6 MW) are compared in figure 9. The waveforms represent the same parameters as described in figure 2. As shown in figure 9(b), the neon was injected at 2 s. The neon density at  in both 3 and 6 MW discharges (see figure 9(c)) generally reached a similar value, but the evolution of the neon density was quite different due to the different ELM behaviors. Before neon injection, the 3 MW discharge 166615 (red lines) had higher line-averaged density but lower plasma stored energy than the 6 MW discharge 166612 (black lines). The global normalized beta of the 3 MW discharge was smaller than the 6 MW discharge. And these two discharges had similar plasma confinement factors as depicted by the
  in figure 9(g) before neon injection. Before neon injection, the 3 MW discharge had higher pedestal electron density and lower pedestal temperature than the 6 MW discharge. Consequently, these two discharges had similar pedestal electron pressure. The 3 MW discharge also had lower ELM frequency than the 6 MW discharge before neon injection as indicated by the divertor Dα signals in figure 9(k). After neon injection, the plasma in 3 MW discharge responded to the neon injection much quicker and stronger than the 6 MW discharge. In the 3 MW discharge, the plasma stored energy increased by up to ∼35% in the enhanced confinement phase, while in the 6 MW discharge, the plasma stored energy gradually increased by up to ∼20%. At this neon injection rate, the 3 MW discharge returned to L-mode between 3310 and 3360 ms as shown in figures 9(d)–(k), while the 6 MW discharge reached an approximately stationary neon enhanced confinement phase from 3400 ms to 3800 ms. As shown in figure 9(a), the 6 MW discharge later lost some heating power, the lost confinement probably mostly due to the beginning of the core MHD mode which is not shown here. As shown in figure 9(l), at the same neon injection rate, the electron temperature near the lower outer strike point did not show a very clear decrease in the 3 MW discharge and the lower outer divertor was still in the attached state. While in the 6 MW discharge, the electron temperature near the lower outer strike point showed a clear decrease after 2.5 s, the lower outer divertor was close to the detached state as also mentioned in section 3.1.

Figure 9. Time evolution of the (a) neutral beam heating power, (b) neon injection rate, (c) neon density at  , (d) line-averaged electron density, (e) plasma stored energy
  , (f) global normalized beta, (g) energy confinement enhancement factor
  , (h) pedestal electron density
  and electron contributions from neon and carbon at the pedestal top (sharing Y-axis with
  , blue line for #166612 and green line for #166615), (i) pedestal electron temperature, (j) pedestal electron pressure, (k) divertor
  signal and (l) electron temperature near the lower outer strike point for DIII-D 6 MW discharge 166612 (black lines) and 3 MW discharge 166615 (red lines). In (l), the blue and green lines are used to indicate
  and
and  respectively. The color bands show the time windows for ELM averaging in discharge 166612, and the dashed rectangles illustrate the time windows for ELM averaging in discharge 166615.
Download figure:
Standard image High-resolution imageThe profiles from these two discharges are compared before and after neon injection as shown in figures 10 and 11. Before neon injection as shown in figure 10, the profiles of the 3 MW (red) and 6 MW (blue) discharges near 1765 ms both used the data from the last 20% of the inter-ELM phase in the time window from 1500 to 2000 ms, which were highlighted with the red dashed rectangle and red color band respectively in figure 9. The 3 MW discharge 166615 had higher pedestal electron and total ion density profiles but lower pedestal electron and ion temperature profiles than the 6 MW discharge 166612. The carbon concentration and effective charge profiles in the 3 MW discharge were also higher, possibly due to the lower ELM frequency, than the profiles in the 6 MW discharge. But the 3 and 6 MW discharge had the similar electron, ion and total pressure profiles in the pedestal gradient region as shown in figures 10(g)–(i).
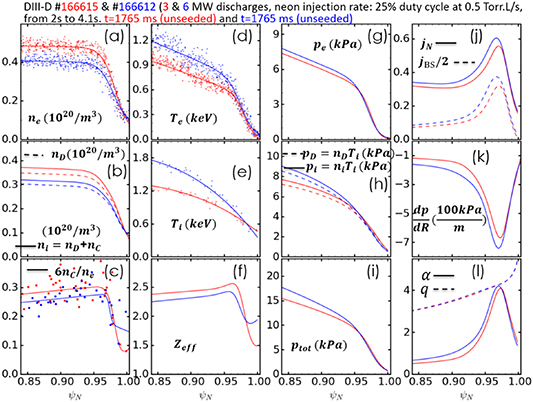
Figure 10. Experimental profiles just before an ELM near the time 1765 ms from the 3 MW discharge 166615 (red) and the 6 MW discharge 166612 (blue): (a) electron density, (b) total ion density, which is defined as the sum of deuterium ( ) and carbon (
 ) density,
  (solid) and deuterium density (dash), (c)
  concentration as fractional contributions to the charge balance, (d) electron temperature, (e) ion temperature, ( f) effective charge, (g) electron pressure, (h) total ion pressure (solid) and deuterium pressure (dash), (i) total pressure, ( j) normalized current density (solid), and bootstrap current contributions to the parallel current (dash), (k) total pressure gradient with respect to midplane major radius, (l) normalized pressure gradient (solid) and safety factor (dash). The time points used the data from the last 20% of the inter-ELM phase in a time window from 1500–2000 ms as depicted with red color band and dashed rectangles in figure 9.
Download figure:
Standard image High-resolution image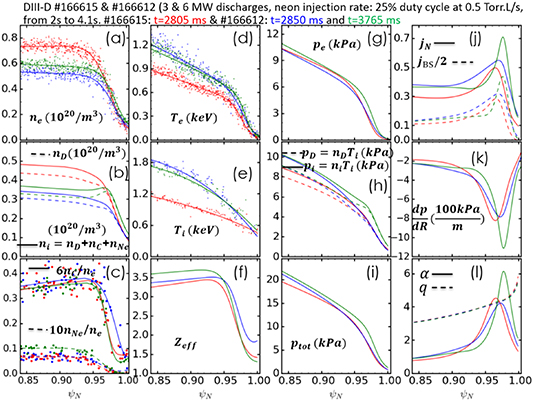
Figure 11. Experimental profiles just before an ELM from the 3 MW discharge 166615 near the time 2805 ms (red), the 6 MW discharge 166612 near the time 2850 ms (blue) and the time 3765 ms (green): (a) electron density, (b) total ion density, which is defined as the sum of deuterium ( ) density, carbon (
 ) density and neon (
 ) density,
  (solid) and deuterium density (dash), (c)
  (solid) and
  (dash) concentrations as fractional contributions to the charge balance, (d) electron temperature, (e) ion temperature, ( f) effective charge, (g) electron pressure, (h) total ion pressure (solid) and deuterium pressure (dash), (i) total pressure, ( j) normalized current density (solid), and bootstrap current contributions to the parallel current (dash), (k) total pressure gradient with respect to midplane major radius, (l) normalized pressure gradient (solid) and safety factor (dash). The time points used the data from the last 20% of the inter-ELM phase in the time windows as depicted with blue dashed rectangle, blue color band and green color band respectively in figure 9.
Download figure:
Standard image High-resolution imageAfter neon injection as shown in figure 11, the profiles (red) of the 3 MW discharge 166615 near 2805 ms used the data from the last 20% of the inter-ELM phase in the time window from 2500–3100 ms which was highlighted with the blue dashed rectangle in figure 9. For comparing the profiles at the similar neon injection level, the profiles (blue) of the 6 MW discharge 166612 near 2850 ms used the data from the similar ELM averaging (only data from the last 20% of the inter-ELM phase was used) time window to the 3 MW discharge as highlighted with blue color band in the figure 9. As depicted in figure 11, the 3 MW discharge had higher pedestal electron and total ion density profiles but lower pedestal electron and ion temperature profiles than the 6 MW discharge, which was similar to the case before neon injection. Although the carbon concentration and neon concentration profiles between the two discharges were similar (figure 11(c)), since the 3 MW discharge had much higher electron density profile (figure 11(a)), the carbon and neon densities (not shown here) of 3 MW discharge were actually higher than the 6 MW discharge. As a result, the 6 MW discharge had a little higher effective charge profile than the 3 MW discharge. And similar to the case before neon injection, the 3 and 6 MW discharges had similar pedestal ion and total pressure profiles in the pedestal gradient region. At this time, the 6 MW discharge had higher normalized current density than the 3 MW discharge which is similar to case before neon injection, but the 6 MW discharge had a little lower peak values of normalized pressure gradient than the 3 MW discharge. The location of peak normalized pressure gradient of the 6 MW discharge moved a little outward compared to the one of 3 MW discharge as shown in figure 11(l).
A later ELM averaging time window from 3500 to 4000 ms in the 6 MW discharge 166612, in which the plasma was in the final enhanced confinement phase, was chosen for the profiles (green) analysis as highlighted with green color band in figure 9. These profiles (green) from the 6 MW discharge are compared to the profiles (red) from the final enhanced confinement phase in the 3 MW discharge 166615 in figure 11. The comparison is similar to the case before neon injection and the case with similar injection level as described above: the 3 MW discharge (red) achieved higher pedestal electron and total ion density profiles but lower pedestal electron and ion temperature profiles than the 6 MW discharge (green) in the final enhanced confinement phase. The neon concentration profile from the final enhanced confinement phase in the 6 MW discharge (green) was higher than the one in the 3 MW discharge (red) as shown in figure 11(c). As illustrated in figures 11(g)–(i), the pedestal electron, ion and total pressure gradient regions in the 6 MW discharge were closer to the separatrix than the 3 MW discharge, but the pedestal pressure heights were not lower than the 3 MW discharge. As a result, the peak normalized current density and pressure gradient in the 6 MW discharge were much larger than the values in the 3 MW discharge, and their locations shifted outward to be closer to the separatrix than in the 3 MW discharge as depicted in figures 11( j) and (l).
The peeling-ballooning stability analysis was examined using the profiles from figures 10 and 11 to study the effects of heating power on the neon seeded discharges. The peeling-ballooning stability boundary and operating points were computed in the same way as described in section 3.1. As illustrated in figure 12(a), before neon injection, the operating points representing the data from the last 20% of the inter-ELM phase for both 3 and 6 MW discharges were inside and close to the PBM stability boundary which is consistent with the peeling-ballooning theory predictions. The 3 MW discharge (red) had the similar peeling stability boundary to the 6 MW discharge (blue) but broader ballooning stability boundary than the 6 MW discharge. The operating points between 3 and 6 MW discharges did not show a significant difference.
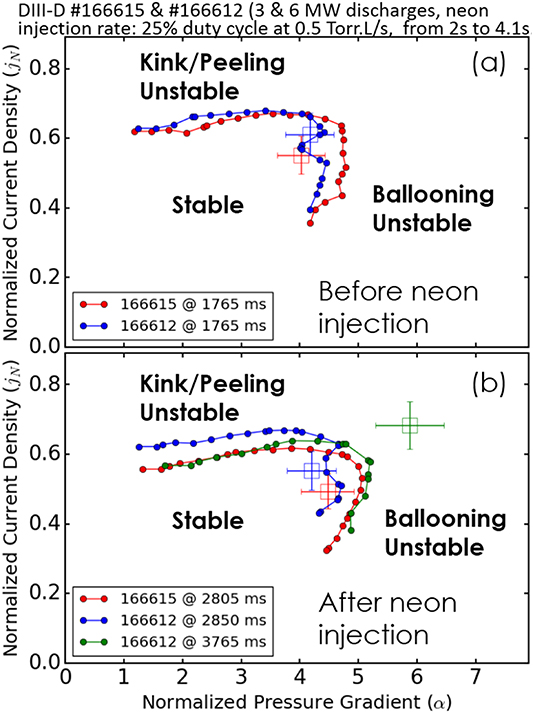
Figure 12. (a) and (b) Comparison of the experimental data corresponding to the profiles shown in figures 10 and 11 to PBM stability thresholds (dot-lines) in a space of normalized pedestal pressure gradient and normalized pedestal current density respectively. The threshold (dot-line) was computed with the ELITE code. Before (a) and after (b) neon injection, except the operating point at 3765 ms in the discharge 166612, the operating points in two discharges are mostly in the stable region, but by roughly an error bar in the measurement.
Download figure:
Standard image High-resolution imageAs illustrated in figure 12(b), after neon injection, at a similar neon injection level in the enhanced confinement phase, the 3 MW discharge (red) again had a broader ballooning stability boundary than the 6 MW discharge (blue) but lower peeling stability boundary than the 6 MW discharge. Both of the operating points were also inside and close to the PBM stability boundary. The 3 MW discharge reached slightly lower normalized current density and higher normalized pressure gradient, but the overall difference was not large. As described in the previous profile analysis, at the final enhanced confinement phase in the 6 MW discharge, the plasma achieved much larger peak values of normalized current density and normalized pressure gradient (see figures 11(j) and (l)) than the one at the final enhanced confinement phase in the 3 MW discharge which was also shown by the operating point (green) in figure 12(b). At this time, the peeling stability boundary of the 6 MW discharge (green) was lower than the one in the early neon injection time (blue) but the ballooning boundary was increased. The PBM stability boundary (green) from the final enhanced confinement phase in the 6 MW discharge was similar to the PBM stability boundary in the 3 MW discharge, but its operating point (green) was quite far outside the boundary in the unstable region. This case will be discussed more in the section 3.4.
3.3. Comparison to the EPED width scaling
The measured pedestal widths in the neon injection experiment described in this paper are compared with the predicted widths from the EPED1.0 [34, 55] model in this section. The EPED model predicts the pedestal width and height in many tokamaks, such as DIII-D [7, 34, 55–57], JET [55, 58–60], AUG [60], JT-60 U [55, 61], generally within ∼20% deviation. This model combines two hypotheses to predict the pedestal height and width. The first hypothesis is that the maximum achievable pedestal height between ELMs is limited by finite-n peeling-ballooning MHD modes [62], and the second hypothesis is that the pedestal width ( ) is constrained at all times by the nearly local kinetic ballooning modes giving the relationship
  , where
  is the poloidal beta at the pedestal top and
  is a weakly varying function of aspect ratio (
 ), collisionality (
 ), and other dimensionless parameters, with value generally in the range 0.07–0.1 for the standard aspect ratio shaped tokamaks [7, 34].
The comparison between the experimental pedestal widths and the EPED1.0 scaling,  , in the neon injection experiment described in this paper is shown in figure 13, where
  , the value derived by fitting to a set of DIII-D discharges without impurity seeding [34], is used in figures 13(a) and (b) and
  , the value obtained expected based on theory [7], is used in figures 13(c) and (d). The measured pedestal width is the average of the
  and
and  widths in normalized poloidal flux,
  . All the
  and
and  experimental widths were taken from the corresponding profiles described in section 3.1 and 3.2. The triangles and stars in figure 13 represent the 6 MW discharges 166612 and 166613 respectively, and the circles and squares represent the 3 MW discharges 166615 and 166616 respectively. The colors used in figure 13 represent the time points that were mentioned in section 3.1 and 3.2. So the color red always represents the time before neon injection, and the colors blue, green, magenta represent the time after neon injection. In figure 13, the solid lines are unity lines, and the dashed lines show deviations of
  from unity. As shown in figure 13(a), the measured pedestal widths in some discharges exceed the EPED1.0 width scaling,
  , by more than 20%. The measured pedestal widths in all the discharges before or after neon injection from the EPED1.0 width scaling,
  , are within 20% deviation as shown in figure 13(c). The data area in figures 13(a) and (c) is also zoomed in and shown in figures 13(b) and (d), respectively for a clearer view.

Figure 13. Measured pedestal width versus EPED1.0 width scaling,  using
using  (figures 13(a) and (b)) and
  (figures 13(c) and (d)). The solid lines are unity lines, and the dashed lines show deviations of
  from unity. The triangles and stars represent the 6 MW discharges 166612 and 166613, and the circles and squares represent the 3 MW discharges 166615 and 166616 respectively. The colors represent the time points that were mentioned in section 3.1 and 3.2 (also see figure 15). So the color red represents time before neon injection, and the colors blue, green, magenta represent the time after neon injection.
Download figure:
Standard image High-resolution image3.4. Explanation of the H-mode pedestal improvements
In this section, a possible explanation of the pedestal and confinement improvements in the neon injection experiment presented in this paper is proposed. As shown in section 3.1 and section 3.2, we found that not only could neon cross the separatrix and penetrate into the pedestal region but also it led to additional electron, carbon and deuterium density increase in the pedestal region, possibly related to decrease of ELM frequency. This significant increase in the pedestal density with a corresponding small reduction of the pedestal temperature helped to increase the pedestal pressure. The peeling-ballooning analysis in section 3.1 and section 3.2 showed that, in both 3 and 6 MW discharges, after neon injection, the ballooning stability boundary was generally extended to larger pressure gradient, while the peeling stability boundary only began to drop when the neon level was relatively high. The improved ballooning stability boundary allows the plasma to reach higher pressure as well as normalized pressure gradient. In combination with the core profile stiffness these pedestal effects could lead to the plasma stored energy and confinement improvement.
As mentioned in the section 3.1 and section 3.2, the operating points of discharge 166612 at time 3765 ms and discharge 166613 at time 3465 ms were computed to be in the MHD unstable zone and relatively far away from the peeling-ballooning stability boundary. These two operating points, representing the data from the last 20% of the inter-ELM period, should be close to the PBM stability boundary if the PBM is dominant in limiting pedestal height in this experiment.
In the following part of this section it will be shown that by modifying the effective diamagnetic frequency, which sets the peeling-ballooning mode growth rate threshold [7], to take into account impurity effects, the stability threshold can be brought into better agreement with the operating points. This in turn indicates that the impurity may help to improve pedestal pressure and confinement through increasing the effective ion diamagnetic frequency in the pedestal region extending ballooning stability boundary extension.
The formula for the diamagnetic frequency of different ions in CGS units is described by
where  is effective charge number, c is the speed of light in vacuum,
  is the toroidal mode number, e is the elementary charge,
  is the ion density in which its effective charge number is
  ,
,  is the ion pressure in which its effective charge number is Z,
  is the ion temperature assuming that different ions have the same ion temperature, and
  is the poloidal magnetic flux. The main ion in the experiment described in this paper is deuterium, and it is denoted by letter
  . So deuterium diamagnetic frequency in CGS units is given by
And the carbon and neon diamagnetic frequencies in CGS units are described respectively by
In the ELITE code, with the assumption that the total ion density ( ) equals the electron density (
 ), the approximate total ion diamagnetic frequency (
 ) is calculated with the equation,
All the diamagnetic frequency profiles of different ions in the pedestal region, as mentioned above, before and after neon injection in both 3 and 6 MW discharges are calculated with the experimental profiles and toroidal number n = 10 as illustrated in figure 14. Since every kind of ion diamagnetic frequency is proportional to toroidal number, the exact n number does not affect the comparison between different ion diamagnetic frequencies. The time points from each discharge used in the figure 14 are same as the time points that were used in section 3.2. The  in figure 14 is used to represent the ELITE calculated total ion diamagnetic frequency (
 ), and the
  and
and  . As shown in figure 14, for both discharges before and after neon injection, the peak values of approximate total ion diamagnetic frequency (
 ) (black curve) calculated by the ELITE code are close to the peak values of deuterium diamagnetic frequency (
 ) (green curve). The peak values of
  are smaller than the peak values of
  and this is smaller than the peak values of
  .
.
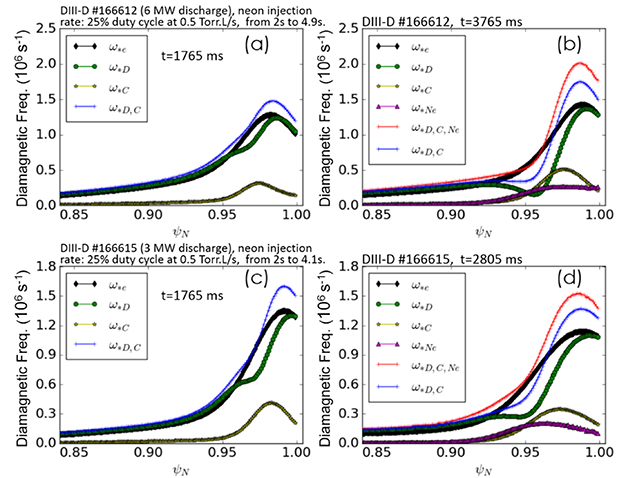
Figure 14. Different kinds of ion diamagnetic frequencies calculated with the formulas described in Sec. 3.4 before and after neon injection for the 6 MW discharge 166612 ((a) and (b)) and the 3 MW discharge 166615 ((c) and (d)), where the toroidal mode number n has been set to 10. The  represents the ELITE calculated total ion diamagnetic frequency assuming ion density equals to the electron density (
 ). The
  ,
,  and
and  represent the ion diamagnetic frequency of deuterium, carbon and neon ion respectively. The
  represents the approximate ion diamagnetic frequency contributed from deuterium and carbon ion (
 ). The
  represents the approximate ion diamagnetic frequency contributed from deuterium, carbon and neon ion (
 ).
).
Download figure:
Standard image High-resolution imageIn the following analysis, we use  and
and  as the approximate experimental total ion diamagnetic frequency before and after neon injection respectively. And its peak value in the pedestal region is denoted by
  . The peak value of ELITE calculated total ion diamagnetic frequency (
 ) is denoted by
  . The detailed comparison between
  and
and  at all the time points in the discharges studied in section 3.1 and section 3.2 are provided in figure 15. The symbols except the '
 ' representing the discharges and the colors representing the time points have the same meaning as used in figure 13.

Figure 15. Time evolution of peak values of experimental approximate total ion diamagnetic frequency including the additional contribution from carbon and neon ion in the pedestal ( , filled symbols) and ELITE calculated total ion diamagnetic frequency in the pedestal (
 , open symbols) and the ratio between them (
 ) from the 6 MW discharges 166612 (a) and 166613(b) and the 3 MW discharges 166615 (c) and 166616 (d), where the toroidal mode number n has been set to 10. The '
 ' symbol represents the ratio (
 ), and the other symbols represent the discharges with the same meaning used in figure 13. The colors of the symbols indicate the different time in the discharges which are same to figure 13
Download figure:
Standard image High-resolution imageAs shown in figure 15, the  (filled symbols) and
  (open symbols) have the same evolution trend. For both 6 MW (figures 15(a) and (b)) and 3 MW (figure 15(d)) discharges, after neon injection, the peak values of total ion diamagnetic frequency were generally increased. When the neon level is relatively high enough, the peak values dropped as illustrated in figures 15(b) and (d). Note that in figure 15(a), the 6 MW discharge 166612 did not drop its peak values of total ion diamagnetic frequency, probably due to its relatively low neon injection rate (compared to the 6 MW discharge 166613) and high heating power (compared to the 3 MW discharge 166615). In contrast, in figure 15(c), the peak value of total ion diamagnetic frequency directly dropped after neon injection, probably due to the relatively high neon injection rate (which is the same as the value in the 6 MW discharge 166612 and larger than the value in the 3 MW discharge 166616) and its low heating power.
As depicted in figure 15,  (filled symbols) is larger than
  (open symbols) in both 3 and 6 MW discharges before and after neon injection. And the ratio of
  to
to  is in the range from 1.1 to 1.4 (see the '
 ' symbols). Interestingly, the ratios of
  to
to  were larger with neon than without neon for both 3 and 6 MW discharges (see dash
  lines). In figure 15(b), the ratios of
  to
to  began to drop after 2850 ms (in the discharge with highest neon injection rate), but they were still higher than the ratio before neon injection. Since the PBM growth rate threshold is determined by a model of diamagnetic stabilization [7], a larger value of
  , comparing to the
  , suggests that the ELITE computed peeling-ballooning stability boundary might be improved in the discharges both before and after neon injection by using the approximate experimental total ion diamagnetic frequency (
 and
and  , respectively) instead of the approximate total ion diamagnetic frequency in ELITE (
 ). For qualitative studies, we approximate this effect by adjusting the critical value of the toroidal mode number (
 ) [7] to give the corresponding ratio of
  to
to  . The
. The  is the toroidal mode number of the transition point in the bilinear fit to the BOUT + + evaluated effective diamagnetic stabilization coefficient [7], which does not include the impurity effects and is used for determining the PBM growth rate threshold in section 3.1 and 3.2 in our paper. For convinence, we use a schematic diagram to demonstrate the effects of modifying
  on the effective diamagnetic frequency calculation as shown in figure 16. Increasing
  gives stronger stabilization for modes with toroidal mode numbers larger than the original
  (see figure 16).

Figure 16. Schematic representation of the bilinear model fit to the BOUT++ evaluated effective diamagnetic frequency for a range of toroidal mode numbers n. The black arrow indicates the toroidal mode number ( ) of the transition point in the original bilinear model fit (black line). Increasing the
  , as indicated by the red arrow and dot-dashed line, gives stronger stablization for modes with toroidal mode numbers larger than the orignal
  .
.
Download figure:
Standard image High-resolution imageNext, we examine the effect of including the contributions of impurities, i.e. carbon and neon to the total diamagnetic frequency on the PBM stability boundary for the 6 and 3 MW discharges respectively. For the 6 MW discharges, using the total diamagnetic frequency (including the contributions of impurities) to compute the instability threshold (see figures 17(c) and (d)) resulted in an increase in the ballooning branch instability threshold and little change in the kink-peeling threshold compared to the usual ELITE treatment (see figures 17(a) and (b)). Also the ballooning stability boundary after neon injection increased more than the one before neon injection. After the PBM stability boundary modification, the stability boundaries, especially at time 3765 ms in the discharge 166612 and at 3465 ms and 4165 ms in the discharge 166613, were closer to the experimental operating points.
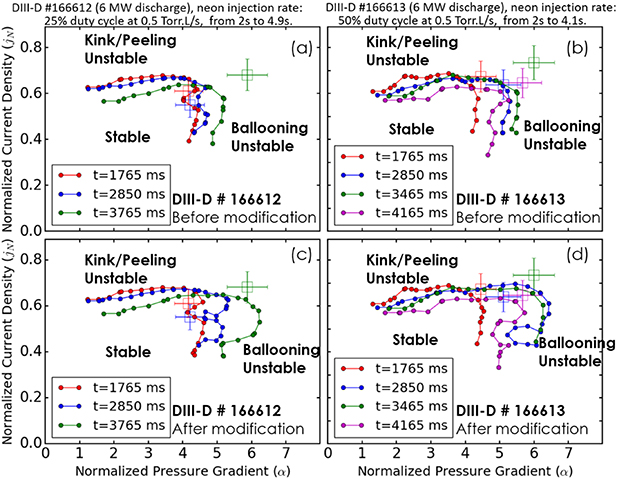
Figure 17. Comparison of the experimental data corresponding to the profiles of 6 MW discharges shown in figures 7, 10 and 11 to PBM stability thresholds (dot-lines) without or with modifying ion diamagnetic stabilization model. (a) and (b) The threshold (dot-line) was computed with the ELITE code without modifying ion diamagnetic stabilization model. (c) and (d) The threshold (dot-line) was computed with the ELITE code, but based on quantitatively modified total ion diamagnetic frequency which includes the additional contribution from carbon and neon ion in the pedestal.
Download figure:
Standard image High-resolution imageFor the 3 MW discharges in figure 18, the instability threshold computed with the total diamagnetic frequency (including the contributions of impurities) affected the PBM stability boundary in the similar way to the 6 MW discharges. After the modification, the operating points in discharge 166616 with lower neon injection rate (compared to the discharge 166615) were still close to the stability boundary (see figures 18(b) and (d)). However, for the discharge 166615 with higher neon injection rate (compared to the discharge 166616), the operating points were inside the stability boundary and away from the ballooning stability boundary (see figures 18(a) and (c)). Since the data of operating points in the discharge 166615 were from the last 20% of the inter-ELM period, the operating point locations of discharge 166615 might be still reasonable.

Figure 18. Comparison of the experimental data corresponding to the profiles of 3 MW discharges shown in figures 3, 10 and 11 to PBM stability thresholds (dot-lines) without or with modifying ion diamagnetic stabilization model. (a) and (b) The threshold (dot-line) was computed with the ELITE code without modifying ion diamagnetic stabilization model. (c) and (d) The threshold (dot-line) was computed with the ELITE code, but based on quantitatively modified total ion diamagnetic frequency which includes the additional contribution from carbon and neon ion in the pedestal.
Download figure:
Standard image High-resolution image
Further theoretical work and simulation with BOUT++ [63] or other codes are needed to justify using the total diamagnetic frequency (including the contributions of impurities) to compute the stability threshold. However, this modification quantitatively makes the PBM stability boundary more consistent with the experimental observations, especially for the 6 MW discharges. This also implies the possible role of impurities in enhancing the pedestal pressure and global confinement as described above.
4. Summary, discussion and conclusion
In summary, the effects of neon level on H-mode pedestal at two NBI heating powers (3 and 6 MW) in DIII-D lower-single-null discharges are studied. We found that the pedestal pressure and global energy confinement (e.g. plasma stored energy and  factor) could be improved at two different heating powers with neon injection.
In this experiment, the neon injection rate for different discharges was set in the range from 25% duty cycle at 0.15 Torr.l s−1 to 50% duty cycle at 0.5 Torr.l s−1. For both 3 and 6 MW discharges, after neon injection, the plasma stored energy and confinement increased, and the ELM frequency dropped. Detailed profile analysis just before the ELM showed that in the neon enhanced confinement phases, the pedestal electron and total ion density profiles largely increased, the pedestal electron and ion temperature only decreased by a small amount; as a result, the pedestal electron, ion and total pressure as well as the total pressure gradient increased.
The discharges with the same neon injection rate (25% duty cycle at 0.5 Torr.l s−1) but only different NBI heating powers (3 and 6 MW) were compared. After neon injection, the ELM frequency rapidly decreased in the 3 MW discharge, while the ELM frequency just gradually decreased in the 6 MW discharge. Similar to the trend of ELM frequency change, in the 3 MW discharge, the plasma stored energy quickly increased by ∼35%, while in the 6 MW discharge, the plasma stored energy gradually increased by up to 20%. Detailed profile analysis just before the ELM showed that at the time before neon injection and in the neon enhanced confinement phases when both discharges had similar total neon level, the 3 and 6 MW discharges had similar pedestal ion and total pressure profiles in the pedestal gradient region. But the 6 MW discharge could contain more neon impurity than the 3 MW discharge before triggering a transition to L-mode. As a result, the 6 MW discharge could achieve higher and narrower normalized pedestal pressure gradient and current density profiles.
Detailed pedestal width studies in the neon injection experiment described in this paper showed that the experimental measured pedestal widths (average of the  and
and  widths in normalized poloidal flux) in some discharges exceed the EPED1.0 width scaling,
  , by more than 20%. However, the measured pedestal widths in all discharges before or after neon injection matched the EPED1.0 width scaling,
  , within 20% deviations. Here, the coefficient 0.076 was the original value derived by fitting to a set of DIII-D discharges without impurity seeding [34], and the new coefficient 0.089 was obtained from the theory [7].
The PBM stability analysis showed that in both 3 and 6 MW discharges after neon injection, the ballooning stability boundary was generally extended to higher normalized pressure gradient while the peeling stability boundary was relatively constant, except for some decrease when the neon level was relatively high. This increase of ballooning stability may allow plasmas operating at the ballooning stability boundary to reach higher pressure as well as normalized pressure gradient. With an assumption of core profile stiffness these effects could lead to the plasma stored energy and confinement improvement. Furthermore, quantitative studies showed that, by modifying the ion diamagnetic stabilization model, i.e. including the contribution of carbon, neon as well as deuterium ions, the new ELITE computed ballooning stability improved, while the new computed peeling stability remained relatively fixed in both 3 and 6 MW discharges before and after neon injection. Also the computed improvement in ballooning stability after neon injection was larger than before neon injection. With this modification, the new computed PBM stability boundaries were more consistent with the experimental observations, especially for the 6 MW discharges. This in turn indicated that the impurity might help to improve pedestal pressure through increasing ion diamagnetic frequency in the pedestal region leading to improved ballooning stability.
In the neon enhanced confinement phases in our experiment, there was not a clear shift of the electron density or pressure pedestal profile inwards to the plasma core, which has been observed in the nitrogen enhanced confinement experiment in AUG tokamak [10] and the lithium enhanced confinement experiment in DIII-D tokamak [15]. Also in these other experiments, the pedestal top temperature is increased after impurities injection. However, a slight decrease of pedestal top temperature after neon injection was observed in the neon enhanced confinement experiment described in this paper. In our experiment the clearest effect of neon injection is the significant increase in the pedestal electron and total ion density height. The pedestal deuterium density also increased after neon injection. Moreover, the neon injection did not dilute the carbon concentration; in fact, the pedestal carbon concentration increased after neon injection, which was possibly related to a decrease in ELM frequency. This phenomenon is different from the observations in the DIII-D lithium enhanced confinement experiment, in which the carbon concentration is diluted after lithium injection [15]. The peak position of the normalized pressure gradient was affected by the heating power (edge temperature) and the neon level in our neon injection experiment. In the 3 MW discharges after neon injection, the peak position of the normalized pressure gradient generally moved inward to the region of lower q (see figure 3(l)). In the 6 MW discharge with higher neon injection rate, the peak position of the normalized pressure gradient also moved inward as in the 3 MW discharges (see figure 7(l)). But in the 6 MW discharge with lower neon injection rate, the peak position of the normalized pressure gradient moved outward towards the separatrix (see figure 11(l)). Note that the pedestal pressure and confinement can be improved in both shift directions as shown in section 3.1 and section 3.2.
In JET with the carbon wall, nitrogen and neon seeding did not improve the pedestal confinement [21, 64], which is different from the observation in our experiment on DIII-D. These impurity seeding experiments in both JET [21, 64] and DIII-D were conducted with a high triangularity type I ELMy H-mode regime. But before impurity injection, the Greenwald density fraction [65]  in JET was much higher than DIII-D with
  . After neon injection in our experiment on DIII-D, the Greenwald density fraction increased from
  to
to  , which was still lower than in JET. Differently, impurity seeding in combination with deuterium fuelling were applied together to reduce the power load in JET. As a result, the pedestal electron density, pedestal electron temperature as well as the plasma confinement were decreased after impurity injection in JET. There are also several other differences in these experiments between JET and DIII-D, such as the impurity seeding locations, divertor states, heating powers, etc More careful work needs to be done to understand this different change in the confinement after impurity injection in JET and DIII-D.
As described in the references [10–12, 14, 21, 30], when AUG and JET changed their carbon walls into the metal walls, the confinement loss was partially compensated by the impurity seeding. The PBM stability analysis also showed that the ballooning stability boundary was increased after impurity seeding in those experiments. An inward movement of the pedestal electron density gradient relative to the pedestal electron temperature gradient has been identified as a reason for the improved PBM stability [66]. The impurity seeding might change the particle distributions and heat transport in the SOL and pedestal regions, which could change the pedestal profiles and the relative shift between them, as well as the total ion diamagnetic frequency profile. And the pedestal stability might be improved due to the total ion diamagnetic frequency profile change in the pedestal region. Although the total ion diamagnetic frequency change after impurity injection, as studied in this paper, might not help to fully explain the impurity induced pedestal improvements in AUG and JET with the metal walls, it provides a new point to study this topic, which might be worth to test.
The pedestal and confinement improvements with the noble gas (neon) injection observed in our experiment and its interpretations might contribute to a better understanding of the pedestal and confinement improvements with impurity injection and applications to future fusion devices. There is still much interesting research to be done in the future. This includes investigating the fluctuations in the core and edge plasma during the inter-ELM phases to study the relationship between plasma fluctuation and the dynamics of pedestal evolution and plasma confinement improvement after neon injection. And the effects of neon on the particle, energy and momentum transport in the edge and core plasma need to be studied. More theoretical work and simulation with BOUT++ or other codes to explain the ballooning boundary extension and confinement improvement with impurity injection for DIII-D and other tokamaks would allow better tests of the theory for the MHD ballooning limit.
Acknowledgments
One of the authors (HL) gratefully acknowledges the support and help from the DIII-D team. This material is based upon work supported by the U.S. Department of Energy, Office of Science, Office of Fusion Energy Sciences, using the DIII-D National Fusion Facility, a DOE Office of Science user facility, under Awards DE-FC02-04ER54698, DE-AC02-09CH11466 for PPPL, DE-AC52-07NA27344 for LLNL and National Magnetic Confinement Fusion Science Program of China under Contract No. 2015GB101002 and No. 2015GB103000, and National Natural Science Foundation of China under Contracts No. 11575235 and No. 11422546, Key Research Program of Frontier Sciences, CAS, Grant No. QYZDB-SSWSLH001, and is performed while visiting General Atomics under the support of China Scholarship Council. Disclaimer: This report was prepared as an account of work sponsored by an agency of the United States Government. Neither the United States Government nor any agency thereof, nor any of their employees, makes any warranty, express or implied, or assumes any legal liability or responsibility for the accuracy, completeness, or usefulness of any information, apparatus, product, or process disclosed, or represents that its use would not infringe privately owned rights. Reference herein to any specific commercial product, process, or service by trade name, trademark, manufacturer, or otherwise does not necessarily constitute or imply its endorsement, recommendation, or favoring by the United States Government or any agency thereof. The views and opinions of authors expressed herein do not necessarily state or reflect those of the United States Government or any agency thereof.