


Abstract
The development of small edge localized mode (ELM) scenarios is important in order to reduce the strain on plasma facing components. One such scenario can be found at high densities, in highly shaped, close to double-null plasmas in ASDEX Upgrade, showing small ELMs characterized by a frequency  Hz and a low power loss. Changing from gas fuelling to pellet fuelling results in edge profiles in which the collisionality of pedestal top and separatrix are decoupled. While the pedestal top values remain unchanged, only the phases with low separatrix and scrape-off layer (SOL) density show large ELMs with small ELMs in between. In phases with high separatrix density the small ELMs increase in amplitude and large ELMs do not occur. Similarly, a change in vertical plasma position by only ∼2 cm downwards, at constant
  reduces the size of small ELMs while the large ELMs appear more intense. A possible explanation of this behaviour could be the influence of the drive and the stabilization of modes positioned close to the separatrix. When these small ELM modes cause enough transport, they flatten the gradient region around the separatrix and thereby consequently narrow the effective pedestal width. Because a narrower pedestal is more stable against global PB modes, the stability boundary is shifted towards higher pressure gradients and type-I ELMs do not occur. It is shown that a higher
  increases the amplitude of small ELMs and, in agreement with basic ballooning mode theory, a higher local magnetic shear reduces their amplitude.
Export citation and abstract BibTeX RIS
1. Introduction
As the foreseen operation scenario for future fusion devices is the high confinement mode (H-mode), the study of edge localized modes (ELMs), which are driven by steep edge gradients, is of great interest to the fusion community. Large type-I ELMs will not be tolerable in future large devices, because they will cause damage to the plasma facing components [1]. Ideas for reactor relevant scenarios lead from mitigating or suppressing, to replacing type-I ELMs with smaller, more tolerable ELMs. ELM mitigation or suppression via external magnetic perturbation concentrates on plasma scenarios with a low pedestal top collisionality, as expected for large machines [2]. It has been shown that for those mitigated ELMs, the extrapolated ELM energy fluences compared to material limits in ITER could still be of concern [3, 4]. In present day devices it is not possible to obtain pedestals with low pedestal top collisionalities and at the same time reactor relevant exhaust scenarios which necessarily come with high separatrix densities [5]. Therefore, there are two lines of research towards mitigated or small ELMs, one at low density and low pedestal top collisionality, and one at high separatrix density which necessarily is concomitant with high pedestal top collisionality in medium sized tokamaks. Many studies of various small ELM scenarios have been performed on several tokamaks (on ASDEX Upgrade (AUG) [6], on JET [7, 8] and as grassy ELMs on JT60-U [9]) which led to a large variety of different ELM types. Reviews can be found in [10, 11]. More recently the collisionality dependence of different small ELMs has been examined [12–14]. Possible theoretical explanations in the frame of peeling–ballooning (PB) theory from AUG and JET [15, 16] suggest that, small ELMs at high density and shaping (type-II ELMs) occur because of lower bootstrap current JBS (global PB theory). Newer sources suggest a local mode mechanism to describe small ELMs theoretically [17, 18]. It is not totally clear if small ELMs are global instabilities, i.e. affecting the whole pedestal, or if they are very narrow instabilities which become unstable close to the separatrix. Experiments to decouple pedestal top and separatrix parameters were already proposed and performed at AUG [19]. This work expands on these experiments and presents detailed analysis.
2. Experiments and simulations
In the following we describe experiments in which we observe a transition from a plasma with mainly small ELMs to the reappearance of type-I ELMs, keeping the pedestal top electron density and temperature as similar as possible. Also the overall shape of the plasma as well as the heating power were controlled to be constant.
At ASDEX Upgrade the standard recipe to achieve a plasma with small ELMs at high density consists of a start-up with a high deuterium gas puff followed by an upwards shift of the plasma close to a double-null shape. Figure 1 shows the magnetic equilibrium of such a shape close to double null with radial distance of the separatrix and the separatrix of the upper x point of  mm. Also indicated are the profile diagnostics used in this work, namely the core and the edge Thomson scattering (TS) system [20], for electron density (ne) and electron temperature (Te) profiles (orange), as well as the CXRS (charge exchange recombination spectroscopy) system [21, 22] for ion temperature (Ti) profiles (green). Additionally the outer divertor tiles, where the divertor current is measured via shunt resistors, is shown in red. It is composed of thermocurrents, Pfirsch–Schlüter- and ohmic currents [23] and is therefore used as ELM monitor. Starting from the plasma configuration in figure 1, experiments were carried out in which the separatrix density was changed independently of the pedestal top density (section 2.1) and a small change in vertical plasma position led to the reappearance of strong type-I ELMs, although the pedestal profiles stayed the same (section 2.2).

Figure 1. Close to double null equilibrium of a discharge during a small ELM phase and utilized diagnostics.
Download figure:
Standard image High-resolution image2.1. Importance of the separatrix density
The plasma density in tokamaks is usually controlled via gas puffing. Since this dominant particle source is outside the confined plasma, the separatrix density and the plasma density are closely linked [24, 25]. This link can be broken if the plasma is fuelled with pellets, which deposits particles further inside the confined plasma region [26]. In figure 2 the time traces of a discharge is shown in which the plasma follows the already mentioned recipe to achieve small ELMs, namely high shaping and high gas puff, with a configuration very close to double null (figure 1). After 3.0 s the stored energy stays constant around 800 kJ (figure 2(a)). At constant heating power the radiated power PRAD (figure 2(b), purple) stays constant until 5.7 s, after which the reduced ELM frequency leads to tungsten accumulation and thus an increase in PRAD with a concomitant loss of core density. As ELM monitor we show the divertor current (figure 2(c)). While during the small ELM phase between 3.0 s and 4.0 s the plasma is fuelled only by a high gas puff (figure 2(d), dark blue), the phase between 4.0 s and 5.0 s is fuelled with pellets and a reduced gas puff and finally the phase from 5.0 s to 5.8 s has no gas puff and is fuelled with pellets only. The pellet flux achieved from 4.0 s to 5.8 s was  mol s−1 (figure 2(d), light blue, multiplied by a factor of 2 for better visibility). The pellet frequency was chosen to achieve the same core density, therefore in all phases the core and pedestal densities do not change significantly. The ELM characteristics, however, are distinctly different. While in the gas fuelled phase only small ELMs are visible, large ELMs appear again as soon as the gas puff is reduced.

Figure 2. Time traces of (a) stored energy (WMHD), (b) heating power of neutral beams (PNBI) and wave heating (PICRF) as well as radiated power (PRAD), (c) outer divertor shunt current as ELM indicator and (d) core (orange) and pedestal electron density (green) measured by the Thomson scattering diagnostic, Deuterium gas puff (dark blue) and pellet flux (light blue) multiplied by 2 for better visibility.
Download figure:
Standard image High-resolution imageIn figure 3, a comparison of edge (a) electron density, (b) electron temperature, (c) electron pressure and (d) ion temperature is shown for these 3 phases, which are called 'gas' (red), 'gas+pellets' (blue) and 'pellets' (black) and the corresponding time windows are indicated in figure 2 by colored bars. The Thomson scattering data points of electron density and temperature are radially binned to reduce statistical noise. Namely, a radial running average of density and temperature was taken for all points in the specified 200 ms time windows. Every point represents the median of 6 neighbouring points. Additionally, profile fits using the modified tanh (mtanh) method described in [27] are shown in figure 3. To increase visibility, experimental error bars have only been plotted for the 'gas' case. For all profiles inside the separatrix, which is indicated by a solid black line, the data are very similar and stay within their scatter width. The only significant difference can be observed in the electron density around the separatrix and in the scrape-off layer. The gas fuelled case shows a distinct shoulder in the scrape-off layer which is decreasing (from red to black) as we reduced the gas puff and switched the fuelling mechanism.

Figure 3. Edge profiles of (a) electron density, (b) electron temperature, (c) electron pressure and (d) ion temperature for the three different phases indicated in figure 2, in which fuelling changes from pure gas puff ('gas') to a mixture of gas puff and pellets ('gas+pellets') to pure pellet fuelling ('pellets'). The height of the density 'shoulder' changes significantly in the plasma edge.
Download figure:
Standard image High-resolution imageThe electron and ion temperature profiles do not change significantly in the different phases. The ion temperature profile at the separatrix is approximately 2.5 times higher than the electron temperature. This has also been seen in different high density experiments at AUG [28, 29]
More evidence of the difference in the density profiles at the separatrix can be found when computing the fall-off lengths  and
and  , see table 1, using the method described in [30], taking Thomson scattering data in the near SOL. Comparing the 3 phases, the density fall-off length is reduced by more than a factor of 2, while the fall-off length of the pressure profile only changes by around
  .
.
Table 1. Fall-off lengths of electron density and electron pressure at the separatrix.
| Time (s) | Dominant ELM type |  (mm) (mm) |
 (mm) (mm) |
|---|---|---|---|
| 3.5 | Small | 45 | 12 |
| 4.5 | Mixed | 35 | 11 |
| 5.5 | Large | 20 | 9 |
Figures 4(a)–(c) shows the outer divertor current together with the stored energy (figures 4(d)–(f)) for the three different phases indicating the respective ELM behaviour. Keeping the color code, figure 4(a) shows the purely gas fuelled phase in red. Some larger events with divertor current amplitudes in the range of 10–20 kA are visible with losses in WMHD of <6%, but in between the small high frequency ELMs exhibit an amplitude of ∼5 kA (indicated by two black lines in figure 4(a)) of the divertor current. Type-I ELMs become larger as the gas puff is reduced (figure 4(b)) or completely switched off (figure 4(c)) with losses in WMHD reaching up to 10% and at the same time the fluctuations between type-I ELMs decrease in amplitude to ∼2 kA. No strict correlation between the pellet injection time, indicated in light blue, and the appearance of a large type-I ELM can be seen in this discharge. Some ELMs could be directly triggered by a pellet, others are clearly not triggered. This is in agreement with previous findings [31] that at high collisionalities a so-called lag time is observed, i.e. a time after an ELM in which a pellet is not able to trigger an ELM.
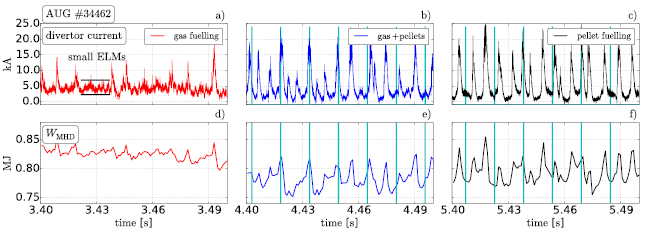
Figure 4. Divertor current (a)–(c) and stored energy WMHD (d)–(f) of the three different time windows defined in figure 2, comparing gas (red), gas+pellet (blue) and pellet only (black), fuelling. The pellet arrival in (b), (c), (e) and (f) is indicated by light blue lines.
Download figure:
Standard image High-resolution imageSummarizing, clearly different ELM behaviour is observed for these three cases with different particle fuelling scenarios, in which the plasma shape is kept constant and the pedestal profiles are very similar with the exception of the density around the separatrix and in the scrape-off layer. A high separatrix density leads to strong fluctuations or small ELMs in between some low amplitude large ELMs, whereas the reduction of the separatrix density increases the large ELM amplitude and the small ELM fluctuations decrease in size.
Besides the discharge shown in detail in this section, several experiments comparing pellet and gas fuelling were done at ASDEX Upgrade. The pellet velocity and size was varied while trying to keep a constant pedestal top density, matching the rate of the gas fuelling. The measured data suggests neither a dependence on the pellet size nor the pellet velocity on the ELM behaviour. This non-dependence on pellet parameters was also found for the lag-time mentioned above [31].
2.2. Influence of the plasma shape
The small ELM start-up procedure suggests that closeness to double null is crucial for small ELMs to occur. To further examine this dependence, a second set of experiments was conducted with a constant gas puff, shifting the plasma slowly downwards, away from the double-null configuration.
Figure 5 shows time traces of a discharge exhibiting this downward shift where, following the same procedure as described above, a small ELM phase is achieved with a high gas puff and an upwards shift of the plasma to create a close to double null shape at 3.0 s. WMHD stays constant at 0.8 MJ (figure 5(a), blue) while the ITER confinement time scaling factor  is around 1.1 (figure 5(a), orange). The NBI and ICRF heating power (figure 5(b), red and green) was kept constant (neutral beam sources dropped for short periods with no lasting impact on the plasma parameters 2.2 s and 5.0 s). The outer divertor current shows the ELM behaviour in figure 5(c). The gas puffing rate (figure 5(d) in dark blue) is not changed after 3.0 s and also the plasma density stays constant. The purple time trace in figure 5(d) shows the vertical
  position of the magnetic axis being shifted downwards from 4.0 s onward. This changes the ELM characteristics with a gradual reappearance of larger ELMs.

Figure 5. Time traces of (a) stored energy (WMHD) and H-factor ( ), (b) heating power of neutral beams (PNBI) and wave heating (PICRF) as well as radiated power (PRAD), (c) outer divertor shunt current as ELM indicator and (d) core (green) and pedestal electron density (orange) measured by the Thomson scattering diagnostic, Deuterium gas puff (dark blue) and the z position of the magnetic axis shifted by ∼1.5 cm (purple).
Download figure:
Standard image High-resolution imageFigure 6 shows the plasma shapes of the two time windows indicated in figure 5. As the magnetic axis is shifted downwards by 1.5 cm the top of the plasma changes significantly while the lower x-point remains in the same position. This shift is also apparent in the plasma elongation, which is reduced by 1.5 cm, from  m to
m to  m. The aim of the downward shift was to reduce the plasma shape's closeness to a double null configuration. This can best be seen in the difference of the two separatrices
  going from 12 mm to 17 mm, representing a shift of the second separatrix from
  to
to  . The downward shift also influences the triangularity. While the upper triangularity is reduced by
  10% from
  to 0.285 the lower triangularity stays constant within the margin of error (increases ∼1% from
  to 0.428). In figure 7 the divertor current ((a, b)) and WMHD signals ((c, d)) are shown for the small ELM case (z = 7.0 cm in orange) and the mixed case (z = 5.5 cm in green). In the case with the higher position (orange) the fluctuations or small ELMs dominate the transport in between some irregular large ELMs. Larger type-I ELMs reappear at the lower plasma position (green). The small ELM amplitude also decreases from ∼5.0 kA to ∼3.0 kA while the large ELMs grow from ∼10.0 kA to ∼20.0 kA.
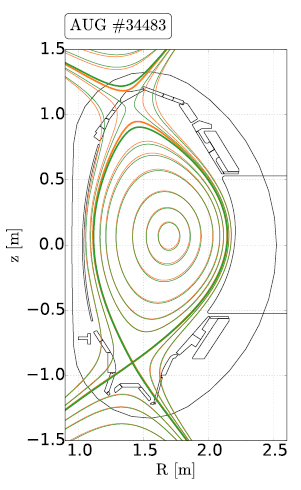
Figure 6. Equilibria of the two time windows defined in figure 5 comparing the different positions of the magnetic axis. The biggest difference can be seen near the plasma top, while the lower x-point stays the same.
Download figure:
Standard image High-resolution image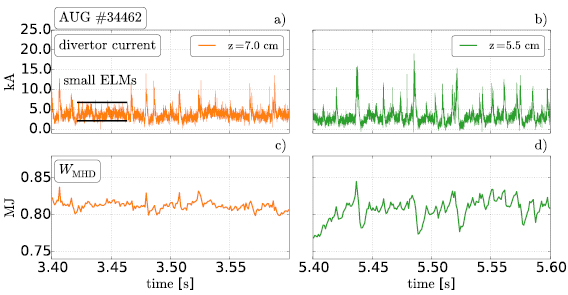
Figure 7. Divertor current (a, b) and stored Energy WMHD (c, d) of the two time windows defined in figure 5, comparing the plasma shapes shown in figure 6.
Download figure:
Standard image High-resolution imageA comparison of edge (a) electron density, (b) electron temperature, (c) electron pressure and (d) ion temperature profiles is shown in figure 8 for the two phases representing z positions at 7.0 cm (orange) and 5.5 cm (green) also indicated in figure 5. As the gas fuelling is kept constant, the kinetic profiles do not change at all while the ELM behaviour does change (figure 7). This is in contrast to the profiles shown in figure 3, where a distinct difference around the separatrix density was visible. As above the profiles were fitted using the mtanh function while and the experimental error of the profiles shown in figure 8 is very similar to the one in 3 and has therefore been omitted here for better visibility.

Figure 8. Edge profiles of (a) electron density, (b) electron temperature, (c) electron pressure and (d) ion temperature for the two different phases indicated in figure 5, in which the magnetic axis of the plasma is shifted from 7.0 cm (orange) to 5.5 cm (green) (figure 6).
Download figure:
Standard image High-resolution imageThese two experimental scans show that the separatrix density is a necessary but not sufficient criterion for the existence of small ELMs. While in the first set of experiments (section 2.1), the pedestal top density ( m−3) and the separatrix density were decoupled by changing from gas fuelling (
 m−3) to pellet fuelling (
 m−3), small ELMs were dominant at high separatrix density, in the second set of experiments (section 2.2) a tiny change in the plasma configuration brought back larger type-I ELMs, without a change in the kinetic edge profiles (
 stayed at
  m−3).
m−3).
The strong dependence of the small ELMs on the separatrix density suggests, them to be very localized modes near the separatrix. A correlation of the tokamak H-mode density limit with the stability of modes at the separatrix has recently been found at AUG [32]. The ballooning stability of such modes is determined by the pressure gradient as driving term and the magnetic shear as stabilizing term, see  diagram in [33, chapter 5.2.2]. As the pressure gradient exhibited no significant change for the second set of experiments (compare profiles in figure 8), the analysis focuses on the evaluation of the magnetic shear.
Figure 9 shows the flux surface averaged magnetic shear  in the relevant pedestal area showing a higher shear for the lower plasma position. The derivative of the safety factor
  was calculated here as
  . A factor
  can be be taken into account to see if the effect is due to flux expansion and to compute
  . This factor was found to be lower for the lower shear case and higher for the case with the higher shear and therefore amplified the effect shown in figure 9. The described difference is also visible in the local magnetic shear although more complex and dependent on the poloidal angle. Recently, a local change of ballooning mode stability due to changes (distortion) of the local magnetic shear has also been reported in ASDEX Upgrade experiments with external magnetic perturbations [34].
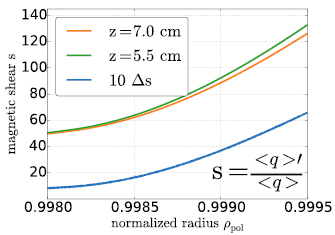
Figure 9. Flux surface averaged magnetic shear  for the two phases defined in figure 5. For better visibility the difference of the shear profiles
  , plotted in blue, is magnified by a factor 10.
Download figure:
Standard image High-resolution image2.3. Stability analyses and predictive modeling
In the first set of experiments we show that not the pedestal top but that the separatrix parameters play a role for the appearance of small ELMs. In the second set, however, the kinetic profiles are very similar, so that another parameter must also be important which changes at the slightly lower z-position. To understand the transition from type-I to small ELMs, we first start with the analysis of the pedestal in the frame of ideal peeling–ballooning (PB) modes. The linear ideal stability boundary is calculated using the work-flow described in [35]. Figure 10 shows the operational points of all 5 instances described in the previous section with 15% error bars, again keeping the color code. All operational points lie very close to their respective ideal peeling–ballooning stability boundary. Both regimes with dominantly small ELMs (orange '7.0 cm' and red 'gas fuelling') exhibit not only the highest normalized pressure gradient α, with  , but also the highest edge current density
  . It had already been shown in [36], that the correlation between edge current density and normalized pressure gradient is not easily broken, because the neoclassically driven current density is influenced by two effects in opposite directions: the increased collisionality reduces the drive while the density gradient provides a stronger drive than the temperature gradient. An explanation for smaller ELMs at higher collisionality being due to the effect of a reduced edge current density [16] is therefore not applicable in these presented cases. While it seems counter-intuitive that the small ELM points lie close to the type-I ELM boundary, it is likely that the changes in stability parameters are too small to be identified outside of experimental uncertainties.
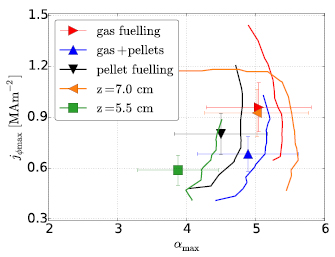
Figure 10. Peeling-ballooning stability diagrams of discharges #34462 and #34483 (edge plasma current density j versus normalized pressure gradient  ) for all analyzed time windows.
Download figure:
Standard image High-resolution imageTo understand the effect that the separatrix density has on the maximum stable pedestal top pressure  , a predictive scan using the iPED stability code [35] was performed, in which
  , was varied independently with respect to the pedestal top density.
This scan is shown as grey dots with 5% error bars in figure 11 and with three specific expamples for  m−3 in green, for
  m−3 in magenta and
  m−3 in orange. The scan in figure 11(a) shows, that this does not change the maximum pedestal top pressure. However, if
  is slightly changed by varying the out-most (
 ) density gradient
  , i.e. shifting the maximum gradient slightly inward, compare magenta and blue profile, pped increases by ∼10%.
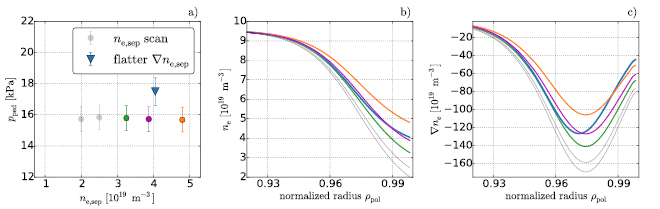
Figure 11. Predictive stability scan with the iPED code (a) with corresponding electron density profiles (b) and electron density gradient  (c).
(c).
Download figure:
Standard image High-resolution imageThe reason for this behaviour is that the region with steep gradients is narrower and shifted inward, providing better stability against PB modes and consequently allowing for higher pedestal top values.
iPED does not run with separatrix geometry, so the region included is restricted to the closed flux surfaces. The model considers ideal MHD modes, with mode numbers ranging between 1–70. The pedestal gradients are not calculated by transport codes, but the pedestal width is assumed to scale as  , as in the original EPED code [37]. Once a series of pedestal top values have been selected, the width and location of the pedestal are then calculated and the result used as input to the MISHKA ideal-MHD stability code [38]. When an unstable mode is found, a mode structure covering the entire gradient region will be returned, which is the main focus of the iPED code. An actual calculation of the stability of the
  ballooning mode has not been done in this case; it is left for future work to investigate under which conditions this mode is (un)stable.
3. Discussion and conclusions
From the presented work the following picture emerges: Small ELMs and type-I ELMs can occur simultaneously, as observed in experiments. Similar to standard ELM-ing pedestal models [39–41], the existence of global type-I ELMs can satisfactorily be described by linear peeling–ballooning theory, the gradient being set by some transport limitation, the critical pedestal height and width by PB stability limits. The small ELMs, on the other hand, are influenced by local parameters. Following Scott [42] who showed that small scale turbulent structures drive ballooning modes, small ELMs might be ballooning modes that are localized near the separatrix. Such modes have high toroidal mode numbers and are therefore radially narrow, driven by the local pressure gradient and stabilized by magnetic shear. Transport driven by these modes increases with density [42]. At high separatrix density they can create large particle transport locally, flattening the gradient and effectively narrowing the pedestal width, which in turn increases the stability against global PB modes.
Figure 12 demonstrates this emerging picture schematically, making use of the widely used  diagram together with a heat- or particle flux diagram with a critical gradient. The low triangularity type-I ELMy case is depicted in figure 12(a) with the operational point close to the stability boundary in black. For these cases the critical pressure gradient
  (figure 12(b)) at the separatrix is not yet reached. Therefore, small ELMs do not play a significant role and type-I ELMs are the only limiting instability. At higher triangularity the stability boundary is shifted towards higher
  , shown in red. At the same time the normalized pressure gradient at the separatrix,
  , will reach the critical gradient and drive ballooning modes unstable. Increasing the pressure gradient at the separatrix is only possible via an increase in density, as the temperature is limited by parallel heat transport to the divertor plates. Any increase in
  will lead to even higher transport, indicated in orange (figure 12(b)), visible as small ELMs with increasing amplitude, which keep the pressure gradient around the separatrix close to the small ELM critical stability limit. Therefore, this region contributes less to the total pressure gradient of the global type-I ELM, effectively narrowing the pedestal width. A narrower pedestal, however, can tolerate a steeper pressure gradient, and the stability boundary is shifted to higher
  , indicated in orange (figure 12(b)). The operational point can now stay below the peeling–ballooning stability boundary, so that no type-I ELMs occur. If the magnetic shear changes toward higher values, e.g. via the small downward shift of the plasma position, the critical gradient at the separatrix,
  , will shift towards higher values. Transport consequently decreases, as indicated by the green star in figure 12(d). The higher
  and the concomitant reduced transport increases the pressure gradient in the narrow region inside the separatrix, making the pedestal effectively wider. This moves the PB boundary to lower values at
  , allowing type-I ELMs to occur again (green in figure 12(c)).

Figure 12. Schematic description of small ELM occurrence. Type-I ELM mechanism on the left (a) and (c), small ELM mechanism on the right (b) and (d) (color coding analogous to the experiments).
Download figure:
Standard image High-resolution image
4. Future work
To further understand the effect of the global and the local magnetic shear on the small ELMs additional experiments with a large variation in the toroidal magnetic field and therefore the safety factor q are planned. It is also planned to combine magnetic shear and vExB shear to see their effect on ballooning structures and their radial transport properties [43]. Furthermore transport simulations with ASTRA should be able to quantify the particle and energy transport caused by small ELMs and would therefore be very valuable to get a better grasp on the properties and features of small ELMs.
Acknowledgments
GF Harrer is a fellow of the Friedrich Schiedel Foundation for Energy Technology. This work was carried out within the framework of the EUROfusion Consortium and received funding from the Euratom research and training programme 2014–2018 under Grant Agreement No. 633053. The views and opinions expressed herein do not necessarily reflect those of the European Commission.