


Abstract
Studies of edge plasma and impurity transport with the toroidally and poloidally localized liquid lithium limiter (LLL) on EAST have been performed by the three-dimensional (3D) edge transport code EMC3-EIRENE. The transport behavior of the Li1+ and Li2+ ions shows a non-axisymmetric distribution in the toroidal direction while an axisymmetric distribution is obtained for the Li3+ ions. The spatial structure of the charge state and excitation radiation patterns of lithium impurity can be understood by using field line tracing, which shows that the Li ions with different charge states exhibit different parallel transport behaviors. The 3D line-integrated LiII emission pattern simulated by EMC3-EIRENE shows a reasonable qualitative agreement with the experiment results measured by the CCD camera system on EAST. An unresolved issue in the LLL experiment is that the species emitting the strong visible spectrum observed around the edge plasma region cannot be distinguished by the current experimental diagnostics on EAST. The detailed numerical analysis of the carbon and deuterium emissions has been carried out to resolve this issue. The simulated deuterium emission pattern shows the same qualitative behavior as the experimental observation at the lower divertor region. The strong radiation experimentally observed at the upper divertor region is perhaps due to the mixing of the lithium and deuterium emissions.
Export citation and abstract BibTeX RIS

Original content from this work may be used under the terms of the Creative Commons Attribution 3.0 licence. Any further distribution of this work must maintain attribution to the author(s) and the title of the work, journal citation and DOI.
1. Introduction
The transport of edge impurity is one of the most important topics for the operation and performance of fusion devices, which can be divided into impurity generation, ionization of released neutral impurities, and transport of impurity ions [1, 2]. The impurity content must be kept sufficiently low in order to prevent the dilution of the background plasma. Further, impurity emission leads to a substantial energy loss and a decrease of available fusion power, especially for high-Z impurities. On the other hand, a good control of impurity content in the edge plasma has a positive effect on the reduction of heat load on divertor targets, which can extend the lifetime of divertor targets [3]. Hence, studies of edge impurity transport are important to obtain a better understanding of impurity control, detached divertor operation and plasma-wall interaction.
Lithium has been recognized as a promising plasma-facing material in next-step fusion devices [4, 5]. Lithium can reduce the fuel recycling via trapping the hydrogen isotopes [6, 7], which leads to a high plasma temperature and low electron density at the edge region and further enhances the plasma confinement [8, 9]. In addition, lithium injection is advantageous to the elimination of edge-localized modes (ELMs) and mitigation of plasma-wall interaction during ELMs [10, 11]. Lithium with strong chemical activity can absorb atomic or ionic species through the formation of the complex chemical compounds with other elements, such as carbon and oxygen, which leads to the reduction of impurity content [12, 13]. In light of these advantages of lithium material, lithium application experiments have been conducted in several fusion devices, such as TFTR, NSTX, TJ-II, FTU and CDX-U [14–18].
Liquid lithium limiter (LLL) experiments have been carried out on the EAST tokamak to obtain mitigation of plasma-material interactions [19–21]. However, there are still some uncertainties in the transport properties of lithium impurity in the edge plasma of EAST. Since the toroidally and poloidally localized LLL can lead to the asymmetric distributions of lithium impurity, the edge plasma and impurity transport in the LLL experiment on EAST has been investigated by using the three-dimensional (3D) edge transport code EMC3-EIRENE [22, 23]. The transport characteristics of the Li1+ and Li2+ ions show a non-axisymmetric distribution in the toroidal direction while the Li3+ ions present an axisymmetric distribution. The spatial distributions of the Li ions with different charge states in the scrape-off layer (SOL) can be well understood by using field line tracing (FLT). The Li1+ ions due to the low ionization potential mainly populate at the low field side (LFS) near the LLL. The Li2+ ions with a deeper penetration can migrate from the LFS to the high field side (HFS) along the magnetic field lines. The CCD camera system installed on EAST has been applied to observe the visible spectrum emitted by the plasma and impurity, especially for the LiII (emitted by Li1+) emission measurements [24–26]. It enables us to perform a comparative study between the LLL experiment and the EMC3-EIRENE modelling. A reasonable qualitative agreement between the 3D line-integrated emission simulation and the experiment results of LiII emission pattern has been achieved. The detailed analysis of the resultant 3D line-integrated Li emission pattern has been conducted by means of the 2D poloidal emission profiles of Li impurity. The work also has been motivated by the fact that species emitting strong visible spectrum at the edge plasma cannot be distinguished by the current experimental diagnostics on EAST. The analysis of the 3D line-integrated emission between the carbon and deuterium has been performed by EMC3-EIRENE. The strong deuterium emission pattern at the lower divertor region shows a better agreement with the experimental observation measured by the CCD camera system compared to the carbon emission pattern. Strong radiation at the upper divertor region is obtained in the CCD observation, which is likely due to the mixing of the lithium and deuterium emissions.
In section 2, the description of the EMC3-EIRENE code and construction of the EMC3-EIRENE simulations are addressed. The transport and emission studies of edge impurity and plasma in SOL of EAST are discussed in section 3, which presents the detailed analysis of the individual contributions of the lithium, deuterium and carbon to the emission pattern measured by the CCD camera system. Finally, the conclusions are presented in section 4.
2. The implementation of the EMC3-EIRENE code on EAST
2.1. The description of the EMC3-EIRENE code
The EMC3-EIRENE code has been widely used for 3D edge plasma and impurity transport modelling in the stellarators and tokamaks, such as W7-AS [27, 28], W7-X [29, 30], LHD [31–38], Alcator C-Mod [39], ASDEX Upgrade [40–43], JET [44], DIII-D [45–47], EAST [48, 49] and ITER [50–52]. The EMC3 code solves the Braginskii fluid equations for plasma transport and is self-consistently coupled with the EIRENE code [22, 23]. The EIRENE code is applied for treating the kinetic neutral transport. The plasma transport model in the EMC3 code consists of the steady-state fluid equations for the particle, momentum and energy transport of ions and electrons. In addition, the EMC3 code also includes a self-consistent treatment of impurity transport for the studies of the relevant impurities [22]. In the impurity trace model, the ion thermal force and the friction force are the dominant forces acting on impurity for the impurity parallel transport [53]. The impurity is pulled by the friction force to the divertor targets, however, the ion thermal force compels the impurity towards the upstream with the high temperature. Hence, the impurity transport and distribution in the edge region are determined by the force balance between the ion thermal force and the friction force. The feedback of impurities on the background plasma is given by the energy sinks due to excitation and ionization of impurities.
2.2. The construction of the EMC3-EIRENE simulation
Figure 1 shows the sketch of the LLL and the CCD camera system installed on EAST. The LLL installed on the material and plasma evaluation system (MAPES) platform on EAST can move along the horizontal direction [21]. The poloidal view of the LLL position is shown in the inset figure, which has an inclination angle of 13.4° with respect to the vertical direction. The horizontal and vertical positions of the LLL surface center are located at R = 2.32 m and Z = 0.12 m, respectively. The toroidal location of the LLL surface center is defined as the toroidal angle  = 0° in this study. In addition, the height and length of the LLL surface are 30 and 32 cm as shown in figure 1, respectively. Hence, the LLL surface spans a toroidal range of about 8°, i.e. −4° to 4° along the toroidal direction. The CCD camera system is installed at the horizontal distance of R = 2.90 m, which is located at the toroidal angle
  = 270° as shown in figure 1. The CCD camera system viewing the opposite side of the LLL is a true color camera with 20 Hz frame [21], which can provide the distributions of edge plasma and impurity emissions as shown in the inset profile. The LiII (wavelength at 548.40 nm with green visible spectrum) emission distribution can be observed by the CCD camera system as shown in the inset figure.
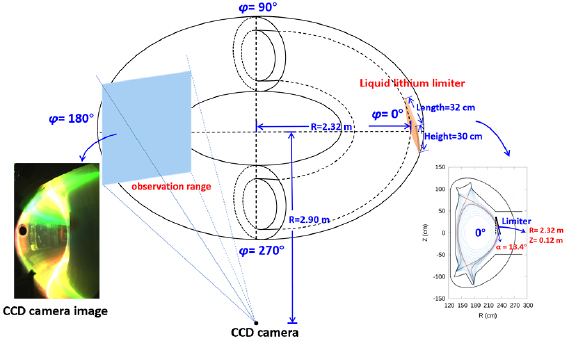
Figure 1. Sketch of the LLL and the CCD camera system installed on EAST.
Download figure:
Standard image High-resolution imageThe computational grid is constructed according to the shot 52693 of EAST at 4.0 s during the steady-state phase. The magnetic configuration is biased towards the lower single null (LSN) magnetic configuration, while the computational grid is constructed as a disconnected double null magnetic configuration in figure 1 to reduce dependence of the simulation results on the radial boundary conditions. The toroidal simulation domain is covered by the complete 360° computational grid. The input parameters of the EMC3-EIRENE simulation are specified according to the experimental measurements during EAST discharge. The input power is about 686 kW, which is equally divided into the power of electrons and ions in the simulation. The upstream density is fixed at 3.0 × 10¹⁸ m−3, which is regarded as an inner boundary condition of the particle transport in EMC3-EIRENE. When impurity species touch the inner boundary, all charge states are reflected as the same charge states. The Bohm sheath boundary condition is used at the divertor target plates. The lower divertor target of EAST is made of graphite. The sputtering coefficient of carbon impurity is set to 0.01 in the simulation. The neutral carbon is released from the divertor target plates according to the plasma flux deposition distribution. The experimental measurement of the electron density and temperature at the outer mid-plane has been performed by the edge reciprocating probe. The cross-field particle and energy transport coefficients of background plasma,  and
and  , are determined by fitting the electron density and temperature profiles measured by the edge reciprocating probe on EAST. Figure 2 shows the electron density and temperature distributions measured at the outer mid-plane of EAST and modelled by EMC3-EIRENE code. Here, rLCFS is the radial position of the separatrix. The measured electron density and temperature are averaged over the time period of 1 ms. A good matching between the experimental measurements and simulation results has been achieved by using
  = 0.4 m2 s−1 and
  = 0.4 m2 s−1 for the electron density distribution, whereas the plasma temperature distribution modelled by the EMC3-EIRENE is a little lower than the measurements at the radial position of r − rLCFS = 22–37 mm. The cross-field transport coefficients of lithium and carbon impurities are assumed to be the same as the background plasma, i.e. 0.4 m2 s−1.
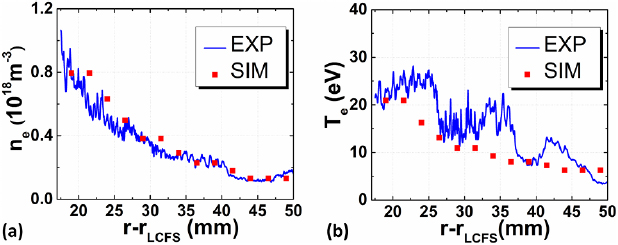
Figure 2. Electron density (a) and temperature (b) distributions measured at the outer mid-plane of EAST and modelled by EMC3-EIRENE code. The radial position of the LLL is about 50.0 mm away from the separatrix at the mid-plane position.
Download figure:
Standard image High-resolution image3. Edge impurity and plasma transport in the LLL experiment
3.1. The basic features of lithium impurity transport in SOL
The poloidal distributions of the electron density and temperature at the toroidal angle of  = 0° are presented in figures 3(a) and (b), respectively. The LSN magnetic configuration leads to a higher electron density in the lower divertor region, which can result in a strong recycling flux and deuterium emission at the lower divertor, as shown later in figure 13(a). The electron density of the lower divertor leg region is about 1.5 × 10¹⁸ m−3 as shown in figure 3(a). The LLL position is indicated with a black line in the poloidal cross section as shown in figure 3(a). It is found that the electron density near the LLL position is around 1.0 × 10¹⁸ m−3. The plasma temperature around the LLL position is less than 40 eV as shown in figure 3(b). The electron density and temperature distributions on the LLL surface are presented in figures 3(c) and (d), respectively. The horizontal and vertical coordinates in figures 3(c) and (d) show the LLL dimension and the origin point is the center position of the LLL. It can be seen that the electron density and temperature reduce radially from the LLL center position, which is ascribed to the inclination of the LLL as shown in figure 1, i.e. the tangential effect.
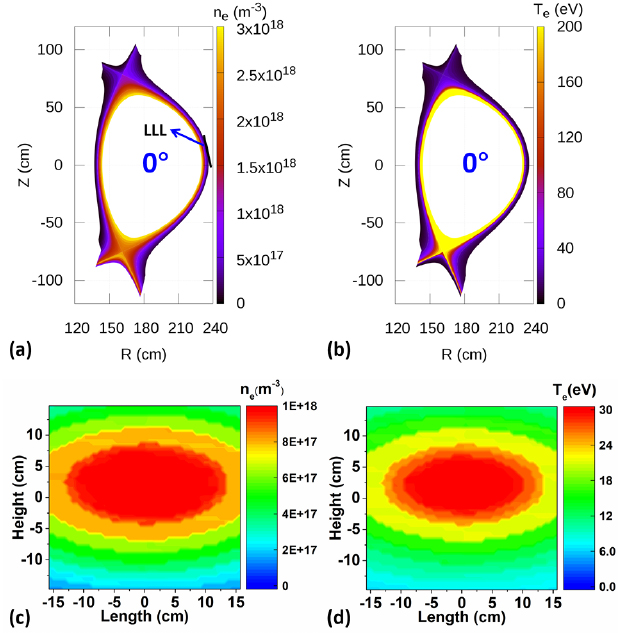
Figure 3. Poloidal distributions of the electron density (a) and temperature (b) at the toroidal angle of  = 0° and the distributions of the electron density (c) and temperature (d) on the LLL surface.
Download figure:
Standard image High-resolution imageThe physical sputtering yield of Li impurity on the LLL surface can be assessed by the empirical formula according to [54], in which the projectile energy and incident angle are the decisive parameters for calculating physical sputtering yield. The projectile energy of D+ ions (E = 2Ti + 3Te) is estimated based on the plasma temperature in figure 3(d) ( in the modelling). The incident angle of D+ ions is assumed to be 60° in the calculation of physical sputtering yield of Li impurity. The calculated Li flux from the LLL surface erosion is about 2.76 A. Test simulations with the enhancement of eroded Li flux have been performed to check the impact of the eroded amount of Li flux on the emission distributions of Li impurity. It is found that the larger amount of Li neutrals eroded from the LLL surface can change only the overall magnitude of the Li emissions while has a negligible impact on the Li emission structures. Hence, the eroded amount of Li flux is not a critical value for the qualitative comparison of the LiII emission belts between the simulation and experiment results presented elsewhere later. Lithium neutrals are eroded with a cosine angular distribution and an injected energy E0 = 0.05 eV. Test simulations with the injection direction normal to the LLL surface and a higher injected energy E0 = 0.5 eV have been carried out as well, which indicates that the overall structure of LiII emission belts is not affected by the injected direction and energy of the eroded Li neutrals. The poloidal distribution of force balance between the friction force and the thermal force (
 ) acting on the impurity species is presented in figure 4. It is can be seen that the ion thermal force is dominant force in the upstream SOL region of the LFS, whereas the friction force becomes the dominant around the divertor region.
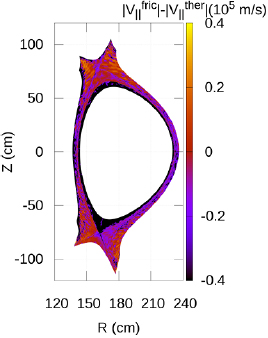
Figure 4. Poloidal distribution of force balance between the friction force and the thermal force ( ) acting on the impurity species.
Download figure:
Standard image High-resolution imageFigure 5 displays the poloidal density distribution of the lithium neutrals at the toroidal angle of  = 0°. The individual ionization potentials of the Li0+, Li1+ and Li2+ particles are 5.4, 75.6 and 122.5 eV according to the ADAS database [55]. The peak value of the lithium atoms density is more than 1.0 × 10¹⁶ m−3 as shown in figure 5. The lithium neutrals are mainly distributed near the LLL at the toroidal angle of
  = 0°. This is because the eroded lithium atoms quickly ionize near the LLL due to the small ionization potential (5.4 eV).
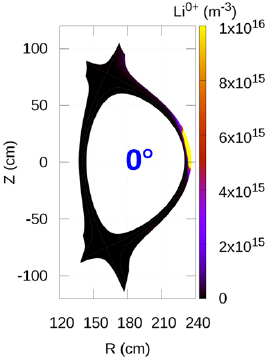
Figure 5. Poloidal density distribution of the lithium atoms at the toroidal angle of  = 0°.
= 0°.
Download figure:
Standard image High-resolution imageFigure 6 shows the poloidal density distributions of the Li1+ ions at the toroidal angles of  = 0°, 90°, 180° and 270°. It can be seen that the Li1+ ions mainly populate at the LFS, which shows a non-axisymmetric distribution in the toroidal direction. Near the LLL, the maximum of the Li1+ ions density is more than 1.0 × 10¹⁶ m−3 as shown in figure 6(a). In addition, there also exist the peak values of the Li1+ ions density at the downstream region. For the other toroidal angles in figure 6, the peak values of Li1+ ions density are distributed at several poloidal locations of the LFS. The spatial structure of the Li1+ ions density at different poloidal cross sections can be understood by the FLT. The positive and negative toroidal directions of the magnetic field are in the anti-clockwise and clockwise directions along the torus from the top view, respectively. The FLT along positive and negative toroidal directions are represented by the positive and negative tracing toroidal angles, which are denominated as the respective forward (F) and backward (B) tracing as shown in figure 6. The same start points F (0°) and B (0°) for forward and backward tracing of the flux tube, where Li1+ ions have a higher density value, are indicated at the toroidal angle of
  = 0° in figure 6(a). It is found that the point F (0°) rotates poloidally from the SOL to the lower outer divertor target after forward tracing the toroidal angle of 630°. On the other hand, the scan for the point B (0°) along the backward toroidal direction has been done using the same FLT technique. The poloidal location of the point B (0°) moves to the upper outer divertor target with a larger toroidal tracing angle of about 900° compared to F (0°) as shown in figure 6. According to the edge transport property of the Li1+ ions in figure 6, one can see that the magnetic field lines at the outermost SOL connect the lower and upper outer divertor targets.
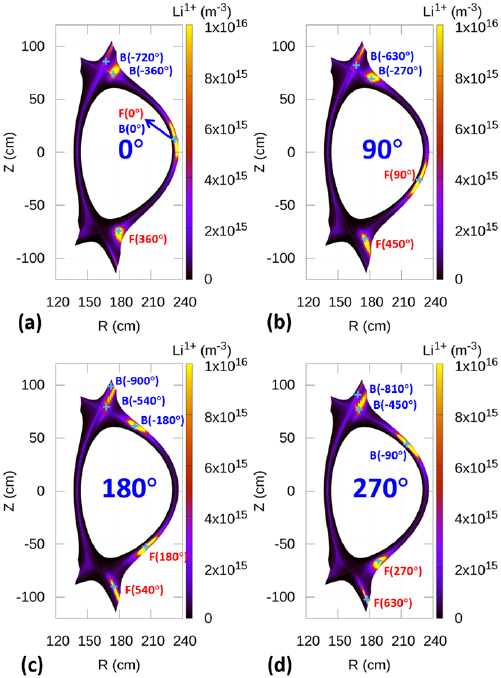
Figure 6. Poloidal density distributions of the Li1+ ions at the toroidal angles of  = 0° (a), 90° (b), 180° (c) and 270° (d).
Download figure:
Standard image High-resolution imageThe poloidal density distributions of the Li2+ ions are presented in figure 7 for the toroidal angles of  = 0°, 90°, 180° and 270°. The radial penetration depth of the Li2+ ions in figure 7 is deeper than that of the Li1+ ions in figure 6 due to the higher ionization potential. The density distribution of the Li2+ ions also shows a non-axisymmetric distribution in the toroidal direction as shown in figure 7. In addition, there are also several peak values of the Li2+ ions density located at different poloidal positions. The FLT technique is used to obtain a better understanding of the 3D spatial structure of the Li2+ ions in the SOL region in figure 7. It is noted that the start point in figure 7, with a deeper radial penetration depth, is different from the start point in figure 6. The same start points F (0°) and B (0°), where has a high Li2+ density, are used as the start points for tracing the Li2+ ions along the toroidal direction. The poloidal rotation of the point F (0°) moves to the lower outer divertor target by forward tracing the field line more than one toroidal rotation. On the other hand, the reversed FLT of the point B (0°) has been carried out which has a much higher toroidal tracing angle compared to F (0°) as shown in figure 7. It can be seen that the point B (0°) can migrate poloidally from the LFS to the HFS. In particular, the poloidal rotation of the Li2+ ions near the upper X-point becomes very slow compared to the other domains, which is due to the reduced poloidal component of the magnetic field near the X-point. Finally, the backward FLT terminates at the lower inner divertor target as shown in figure 7(b). Hence, the deeper penetration of the Li2+ ions into the flux tubes, which can connect the lower outer and inner divertor targets, results in a different transport characteristic from the Li1+ ions. The spatial distributions of Li1+ and Li2+ ions are mainly associated with flux tube structure according to the FLT results. This indicates that the dominated thermal force near the LLL drives the Li1+ and Li2+ ions to migrate along the flux tube. When the Li1+ and Li2+ ions move to downstream divertor regions, the friction force becomes dominant, which can push the Li1+ and Li2+ ions to divertor targets.

Figure 7. Poloidal density distributions of the Li2+ ions at the toroidal angles of  = 0° (a), 90° (b), 180° (c) and 270° (d).
Download figure:
Standard image High-resolution imageFigure 8 presents the poloidal density distributions of the Li3+ ions at the toroidal angles of  = 0°, 90°, 180° and 270°. It is seen that the distributions of the Li3+ ions are axisymmetric in the toroidal direction. The Li3+ ions can penetrate into the closed magnetic surface due to the high ionization potential, which shows an uniform distribution of the Li3+ density at the closed magnetic surface as shown in figure 8. The peak value of the Li3+ ions is more than 2.0 × 10¹⁵ m−3 at the closed magnetic surface.

Figure 8. Poloidal density distributions of the Li3+ ions at the toroidal angles of  = 0° (a), 90° (b), 180° (c) and 270° (d).
Download figure:
Standard image High-resolution imageFigure 9 shows the emission distributions of the LiI (emitted by Li neutrals), LiII and LiIII (emitted by Li2+) at the toroidal angle of  = 0°. The emission distributions of the lithium impurity are calculated according to the expression
  , where
  is the electron density,
  is the impurity density, z represents the charge state of impurity and
  is the emission coefficients taken from the ADAS database [55]. The wavelengths of the impurity species used in the simulation are given in the table 1, which are the characteristic spectral lines in the visible spectrum range (380–780 nm). The LiI emission is mainly distributed at the vicinity of the LLL due to the high neutral lithium density as shown in figure 5. The LiII emission distribution near the LLL position is mainly determined by the Li1+ density distribution in figure 6. A reduced area of the peak values of the 2D LiII emission pattern in figure 9(b) is obtained close to the upper and lower X-points compared to the Li1+ density distribution in figure 6(a), which indicates that the LiII emission distribution is also related to the electron density and temperature distributions in figures 3(a) and (b). A strong LiIII emission around the LCFS region is obtained as shown in figure 9(c). The LiII emitting green light is observed by the CCD camera in the edge plasma of EAST as mentioned above. In order to obtain a better understanding of the lithium emission properties, the 3D line-integrated LiII emission distribution has been performed based on the EMC3-EIRENE modelling. A detailed comparison of the lithium emission patterns between the CCD observation and the EMC3-EIRENE simulation is conducted in the following subsection.
Table 1. Visible wavelengths of the lithium and carbon impurity for different charge states.
| Impurity species | Wavelength (nm) |
|---|---|
| LiI | 670.80 |
| LiII | 548.40 |
| LiIII | 450.02 |
| CI | 681.51 |
| CII | 658.15 |
| CIII | 465.01 |
| CIV | 580.65 |

Figure 9. Poloidal distributions of LiI (a), LiII (b) and LiIII (c) emissions at the toroidal angle of  = 0°.
= 0°.
Download figure:
Standard image High-resolution image3.2. The contribution of lithium emission to CCD observation
The emission distributions of edge plasma and impurity in the LLL experiment can be measured by the CCD camera system installed on EAST as shown in figure 10(a). The measured emission profile has been divided into 6 domains in order to make a comparative study between the experiment and simulation, which are denominated as the domains D1-D6 as shown in figure 10(a). The LiII emissions (green spectrum) are mainly distributed in the SOL, which are named as the domains D1-D4. In the domains D5 and D6, there are the strong emissions observed in the experimental measurements. However, the corresponding species for domains D5 and D6 cannot be distinguished by the current experimental diagnostics on EAST. The emission pattern for the domain D6 is marked by the red arrow for the following discussion. Figure 10(b) shows the 3D line-integrated LiII emission distribution based on EMC3-EIRENE modelling. The 3D line-integrated lithium emission distribution is obtained by calculating the LiII emission inside each volume cell and then integrating along the diagnostic lines of sight through the simulation domain [34]. A good qualitative agreement between the CCD observation and the EMC3-EIRENE simulation has been achieved for the LiII emission distributions in the domains D1-D4 as shown in figure 10. The strong LiII emissions in the domains D5 and D6 are obtained by EMC3-EIRENE modelling while the green spectra are not observed in D5 and D6 by the CCD camera. This discrepancy between the simulation and experiment is induced by the strong deuterium emission covering the LiII emission as later shown in the section 3.3. The detailed interpretation of the strong LiII emission in the domain D6 marked by the red arrow is given in the following discussion. A further analysis of the 2D poloidal LiII emission profiles has been conducted in figures 11 and 12 to obtain a better understanding of the corresponding locations in the 3D line-integrated LiII emission distribution.
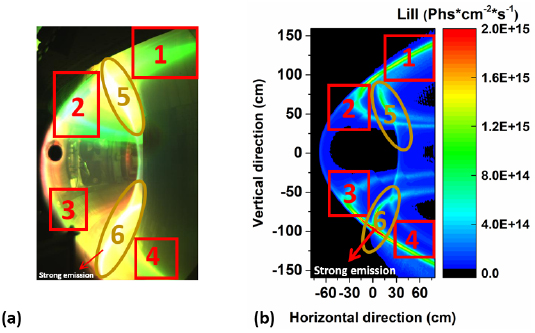
Figure 10. Distributions of the edge plasma and impurity emissions measured by the CCD camera system on EAST (a) and the line-integrated LiII emission profile based on EMC3-EIRENE modelling (b).
Download figure:
Standard image High-resolution image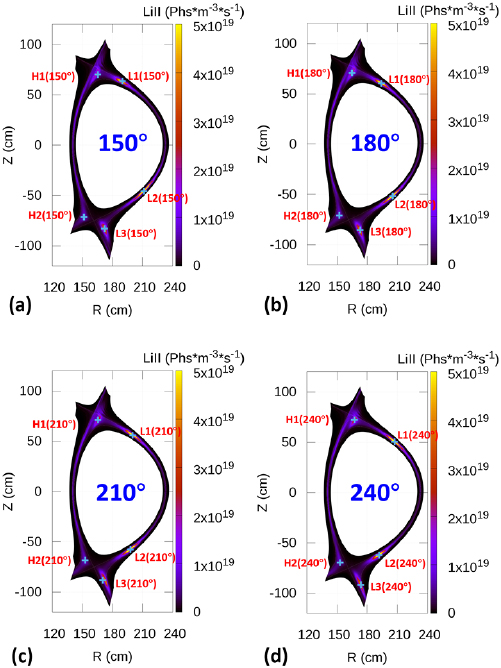
Figure 11. Poloidal distributions of the LiII emission at the toroidal angle of  = 150° (a), 180° (b), 210° (c) and 240° (d).
Download figure:
Standard image High-resolution image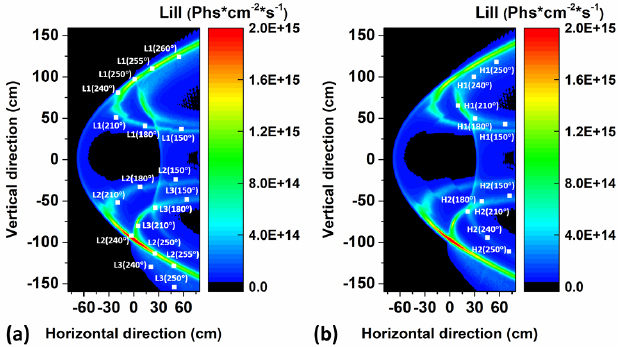
Figure 12. Line-integrated LiII emission profile including the projection points L1–L3 (a) and H1–H2 (b) as shown in figure 11.
Download figure:
Standard image High-resolution imageFigure 11 shows the poloidal distributions of the LiII emission at the toroidal angles of  = 150°, 180°, 210° and 240°. In order to study the relation between the 2D poloidal LiII emission in figure 11 and 3D line-integrated LiII emission in figure 10(b), some points (L1–L3 and H1–H2) in figure 11, which have the strong LiII local emissions, are selected to project them onto the profile of the 3D line-integrated LiII emission. Figure 12 shows the line-integrated LiII emission profile which includes the projection points (L1–L3 and H1–H2) in figure 11. The projection points with the strong LiII emission in the larger toroidal angles (higher than 240°) into the 3D line-integrated LiII emission have also been performed to investigate the domains of the LiII emission belts in figure 10(b). The toroidal LiII emission distribution for the point L1 (150°–260°) leads to the formation of the strong LiII emission belt at the upper LFS as shown in figure 12(a), i.e. the domains D1 and D2 in figure 10(b). The similar phenomena are also observed for the points L2 (150°–255°) and L3 (150°–250°), which forms two strong emission belts along the toroidal direction at the lower LFS. The trajectory of the emission belt for the point L2 leads to the observed strong emissions in the domains D3 and D4 in figure 10(b). The LiII emission at L2 (240°) is stronger compared to L2 (210°) due to the line integrated effect along the observation chord. The toroidal LiII emission distribution of the point L3 can result in the strong emission belts in the domain D6 in figure 10(b). In particular, it can be seen that the LiII emissions for the points L2 and L3 overlap near the toroidal angle of 240°, which results in the strong LiII emission (marked by the arrow) in the domain D6 in figure 10(b). In addition, the line-integrated effect also plays an important role, which leads to the strong emission between D3 and D6 regions in figure 10(b). On the other hand, the strong LiII emission for the point H1 (150°–250°) has a good matching with the trajectory of the strong emission belt as shown in figure 12(b), which constitutes the strong emission of the domain D5 in figure 10(b). The toroidal LiII emission distribution for the point H2 (150°–250°) leads to the LiII emission belt at the lower HFS as shown in figure 12(b). Based on the projection method, one can make clear the relationship between the 2D poloidal LiII emission and the 3D line-integrated LiII emission.
Considering the LSN magnetic configuration, the strong recycling deuterium and the eroded carbon from the lower divertor targets can be the possible cause leading to the strong visible spectrum around the edge plasma regions denominated as the domains D5 and D6. Therefore, further EMC3-EIRENE modelling for the emission distributions of edge plasma and carbon impurity has been performed in the following subsection to reproduce and to interpret the experimental observation.
3.3. The contribution of deuterium and carbon emissions to CCD observation
Figure 13 presents the 2D poloidal emission distribution and 3D line-integrated emission pattern of the deuterium neutrals. The visible wavelength of the  line is 656.1 nm. Stronger deuterium emission at the lower divertor region is obtained as shown in figure 13(a). It can be seen that the emission patterns in the domains D5 and D6 show similarities in structures with the experimental CCD observation. The strong emission pattern in the domain D6 is indicated by the white arrow for the following comparison with the carbon emission patterns. The peak value of the deuterium emission in the domain D5 is about 1.2 × 10¹⁵ Phs · cm−2 · s−1 in figure 13(b), which is induced by the 3D line-integrated effect of 2D deuterium emission pattern in figure 13(a). The divertor target positions are projected onto the 3D line-integrated deuterium emission pattern in figure 13(b), which are indicated by the white dotted lines. It can be seen that the deuterium emission pattern around the lower divertor is strongly associated with the positions of divertor target plates as shown in figure 13(b). The peak value of the deuterium emission in the domain D6 is more than 4.0 × 10¹⁵ Phs · cm−2 · s−1, at the lower outer divertor region. On the other hand, the released carbon neutrals continually ionize and radiate in the edge plasma, which can make a contribution to the observed emission pattern by the CCD camera. A further investigation of the transport behavior and emission pattern of the carbon impurity in the edge plasma has been conducted.

Figure 13. Poloidal distribution of deuterium emission (a) and 3D line-integrated emission pattern of the deuterium neutrals (b).
Download figure:
Standard image High-resolution imageFigure 14 presents the 2D density distributions of C0+–C3+ and the 2D emission distributions of CI (emitted by C0+), CII (emitted by C1+), CIII (emitted by C2+) and CIV (emitted by C3+) at the toroidal angle of  = 180°. The emission contributions induced by C4+ and C5+ ions to the visible spectrum are marginal, and the relevant emission coefficients for the visible spectrum range are lacking in the ADAS data. Further, the C4+ and C5+ ions mainly populate at the upstream due to the higher ionization potential, which makes a negligible contribution to the emission around the divertor region. Hence, we focus the attention on the impacts of CI to CIV on the emission pattern around the divertor. It is noted that the maxima of the colour bar are the same for C0+–C3+ while different for CI to CIV. The released carbon neutrals distribute at the divertor region as shown in figure 14(a), which leads to the strong CI emission around the divertor regions in figure 14(e). The C1+ ions mainly populate at the low private region due to the low ionization potential (11.26 eV), which results in the strong CII emission in the lower private region in figure 14(f). The gradually deep penetration of the C2+ and C3+ ion leads to an impurity build-up in the SOL in figures 14(c) and (d). The dominated friction force in figure 4 constrains C1+–C3+ ions in the downstream and leads to high C1+–C3+ densities at the lower private region. The CIII and CIV emission intensities in figures 14(g) and (h) are much stronger than the CI and CII emissions in figures 14(e) and (f), which is due to the much higher emission coefficients for the CIII and CIV emissions according to the ADAS database [55].
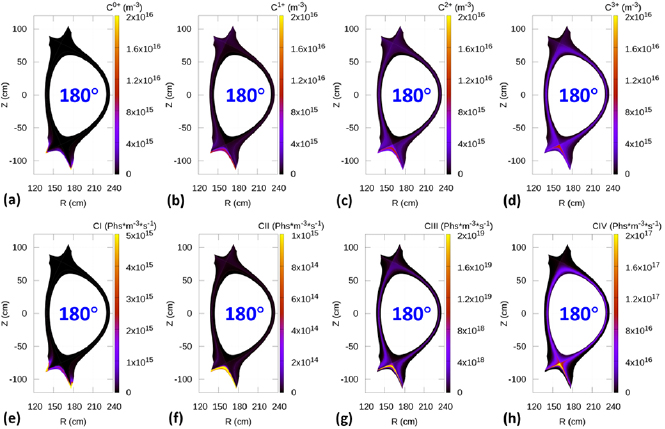
Figure 14. Poloidal density distributions of C0+ (a), C1+ (b), C2+ (c) and C3+ (d) and the poloidal emission distributions of the CI (e), CII (f), CIII (g) and CIV (h) at the toroidal angle of  = 180°.
Download figure:
Standard image High-resolution imageFigure 15 displays the individual 3D line-integrated emissions of the CI, CII, CIII and CIV. The divertor target positions are also projected onto the carbon emission patterns. The CI emission distributions are mostly populated at the lower divertor region as shown in figure 15(a). The peak values of the CI emission in the domain D6 are much less than the deuterium emission in figure 13(b), about four orders of magnitude lower. The CII emission is presented in figure 15(b) which shows that the CII emission in the domain D6 is even lower than the CI emission. Hence, the impacts of the CI and CII on the observed strong emission at the edge plasma can be excluded due to the extremely low emission intensities of CI and CII, in comparison with the deuterium emission in figure 13(b). The CIII emission in the domains D5 and D6 is stronger than the CI and CII emissions due to the higher emission coefficients as mentioned above. However, the CIII emission is still much smaller than the deuterium emission. In particular, there is no strong emission for CIII at the lower divertor targets (marked by the white arrow), in comparison with the deuterium emission in figure 13(b). The CIV emission distribution is similar to the CIII emission. However, the emission intensity of CIV is also very small, which has a slight contribution to the observed edge emission.

Figure 15. Line-integrated emission distributions of the CI (a), CII (b), CIII (c) and CIV (d).
Download figure:
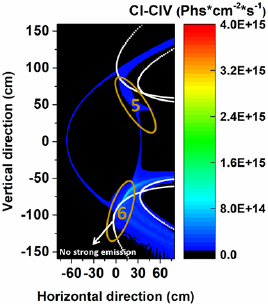
Standard image High-resolution imageThe emissions of the CI, CII, CIII and CIV are summed up in figure 16. The maximum value of the colour bar in figure 16 is comparable to that in figure 13(b). The total 3D line-integrated emission distribution of carbon impurity in the domains D5 and D6 is still smaller than the deuterium emission. Further, it can be seen that there is no strong emission around the lower divertor targets, which is indicated by the arrow as shown in figure 16. Therefore, comparative analysis shows that the deuterium emission in the domains D5 and D6 is dominant compared to the carbon emission.
Figure 16. Total line-integrated emission distribution of CI, CII, CIII and CIV.
Download figure:
Standard image High-resolution image
The synthetic image obtained by EMC3-EIRENE modelling in figure 13(b) can explain the strong radiation observed at the lower divertor in the LLL experiment. However, the strong radiation experimentally observed at the upper divertor is not well reproduced by deuterium emission according to the present simulations in figure 13(b). The strong radiation experimentally observed at the upper divertor is perhaps due to the mixing of the lithium and deuterium emissions at the upper divertor D5. It can be seen that the lithium emission intensity at D5 can reach 1.0 × 10¹⁵ Phs · cm−2 · s−1 in figure 10(b), which is comparable to the deuterium emission at D5 in figure 13(b). Hence, the mixing of lithium and deuterium emissions at D5 probably leads to the observed emission around the upper divertor D5. In order to resolve the uncertainty in strong visible spectrum around the upper divertor region, experiments are ongoing to provide more accurate information. With those revised data, the analysis should be revisited to assess further details of the transport process.
4. Conclusions
The edge plasma and impurity transport in the SOL of EAST with the toroidally and poloidally localized LLL has been investigated using the 3D edge transport code, EMC3-EIRENE. The basic impurity transport features of the Li1+ and Li2+ ions show asymmetric distributions in the toroidal direction, which results in different poloidal positions at different toroidal angles. However, the deeper penetration of the Li3+ ions leads to an axisymmetric distribution compared to the Li1+ and Li2+ ions due to the high ionization potential. The spatial distributions of the Li ions with different charge states in the SOL can be well understood by means of the FLT technique. The Li1+ ions can transport along the field lines from the SOL to the lower and upper divertor targets at the LFS. The Li2+ ions with the deeper penetration can migrate from the LFS to the HFS.
The CCD camera system installed on EAST has been used for observation of the edge plasma and impurity emission distributions, especially for the LiII emission. The 3D line-integrated LiII emission distribution in the simulations is in reasonable qualitative agreement with the experimental measurements observed by the CCD camera system. The trajectories of the emission belts in the 3D line-integrated LiII emission can be well understood by the projection of the 2D poloidal LiII emission profiles.
In the LLL experiment, the species emitting the strong visible spectrum observed around the edge plasma region cannot be distinguished due to the diagnostics limitation on EAST. The simulation results show that the deuterium emission is much stronger than the carbon emission in the edge plasma and upper divertor regions. The simulated strong deuterium emission pattern shows a qualitative agreement with the experimental observation at the lower divertor targets. The lithium and deuterium emission intensities are much higher at the upper divertor region compared to the carbon emission. That result indicates the strong visible spectrum at the upper divertor region is mainly attributed to the mixing of the lithium and deuterium emissions. In order to resolve the uncertainty in strong visible spectrum around the upper divertor region, experiments on EAST are ongoing to provide more accurate experimental data. Upgraded experimental diagnostics on EAST will be used to distinguish the wavelength of the emitting species and to treat for the absolute calibration. Based on these diagnostic improvements, the analysis should be revisited to estimate further details of the edge transport process as well as other possible transport mechanisms.
Acknowledgments
This work was supported by National Key R&D Program of China Nos. 2017YFE0300402 and 2017YFE0300501, and 2017YFA0402500, National Natural Science Foundation of China under Grant Nos. 11675037, 11405021, 11625524, 11575244, 11775269, 11775261, 11275231 and 11575249, High-level talent innovation support program of Dalian No. 2017RQ052, the Fundamental Research Funds for the Central Universities No. DUT18LK03, the ASIPP Science funds Grant No. DSJJ-17-03 and the CASHIPS Director's Funds Grant No. YZJJ201612.