


Abstract
The radio frequency detection system on the KSTAR tokamak has exceptionally high spectral and temporal resolution. This enables measurement of previously undetected fast plasma phenomena in the ion cyclotron range of frequencies. Here we report and analyse a novel spectrally structured ion cyclotron emission (ICE) feature in the range 500 MHz to 900 MHz, which exhibits chirping on sub-microsecond timescales. Its spectral peaks correspond to harmonics l of the proton cyclotron frequency fcp at the outer midplane edge, where l = 20–36. This frequency range exceeds estimates of the local lower hybrid frequency fLH in the KSTAR deuterium plasma. The new feature is time-shifted with respect to a brighter lower-frequency chirping ICE feature in the range 200 MHz (8fcp) to 500 MHz (20fcp), which is probably driven (Chapman et al 2017 Nucl. Fusion 57 124004) by 3 MeV fusion-born protons undergoing collective relaxation by the magnetoacoustic cyclotron instability (MCI). Here we show that the new, fainter, higher-frequency chirping ICE feature is driven by nonlinear wave coupling between different neighbouring spectral peaks in the lower-frequency ICE feature. This follows from bispectral analysis of the measured KSTAR fields, and of the field amplitudes output from particle-in-cell (PIC) simulations of the KSTAR edge plasma containing fusion-born protons. This reinforces the identification of the MCI as the plasma physics process underlying proton harmonic ICE from KSTAR, while providing a novel instance of nonlinear wave coupling on very fast timescales.
Export citation and abstract BibTeX RIS
1. Introduction
During ELM crashes in KSTAR deuterium tokamak plasmas, the emitted electromagnetic radiation includes chirping features with sharply-defined spectral structure in the frequency range up to ∼900 MHz [1]. Cases where the spectral peaks are below ∼500 MHz correspond to proton cyclotron harmonics at the outer midplane edge have recently been explained [2] in terms of ion cyclotron emission (ICE) [3–12] driven by a subset of the 3 MeV protons born in deuterium fusion reactions in KSTAR plasmas. This subset remains confined, because it lies on deeply passing drift orbits which carry the protons from the core to the edge and back again. Its sharply defined non-Maxellian distribution in velocity space means that this subset of the fusion-born protons can undergo the magnetoacoustic cyclotron instability (MCI) [9–26] in the edge plasma. The MCI drives waves on the fast Alfvén-cyclotron harmonic wave branch, both in analytical theory [16–20] and in first principles simulations [23–25], and these are likely to be the waves observed as ICE in KSTAR.
The magnetoacoustic cyclotron instability (MCI) is of fundamental interest because it combines three of the most characteristic and distinctive features of MCF plasma physics. These are: the cyclotron gyration of ions, which underpins their confinement; the fast Alfvén wave, which the MCI excites; and the existence of distinct minority energetic ion populations, notably fusion-born ions. The MCI can arise at frequencies such that the cyclotron frequency (and its harmonics) of the energetic ions matches the frequency of the Alfvén wave. This is a necessary, but not sufficient, condition for the MCI to occur. In addition, the velocity distribution of the energetic ion population must be sufficiently non-Maxwellian that sufficient free energy is available to be unlocked via resonant processes. The first process, identified by Belikov and Kolesnichenko in 1976 [16–18], involves wave-wave resonance between additional cyclotron harmonic modes supported by the energetic ion population, and the fast Alfvén wave. The second process [19, 20] involves wave-particle cyclotron resonance between gyrating energetic ions and the fast Alfvén wave. In general there will be a link between the spectrum of waves excited by the MCI, and the character of the velocity distribution of the energetic ions which drive the waves. Mapping between the measured ICE signal and the theoretical characteristics of the MCI-excited waves is thus essential to interpreting the physics underlying ICE observations.
The duration of the proton ICE features during KSTAR ELM crashes is brief, typically a few microseconds; see for example, figure 6 of [1] and figure 1 below. Temporal correlation between an ELM crash and the ICE phenomena observed on KSTAR [1] may be due in part to the action of the ELM in 'flushing out' particles from the edge region. Focusing on the consequences for the fusion-born proton populations in the edge region, soon after the ELM-crash, only freshly born protons close to the birth energy of 3 MeV are present; slowing-down due to collisions has not yet had time to act. The observed frequency chirping has been explained [2] in terms of rapid changes in the density of the ambient plasma in which the energetic ions are embedded, caused by ELM filament motion during the crash. The changes in density alter the spectral character of the MCI-excited waves. Hence these chirping spectral features have been used to obtain uniquely high time resolution measurements of the time-varying local plasma density. Some of the KSTAR chirping ICE features below ∼500 MHz are observed to be accompanied, after a slight time delay, by a fainter detached 'ghost' chirping feature in the higher frequency range 500 MHz to 900 MHz; see in particular figure 1. This frequency range exceeds the local lower hybrid frequency corresponding to the local plasma parameters inferred from [1]; consequently, linear cold plasma waves propagating quasi-perpendicular to the magnetic field are expected to be evanescent here, see appendix A. The question therefore arises whether the 'ghost' ICE chirping features detected in KSTAR may reflect instrumental and signal processing issues, or are a real plasma physics effect. It is important to resolve this issue, because understanding observations (if real) of radiation in this frequency range can assist understanding of the physics of energetic ion populations in magnetically confined fusion (MCF) plasmas [33].

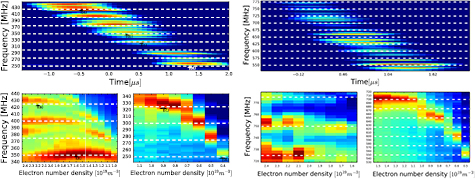
Figure 1. Temporal evolution of ICE amplitude during an ELM crash in KSTAR plasma 11513. Time t = 0 refers to the centre of a 200 μs segment of radio-frequency data. The horizontal dashed lines in the spectrogram indicate energetic proton cyclotron harmonics fcp at the low field side plasma edge. In addition to the main chirping feature ≲500 MHz ≈ discussed in [2], we also observe a second, faint ('ghost'), feature at frequencies above the lower hybrid frequency
  . This additional, spectral feature is delayed in time by approximately 1 μs with respect to the main chirping feature. Reproduced from [2]. © 2017 Culham Centre for Fusion Energy. CC BY 3.0.
Download figure:
Standard image High-resolution imageHere we show that the 'ghost' chirping ICE feature above ∼500 MHz in figure 1 is a real physical phenomenon, which is generated by strong nonlinear wave-wave coupling between different spectral peaks within the primary chirping ICE feature below ∼500 MHz. We demonstrate this by direct bicoherence analysis (see appendix B and [34–38]) of: first, the KSTAR data files for field magnitudes; and second, the fields generated from direct numerical simulations using the particle-in-cell (PIC) [39] code EPOCH [40]. We solve the self-consistent Maxwell–Lorentz system of equations for fully kinetic electrons and thermal deuterons, together with the minority ring-beam distribution of confined fusion-born 3 MeV protons that drives the primary ICE. The code retains full gyro-orbit kinetics for each of the ∼1 million macroparticles in the simulation. Full gyro-orbit kinetics are essential for capturing cyclotron harmonic resonance effects including, as we shall see, coupling between modes driven at different harmonics by collective instability. The simulations detailed in [2, 14, 23–25] are set up in slab geometry, hence they do not incorporate realistic toroidal geometry and the associated compressional Alfvén eigenmode structure [26–30]. Nevertheless this spatially localised physics approach is successful in capturing most of the observed features of ICE, including also recent results from the heliotron-stellarator LHD [31, 32]. Identification of the physics effects underlying the simulation output is assisted by the fact that, in the linear regime, the simulation approach aligns with the original slab-geometry analytical theory of the MCI. We refer to appendix C for a summary of the EPOCH PIC approach and [2] for details of the plasma parameters used in the simulations.
Bicoherence analysis techniques [34–38] are designed to capture nonlinear wave-wave coupling, and we refer to appendix B for a brief account. We show that the 'ghost' spectral features are able to exist and grow in the higher-frequency, potentially evanescent, region because they are nonlinearly driven by coupled MCI-excited waves that lie within the lower-frequency, propagating (non-evanescent), region. The 'ghost' feature thus owes its existence to both a minority suprathermal ion population - here, the confined subset of fusion-born protons that relax through the MCI [2] in KSTAR deuterium plasmas - and on the capacity of the plasma to nonlinearly couple together the modes initially driven by these protons.
2. The role of the lower hybrid frequency in the PIC simulations
In [2], a series of PIC simulations at successive neighbouring fixed values of plasma electron number density  were used to model the chirping of the primary ICE feature in figure 1. We first address the role of the lower hybrid frequency
  defined by equation (A.1), and in particular the question of evanescence for cold plasma waves at frequencies above fLH, including potentially those in the 'ghost' feature shown in figure 1.
It is well known [41] that perpendicular-propagating linear waves in a cold plasma cannot exist between the lower hybrid resonance frequency  and a cut-off frequency
  . Expressions for these frequencies, along with references to relevant literature, are given in appendix A. The results reported in [2] indeed show dependence on fLH, whereby the number of modes available for excitation decreases rapidly as the electron number density ne, and hence fLH, decreases. In figure 2, we show the results of multiple simulations of the MCI for two values of magnetic field strength B and a range of densities ne. In all of these simulations, the magnetic fields, ∼1.44 T (left panel) and ∼1.52 T (right panel), are oriented entirely along the z-axis of the simulation. That is, we restrict the study to strictly perpendicular wave propagation along the x-axis, which is the spatial domain of our 1D3V PIC simulations. The magnetic fields have been chosen to be representative of the magnetic field strength in the ICE-emitting region at the outer midplane edge of KSTAR at major radial position
  for central field strengths B0 = 1.8 T and B0 = 1.9 T respectively. The value of ne in each vertical strip in figure 2 decreases from left to right in steps of
  , with each vertical strip corresponding to an independent simulation which yields the spectrum of MCI-excited waves at the value of ne shown. The rest of the simulation parameters are those given in section 4 of [2]. In both panels, shading indicates the
  of the Fourier power in the Bz component of the simulation, and horizontal white dashed lines denote successive proton cyclotron harmonics. The white crosses, joined by a solid curved white line, denote the value of fLH at the density shown. In both panels, one can see a blue region in which the spectral power falls to zero. The boundary of this region at each value of ne lies close to the corresponding value of fLH.

Figure 2. Spectral power as a function of plasma density obtained from multiple PIC simulations for two values of magnetic field strength B = 1.44 T (left) and B = 1.52 T (right), corresponding to the nonlinear saturated phase of the MCI. Shading indicates the  of the spectral power in the
  field component of each simulation. Both panels comprise a series of simulations, each contributing a vertical strip at a different density. The white crosses, joined by a solid curved white line, denote the value of fLH at the density shown.
Download figure:
Standard image High-resolution image3. Bicoherence analysis
The signal used to generate the spectrogram shown in figure 1 was obtained during a KSTAR ELM crash using a fast radio frequency (RF) spectrometer sampling at 5 GHz. Thus the maximum resolvable (Nyquist) frequency is 2.5 GHz. These data were obtained in 200 μs segments when the RF signal amplitude exceeds a threshold voltage during KSTAR pulse operation, with the acquisition times corresponding roughly to a spike in the  signal [1]. In figure 1, t = 0 refers to the centre of a 200 μs segment of RF data. Further details of the fast RF spectrometer system and the experimental set-up are given in [1].
We first examine the extent of nonlinear wave-wave coupling within the experimental dataset that spans the primary and 'ghost' chirping ICE features in figure 1. The best quantitative evidence for this coupling, and characterisation of its magnitude as a function of wave frequency, is obtained from bispectral analysis [34–38], see also appendix B.
The bispectrum, equation (B.1), measures the extent of phase coherence due to the nonlinear coupling between three waves that satisfy the frequency and wavenumber matching criteria covered in appendix B. The bicoherence, equation (B.2), is a normalised bispectrum bounded between 0 and 1 which quantitatively measures the fraction of the Fourier power of a signal that is due to nonlinear (specifically quadratic) interaction.
Thus the bicoherence sheds light on nonlinear coupling; whereas the bispectrum yields information regarding the energy flow due to nonlinear coupling, given the wave amplitudes in the system. It is therefore useful to compute them both when diagnosing possible nonlinear wave physics. A large value of bicoherence (close to unity) may reveal waves which have significant coupling, but do not drive additional waves in practice due to their relatively low amplitudes. This becomes apparent if one supplements the information given by the bicoherence with the bispectrum, because the latter also incorporates information about relative wave amplitudes. Conversely, plotting the bispectrum alone does not necessarily yield information about the intrinsic strength of coupling between waves. Bispectral analysis has been successfully applied to the MCI [23] and experimental plasma measurements [42–44], including those in the KSTAR tokamak [45].
3.1. Bicoherence analysis of KSTAR ICE chirping data
The bicoherence and bispectrum corresponding to the entire KSTAR signal shown in figure 1 are plotted in the left and right panels respectively of figure 3. In the bicoherence panel, shading indicates the intrinsic strength of nonlinear coupling, 1 (dark red) being completely coupled and 0 (dark blue) completely uncoupled. The shading of the bispectrum panel is displayed on a logarithmic scale. Here the averages denoted by  in equation (B.2) are taken over a time window
  μs within a signal which is 5 μs long, corresponding to the data displayed in figure 1. This choice enables us to construct ten independent realisations. In consequence, the threshold for significance is comfortably below the observed coupling strength 'b' for a wide range of relevant frequencies.

Figure 3. Left: bicoherence of the observed fast RF signal displayed in figure 1, plotted as a function of frequency in MHz. The colour scale indicates intrinsic nonlinear coupling between waves with frequencies f1 and f2, which takes values between 0 and 1. There is significant coupling in three distinct regions, discusses as (i)–(iii) in section 3.1. Right: bispectrum of the same RF signal. Bicoherence measures the intrinsic strength of nonlinear wave coupling, while the bispectrum measures actual nonlinear transfer of energy, see appendix B. Colour is plotted on a log scale.
Download figure:
Standard image High-resolution imageWe note three distinct regions of strong intrinsic nonlinear wave coupling in the left panel of figure 3:
- (i)
- (ii)
 : Weaker coupling between the newly formed modes in the 'ghost' feature above MHz.
 - (iii) and : Weaker coupling between the newly formed modes in the 'ghost' feature above MHz, and modes within the main chirping feature below MHz.


We are primarily concerned with point (i), which strongly suggests the 'ghost' feature is a real plasma physics phenomenon. The right panel of figure 3 indicates why it is only waves in the frequency range below  MHz that can drive the observed 'ghost' features: these are the waves that are not only significantly nonlinearly coupled, but also have sufficiently large amplitude. The nonlinearly driven features that could in principle arise due to the strong coupling of waves described in points (ii) and (iii) would lie below the Nyquist frequency; however, they are never observed in practice because their amplitude is lower by several orders of magnitude. We note that the auto-bispectrum and auto-bicoherence of the KSTAR RF data, that is, bispectra computed from a single time series, cannot by themselves yield information on the direction of energy transfer. To do so would require two point measurements [34, 46] which at present, are not available.
3.2. Bicoherence analysis of the PIC simulation output
Having inferred from bispectral analysis of the KSTAR data that the nonlinear wave coupling between cyclotron peaks below  MHz drives the 'ghost' chirping feature, the question now arises: can the same physics be inferred from analysis of the outputs of the corresponding PIC simulations? The simulations have a propagation angle
  , for which, as noted above, the region
  is evanescent. In order to explore the hypothesis that the observed waves in this region arise from nonlinear wave coupling, let us focus on the simulations which make up the lower panels of figure 4 in [2].
Figure 4 shows the bicoherence plots along with the corresponding spatio-temporal Fourier transform of Bz for each of three different simulations in the lower panels of figure 4 in [2]. Shading indicates the  of the spectral density of the oscillatory part of the Bz field component. From left to right the simulations have electron number densities
  ,
,  , and
, and  .
.

Figure 4. Upper panels: normalised bicoherence (equation (B.2)) of the oscillatory part of the Bz field component in three PIC simulations. This is plotted as a function of wavenumber normalised to  where
where  is the Alfvén speed. From left to right the number density ne in the simulations is
  ,
,  , and
, and  . In all three plots the most significant coupling is observed between neighbouring k values near the
  boundary. Lower panels: corresponding spatio-temporal Fourier transform for the three simulations. The y-axis is plotted in units of fcp while the x-axis is plotted in units of
  . The horizontal black line denotes the lower hybrid frequency fLH for each simulation. In addition to the expected cold plasma waves below fLH, spectrally intense regions above fLH can be seen in the range of frequencies corresponding to the observed 'ghost' feature in figure 1.
Download figure:
Standard image High-resolution imageAll other plasma parameters remain identical and are specified in [2]. In the lower panels, the y-axis is plotted in units of proton cyclotron frequency fcp, while the x-axis is plotted in units of  where VA is the Alfvén speed. The value of VA differs significantly between the simulations because it is inversely proportional to the square root of the majority ion (deuteron) mass density, and hence to ne. The horizontal black line denotes fLH, below which we see excitation of the fast Alfvén wave with resonances at consecutive proton cyclotron harmonics, characteristic of the MCI [2, 14, 23–25] which underpins ICE. Above fLH there are several weaker but significant spectrally intense regions. The location of these regions in
  space is at positions
  such that
  and
and  where
where  and
and  are the locations of strong resonances on the fast Alfvén branch below fLH. This condition for wave-wave coupling is necessary for conservation of momentum and energy [34]. We also note that the most dominant nonlinear spectral features above
  move to increasingly high values of normalised k as density increases.
If the spectrally dense regions with co-ordinates  above fLH are indeed the result of wave-wave coupling between modes below fLH, this should be borne out by bicoherence analysis of the simulated field component Bz. The corresponding bicoherence plot for each simulation is shown in the upper panels in figure 4. These plots show clearly defined sets of (k1, k2) pairs which have strong coupling, the most striking of which are near the
  (and hence
  ) boundary. These are modes close to each other in k space on the fast Alfvén branch. If we pick a region of strong coupling near the
  boundary for the upper leftmost panel, say
  and
and  , and read off the corresponding
  and
and  , then we should be able to see a spectrally dense region at
  and
and  in the lower leftmost plot above the
  line. This is indeed the case, and a similar correspondence is seen across all panels of figure 4.
Bicoherence analysis of both experimental data (figure 3) and simulation outputs (figure 4) thus demonstrates strong coupling between modes near the  boundary below fLH. This supports our conjecture that nonlinear coupling is responsible for the faint spectral 'ghost' feature in figure 1, since this is also captured by our simulations. This lends further credence to our interpretation in [2] that the downward ICE chirping is due to declining local plasma density, which is perhaps associated with the motion of an ELM filament.
4. Density dependence of downward chirping
Let us now investigate in greater depth the hypothesis that the local decline of density on submicrosecond timescales may be responsible for the downward chirping characteristics of the 'ghost' ICE feature in figure 1. Due to the abundance of waves in the simulation there are many spectrally dense regions in the  regions in figure 4. Accordingly, we adapt and extend the technique which was previously applied in [2] to ICE chirping at frequencies less than fLH in KSTAR. Key to this approach is analysis of the spectral properties of multiple PIC simulations, each of which is run into the nonlinear regime of the MCI at different, fixed, neighbouring values of ne.
- (1)
- (2)
- (3)From this simulation, the range of values of k1 and k2 corresponding to f1 and f2 is selected. We refer to a range of values because of the finite resolution of the simulation in both wavevector and frequency space.
- (4)This range of k1 and k2 then defines the minimum and maximum values of k3 which correspond to the f3 observed in figure 1.
- (5)The spectral power as a function of frequency shown in a given vertical strip in the lower right panel of figure 5 is then obtained by integrating and averaging between the minimum and maximum possible values of k3.
- (6)As there is a one-to-one mapping between k1 and f1, and between k2 and f2, there is an approximate one-to-one mapping between k3 and f3. Therefore the spectral power in k3 corresponds to the power in the vicinity of f3.


Figure 5. Left panels: reproduction of figure 5 of [2]. © 2017 Culham Centre for Fusion Energy. CC BY 3.0. Right, top panel: expanded view of the upper region of figure 1 in which  . Right, lower panels: chirping is apparent in frequency versus number density plots for the nonlinear stage of MCI simulations. Shading indicates the
  of the spectral power in the fluctuating part of the Bz field component of each simulation.
Download figure:
Standard image High-resolution image
Figure 4 of [2] is reproduced here as the left set of panels in figure 5. In the lower panels of figure 5, the spectral power in the output of multiple simulations is plotted as a function of frequency and ne, and compared with the experimental RF spectrum (upper left panel). The mapping between near-identical spectral features in the experimental data and the simulation outputs was used in [2] to infer the time-dependence of local density. The range of values of ne shown reflect Thomson scattering measurements in the edge pedestal (see the last paragraph of section 3 in [1]. If the faint chirping features in figure 1 are a result of wave-wave interactions between modes with  , driven by the MCI at different densities, we expect the spectral power of the newly formed modes with
  to exhibit a similar dependence on frequency and electron number density. To this end, the power in these modes for each simulation has been calculated, and the results are shown in the right panels of figure 5. For comparison purposes, figure 4 of [2] is reproduced as the left panel of figure 5. The procedure is as follows:
The lower left and lower right panels in figure 5 have much in common. First, in each case the dominant spectral features of the simulations chirp down in frequency as electron number density decreases. Second, the density values over which this occurs declines from the pre-crash pedestal density to much smaller values, in both cases.
5. Conclusions
The 'ghost' ICE feature in figure 1 is a real plasma physics phenomenon. Its existence is due to a combination of energetic particle physics with linear and nonlinear wave physics, which is so far observed only in KSTAR tokamak plasmas. The entire phenomenology underpinning the 'ghost' unfolds on sub-microsecond timescales during an ELM crash, and the frequency chirping reflects declining local deuterium plasma density. This density evolution changes the plasma environment of the 3 MeV fusion-born protons which drive the ICE through collective relaxation by the magnetoacoustic cyclotron instability (MCI), resulting in fast evolution of the spectral distribution of energy in the excited fields. Here we have shown that the separate, fainter ('ghost') chirping ICE feature observed in the frequency range 500 MHz  to 900 MHz
  is driven by nonlinear wave coupling between different neighbouring cyclotron harmonic peaks in the main ICE feature below 500 MHz. This is evident from bispectral analysis of: first, the measured KSTAR fields, where we benefit from exceptionally high (up to 20 GS s−1) sampling rates; and second, field amplitudes output from first principles particle-in-cell code simulations of the KSTAR fusion-born proton relaxation scenario. This reinforces the MCI interpretation of chirping proton ICE in KSTAR [2]. It also provides a novel demonstration of nonlinear wave coupling on very fast timescales in a tokamak plasma.
The successful interpretation of this unexpected phenomenon spontaneously driven by fusion-born ions, helps establish interpretive capability for ICE from future deuterium-tritium plasmas in JET and ITER. Modelling of the plasma physics underlying ICE signals yields information on two key features of the ICE-emitting energetic ion population. First, the values of key parameters, notably the ratio of the characteristic perpendicular velocity of the energetic ions to the local Alfvén speed. This needs to be of order unity [16–28]. Second, the structure of the distribution of the energetic ions in velocity space, which needs to be strongly non-Maxwellian in order to excite the MCI which underlies ICE. A drifting ring distribution, i.e. the product of two delta-functions in parallel and perpendicular velocity, has been found to be the best few-parameter way of capturing this structure for ICE applications. This approximation has proven fruitful across more than two decades, spanning ICE measurements from deuterium-tritium plasmas in JET [11] and TFTR [12] during the mid-1990s to the most recent measurements reported from ASDEX-Upgrade in 2014 [8] and JT-60U in 2017 [13]. The new results presented here confirm the fidelity of the output of first principles PIC simulations in relation to measured ICE signals, alongside the validity of the model for ICE that is implemented in the PIC code. The agreement between the bispectral analysis of the simulation outputs and the observations of an unexpected, strongly nonlinear, transient ICE feature provides fresh validation of the ICE model, in a challenging regime. ICE is also of interest in that, stimulated by the external application of finite amplitude ICRF waves, ICE physics could contribute [47] to 'alpha-channelling'—the rapid inward transfer of energy from fusion-born ions to the bulk plasma.
Acknowledgments
The authors thank J.W.S. Cook, S.W.A. Irvine, and B. Hnat for discussions. This project used the EPOCH code, part funded by UK EPSRC grants EP/G054950/1, EP/G056803/1, EP/G055165/1 and EP/ M022463/1. This work received funding from the RCUK Energy Programme [grant number EP/P012450/1], Euratom, and the National Research Foundation of Korea [grant number 2017M1A7A1A03064231]. S.C.C acknowledges a Fulbright–Lloyd's of London Scholarship and AFOSR grant FA9550-17-1-0054. The views and opinions expressed herein do not necessarily reflect those of the European Commission.
Appendix A
For strictly perpendicular propagation in the cold plasma limit, the lower hybrid frequency is given by
when  . Here
  is the ion plasma frequency and
  and
and  are the ion and electron cyclotron frequency respectively. See figure 4.4 of [48] for a helpful diagram.
For perpendicular propagation  defines a resonance frequency. Along with
this defines a region of evanescence, that is, waves with frequency  cannot propagate. We note that the preceding statement only applies strictly to electrostatic, cold, linear, perpendicularly propagating waves.
Appendix B
There is extensive literature which describes higher order spectral techniques including bispectral analysis. For general information see [34–37] and for plasma-specific applications see, for example, [37, 42–45]. An early account of the application of higher order spectral techniques to plasma physics is given in [38].
Any three waves interacting nonlinearly must satisfy, to good approximation, the frequency and wavenumber matching conditions:

where the subscript '3' denotes the highest frequency wave. To measure the amount of phase coherence between three modes that obey the above resonance conditions, one can compute the bispectrum. Defining F(f1) as the complex Fourier transform of a quantity (for instance an electromagnetic field component) at frequency f = f1, and  as its conjugate, the bispectrum is defined as:

where  and the brackets
  denote averaging over time.
One can normalise the bispectrum to obtain the bicoherence. This can be done in several ways [34, 49], one of which is to use Schwartz's inequality:
Setting the denominator of equation (B.2) to unity yields equation (B.1).
The bicoherence defined by equation (B.2) measures the strength of nonlinear wave coupling only, whereas equation (B.1) measures the strength of nonlinear energy flow. Bispectral analysis has been successfully applied to the MCI [23] and experimental plasma measurements [42–44], including those in the KSTAR tokamak [45].
Appendix C
Particle-in-cell (PIC) codes [39] self-consistently evolve the fully relativistic dynamics of very large numbers of particles, combined with electric and magnetic fields, according to the full set of Maxewell's equations and the relativistic Lorentz force law:

where  are the electric field, magnetic field, and current vectors;
  are the charge density and particle charge, and
  are the velocity and momentum vectors respectively. The electric and magnetic fields are evolved on a grid using a finite difference scheme, and the 'Boris' [39] scheme is used to evolve the relativistic particle trajectories. In the PIC simulations reported here and in [2], we initialise the thermal electron and majority deuteron populations as Maxwellian. The perpendicular velocity component of the minority fusion-born protons on deeply passing orbits that drive the ICE, corresponding to perpendicular energy 150 keV [2], is initialised as a ring distribution in velocity space.