


Abstract
The motion and temperature evolution of beryllium droplets produced by first wall surface melting after ITER major disruptions and vertical displacement events mitigated during the current quench are simulated by the MIGRAINe dust dynamics code. These simulations employ an updated physical model which addresses droplet-plasma interaction in ITER-relevant regimes characterized by magnetized electron collection and thin-sheath ion collection, as well as electron emission processes induced by electron and high-Z ion impacts. The disruption scenarios have been implemented from DINA simulations of the time-evolving plasma parameters, while the droplet injection points are set to the first-wall locations expected to receive the highest thermal quench heat flux according to field line tracing studies. The droplet size, speed and ejection angle are varied within the range of currently available experimental and theoretical constraints, and the final quantities of interest are obtained by weighting single-trajectory output with different size and speed distributions. Detailed estimates of droplet solidification into dust grains and their subsequent deposition in the vessel are obtained. For representative distributions of the droplet injection parameters, the results indicate that at most a few percents of the beryllium mass initially injected is converted into solid dust, while the remaining mass either vaporizes or forms liquid splashes on the wall. Simulated in-vessel spatial distributions are also provided for the surviving dust, with the aim of providing guidance for planned dust diagnostic, retrieval and clean-up systems on ITER.
Export citation and abstract BibTeX RIS

Original content from this work may be used under the terms of the Creative Commons Attribution 3.0 licence. Any further distribution of this work must maintain attribution to the author(s) and the title of the work, journal citation and DOI.
1. Introduction
Dust generated during plasma operation in the ITER nuclear phases will be activated, tritiated, chemically reactive, and toxic. For these reasons, the ITER Licensing agreement requires that the quantity of dust in the vacuum vessel must remain below given limits [1–4]. The maximum amount of mobilizable dust in the vessel is 1000 kg. A second limit is imposed by the chemical reactivity of dust in the event of an accidental ingress of air and water into the vessel. If sufficient quantities of dust are lying on hot plasma-facing component (PFC) surfaces, hydrogen produced by dust-steam reactions may present a risk of explosion. In the case of beryllium (Be), the main chamber PFC material in ITER and the main concern of this paper, a limit of 11 kg of hot dust is set by safety considerations [1, 4].
Whereas dust formation in present-day devices is mostly attributed to the flaking of re-deposited layers, the high stored energies of ITER plasmas imply that significant quantities of hot metallic particles may be produced from PFC surface melting caused by energetic transients [4]. In particular, as a consequence of the low mass and melting point of Be, material ejected from regions of the Be first wall subject to disruption-induced transient melting is expected to be a significant contributor to the overall dust production in ITER [4, 5]. This can be caused by several mechanisms such as spraying due to the explosion of vapour bubbles inside the liquid, or splashing due to hydrodynamic instabilities [6]. Droplet/particle ejection has been studied experimentally in disruption simulation experiments performed in plasma guns with tungsten surfaces (e.g. [7, 8]) and more recently with Be (e.g. [9, 10]), although the plasma pressure during those experiments is 1–2 orders of magitude higher than expected during ITER transients. Beryllium particulate ejection has also been observed as a result of disruptions in JET equipped with its ITER-Like Wall, illustrating that even at comparatively low stored energies, Be melting can and does occur [11]. Post-mortem examination of in-vessel surfaces and of PFCs extracted from the machine clearly show the presence of re-solidified droplets in the vicinity of melted regions (similar observations have also been made on molybdenum tiles in Alcator C-Mod [12]).
Previous dust studies for ITER have mainly focused on the penetration of tungsten (W) dust injected from the divertor region into the core and its impact on the steady-state plasma in terms of reactor performance [13, 14]. On the other hand, provisional estimates on the number of transient events that can be tolerated while maintaining the dust inventory below permitted limits have been obtained by making the rather crude assumptions that a given fraction (e.g. 25%) of the molten material is removed, that it is converted into dust and survives as such until the next discharge [4]. Aiming at a more detailed analysis, one may distinguish a droplet production factor quantifying the fraction of the molten material that is ejected as droplets, and a dust conversion factor quantifying the fraction of these droplets which solidify into dust particles.
The purpose of this paper is to provide more refined estimates of the dust conversion factor by studying the cooling of droplets ejected from molten Be surfaces during major disruptions (MD) and vertical displacement events (VDE) with delayed mitigation. In these scenarios, the thermal quench (TQ) is unmitigated and causes melting with possible subsequent droplet ejection. The disruption is only detected after the TQ and injection of neon (Ne) will mitigate the current quench (CQ) phase. Besides fully mitigated disruptions, these events are expected to be the most frequent and are thus the most relevant for dust formation. As a consequence of the high expected electromagnetic loads, the occurrence of fully unmitigated disruptions at high plasma current must be limited to a few events only and are therefore not addressed here.
The problem of droplet survival in ITER disruption scenarios implies that dust-plasma interactions in the large droplet regime must be addressed, where electrons are magnetized with respect to the droplet size and ions are collected under thin-sheath conditions. In this regime, the validity of the widely employed orbital motion limited (OML) framework [15–18] is strongly violated, leading to order-of-magnitude errors in the predictions of droplet charging and heating [19]. Moreover, the presence of highly charged ions from the impurity species, introduced by the disruption mitigation system, requires the inclusion of ion-induced emission processes, which are typically of little concern in standard scenarios with singly charged hydrogenic ions [20].
Simulations of droplet cooling and transport are carried out using the MIGRAINe code [19, 21], which implements updated dust-plasma interaction models specifically developed to take into account the non-OML particle and heat flux collection regime, as well as to incorporate surface processes relevant for Be exposed to high-energy electrons and highly charged Ne ions. Furthermore, MIGRAINe's detailed dust-wall collisions model [21, 22] is employed to predict the spatial redistribution of solid dust in the plasma chamber. Droplet injection points are set at locations on the first wall receiving the highest heat flux during the TQ while the particle size, speed and injection angle are varied within the range of currently available experimental and theoretical constraints. Final quantities of interest are obtained by weighting single-trajectory outputs with different size and speed distributions. The results are then analyzed to determine the amount of injected Be susceptible to re-solidify into dust and to localize the preferred accumulation sites of the resulting particles. Detailed information on the spatial distributions can also be used to recover estimates of the total dust inventory from local diagnostics.
2. Simulation layout and analysis method
2.1. Plasma scenarios
The scenarios implemented in MIGRAINe are based on DINA simulations [23] of ITER disruptions, which provide the time evolution of the plasma electron density ne, temperature  , neon density nNe, effective charge number Zeff and shape as it collapses, see figures 1 and 2. The simulations are run with a uniform, constant toroidal magnetic field of 6 T. The plasma is assumed to occupy the interior of its moving boundary uniformly, while the vessel volume outside the boundary is assumed to be filled with a uniform neutral gas thermalized with the actively cooled first wall at
  K. The gas composition is given by a constant density of D2 molecules at
  , matching the initial density of D ions in the plasma, plus Ne atoms whose density equals that of Ne ions in the plasma. No Be impurities, atomic or ionic, are present in the simulations. Moreover, no macroscopic plasma flows are considered, implying that the Be droplets are not subject to the ion drag force—the potential effects of the ion drag on the results of this paper are discussed in section 3.1.

Figure 1. Time profiles of the plasma properties used in the simulations. These are essentially identical for the MD and VDE scenarios. Vertical dashed lines indicate the thermal quench (TQ) and the onset of massive Ne injection.
Download figure:
Standard image High-resolution image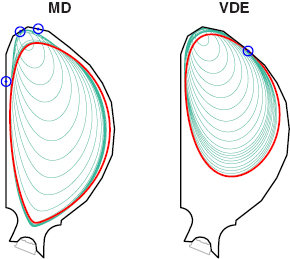
Figure 2. Time evolution of the plasma boundary in the MD and VDE scenarios. The bold red contour indicates the plasma boundary at the thermal quench, green contours are plotted every 4 ms afterwards. The bold black contour represents the wall geometry used in the simulations, which excludes the region below the dome, outlined in grey. The droplet injection points are figured in blue.
Download figure:
Standard image High-resolution imageSince DINA output does not distinguish between the different charge states of Ne ions, these are gathered into an average ion population with non-integer charge state ZNe, calculated from the given values of ne, nNe and Zeff and the quasi-neutrality condition:


These equations are also used to produce a consistent value of the D ion density nD. All physical properties depending on the charge number of Ne ions (e.g. the ion-induced emission yields) are linearly interpolated between integer charge states.
While the shape of the plasma boundary differs significantly between the MD and VDE scenarios (figure 2), the time-evolving plasma properties behave rather similarly. In particular, two main stages can be identified as indicated in figure 1. The first stage starts at the TQ and lasts until the massive Ne injection. It is characterized by an initial drop in Te to ∼20 eV. Since only a single impurity species could be included in these DINA simulations, it was decided to account for the Be radiation after the TQ using a small quantity of Ne to achieve CQ rates similar to those expected as a result of the Be influx resulting from plasma-wall interaction at the TQ. In reality, the plasma control system would detect the TQ, or the start of the CQ and would activate the disruption mitigation system (DMS). After a delay caused by the time of flight in the DMS delivery tube, a large Ne quantity would arrive in the plasma, marking the start of the second stage with even lower electron temperature around 10 eV and a faster decay of the plasma current.
2.2. Droplet injection scheme and post-treatment
For each scenario, droplets are injected from the locations on the first wall which receive the highest heat flux during the TQ. In the case of the VDE scenario, this corresponds simply to the contact point between the plasma and the wall. For the MD scenario, in which the plasma quenches in place and does not enter in contact with the wall until later times, three locations have been identified from field-line tracing. In all cases, droplets are injected over a 3 ms duration following the TQ onset, and a parameter scan is performed on their initial radius and velocity.
Although numerical modelling of metallic melt layer dynamics under ITER-relevant conditions is available [8, 24–26], to our knowledge, no experimental validations currently exist regarding the size, speed and angle distributions of the Be droplets which may be ejected from the melt layers. Experimental observations of Be PFC exposure to VDEs in JET [27, 28] suggest a droplet size of the order of a few μm, but the extrapolation of these results to ITER is uncertain due to the upscaling of plasma energy. More detailed experiments on W droplets in plasma guns report typical sizes of several tens of μm [29–34] and most probable ejection speeds of a few  , which are expected to increase by a factor
  3 in the case of Be due to the main scaling with mass density [8, 24, 30, 31, 33, 35]. Given these uncertainties, the choice is made here to scan a wide enough range of droplet characteristics so as to capture the influence of these parameters and draw generic conclusions on droplet cooling. More specifically, the initial droplet radius is varied between 10 μm and 150 μm and the initial droplet velocity between
  and
and  , sampling the whole range of possible injection angles. Roughly 425 000 particles are simulated for the VDE scenario and 640 000 for the MD scenario, the difference being due to the multiple injection points and a looser sampling of the initial droplet size in the MD runs. The initial droplet temperature is fixed at 1561 K, just above the melting point of Be; test simulations have been performed to confirm that the results depend weakly on the initial temperature. This is due to the fact that the droplets are rapidly (typically within 1 ms) heated up to the strong vaporization regime, in which the droplet temperature reaches a quasi-steady state depending essentially on the background plasma parameters.
The trajectory of each individual droplet is simulated until it meets one of the following termination conditions: (i) the droplet mass reaches zero, corresponding to total vaporization; (ii) the droplet collides with the wall while still liquid; (iii) the droplet solidifies into dust and collides with the wall at a velocity below the sticking threshold (see section 4.2 for details on bouncing and sticking impacts). When a trajectory terminates, the final position, size, mass and state (solid or liquid) of the Be particle are stored, ultimately producing a map between initial and final conditions. All global quantitative results, e.g. the total mass re-solidified into dust, are calculated by weighting the initial conditions according to given probability distributions (see section 5 for the results).
2.3. Choice of initial size and speed distributions
Due to the numerous uncertainties of available predictions regarding the size and velocity distributions of Be droplets potentially produced by melt splashing during disruptions, all the following results have been obtained by choosing examples of 'reasonable' distributions, and hence would be modified if alternative distributions are used. Following [8], we assume the droplets are spherical and use upper-limit lognormal (ULLN) distributions for the initial radius and speed,
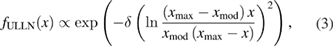
where x varies between 0 and xmax, xmod is the mode and δ is a shape parameter fixed at  . For the simulations, three different modes are chosen, favouring either 'small' (
 ), 'medium' (
 ) or 'large' (
 ) values, as detailed in figure 3. It is important to note that, despite our choice of terminology, ULLN probability density functions decay to zero at both ends of their domain, implying in particular that a uniform distribution will always produce more extremal values.

Figure 3. Upper-limit lognormal probability density functions (see equation (3)) for the three modal values selected in this study. Note that the uniform distribution, shown by the horizontal dashed line, is more likely to produce values near the boundaries of the sampling domain.
Download figure:
Standard image High-resolution imageAlthough the quantitative results reported in this paper are contingent on the choice of appropriate distributions for the initial size and speed of the injected droplets, they can be used to deepen the understanding of dust accumulation in ITER. Moreover, the raw output data obtained from MIGRAINe contains detailed information on every set of initial conditions used in the simulations, and can therefore be re-used with different injection distributions as further research effort is devoted to melt layer dynamics during high-energy transients.
3. Droplet charging and heating in the plasma
The main formalism used to quantify the currents and heat fluxes driving the variations of the droplet potential and temperature is described in detail in [21]. Here, we repeat only the basic equations and focus mainly on the parts of the MIGRAINe model which have been subject to recent updates for the calculations described in this paper.
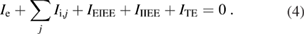
The physical processes involved in droplet charging are the collection of plasma species (electrons, denoted by a subscript 'e', and ions, denoted by a subscript 'i' and an index j running over all ionic species), electron- and ion-induced electron emission (EIEE and IIEE), and thermionic emission (TE). The droplet potential is dictated by the floating condition, namely that the total net current to the droplet is zero:
In addition to the processes mentioned above, droplet heating is influenced by ion backscattering (superscript 'bs'), ion surface neutralization (superscript 'neut'), gray-body thermal radiation (subscript 'rad'), and vaporization (subscript 'vap'). By including all the associated heating powers, the generic form of the droplet heating equation gives the time variation of the dust enthalpy Hd as
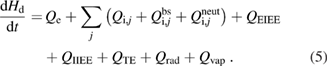
For the sake of completeness, note that equations (4) and (5) are coupled through the droplet potential, and that the collection terms Qe and  in equation (5) include both the kinetic energy of the collected plasma particles and their binding energy, namely the work function for the electrons and the surface binding energy for the ions.
3.1. Collection of plasma species
The widely used OML formulae for electron and ion collection cannot be applied to droplets whose sizes are large with respect to the electron Debye length  and Larmor radius RLe, both of which lie in the range 1–10 μm for the plasma conditions of the disruptions considered here. For this reason, MIGRAINe simulations were run using an updated collection model which targets dense magnetized plasmas in the regime
  , with Rd the dust/droplet radius, and is described extensively in [19]. Electron collection is based on a fluid model version of Sanmartin's kinetic model [36, 37], which first demonstrated the existence of a potential hill structure along the magnetic flux tube intersecting the collecting body and explored the transition between OML-like exponential dependences at large negative droplet potentials and Bohm's electron saturation for positive potentials [38]. Ion collection is treated in the thin-sheath regime, in which finite sheath thickness is accounted for by combining theoretical work by Lam [39] and numerical simulations by Laframboise [40].
Compared to OML theory, this new model predicts a drastic reduction of the collected currents and heat fluxes, owing mainly to the suppression of electron transport across the magnetic field and leading to enhanced droplet survivability. Moreover, it features a weaker coupling between droplet charging and heating due to the absence of the characteristic exponential behaviour of OML electron fluxes with respect to the floating potential. This latter point is particularly beneficial in the context of predictive studies since it implies that the simulation results are more robust to the numerous uncertainties in the treatment of plasma-surface interaction processes, which arise not only from experimental data, but also from insufficient theoretical knowledge of the particle velocity distributions in the vicinity of the droplet surface. These are indeed necessary to quantify heating and particle-induced emission. To maintain consistency with the approach adopted in [19], in order to estimate collection heat fluxes we assume by default that the collected particles are Maxwellian in energy. As for the angle of incidence with respect to the dust surface normal, no such standard hypothesis exists and ad hoc decisions are guided by a need for simplicity and the quality of the available data. Here, the OML-like sine distribution is assumed for impinging electrons, with an upper cut-off at  to avoid the need of special fitting formulas for electron-induced electron emission at grazing angles. For impinging ions, no experimental data for multiply charged ions exists in the relevant energy range and a representative angle of
  is chosen. This choice is made by considering a simplified thin sheath model in which the sheath acceleration is included as a shift of the unperturbed ion Maxwellian distribution by a constant normal velocity component equal to the ion thermal speed. This results in a roughly symmetric impact angle distribution with a peak at ∼
 and an upper cut-off at ∼
 . The increase of the representative angle, from the expected
  peak to
  , is meant to account for the fact that ion-related surface processes are significantly stronger for grazing impact angles.
Let us finally consider the ion drag force, which is ignored in the simulations since the flow velocity of the disrupting plasma is not known from DINA simulations. In the thin sheath regime, momentum transfer from orbital ion collisions can be neglected so that only collected ions contribute to the drag force [41]. Numerical estimates using the plasma properties considered in this study indicate that a flow velocity  would change the velocity of a
  m radius droplet by 1 m
  over a duration
  ms. To first order, this velocity change scales as
  , so that a significant effect can be expected only for small droplets injected with low velocities. In the absence of a detailed flow velocity profile, this effect can be incorporated into the existing data by affecting different weights to the initial droplet parameters, mimicking the expected changes in velocity.
3.2. Updates of plasma-surface interactions
MIGRAINe features state-of-the-art analytical formulae for all aspects of electron-surface and ion-surface interactions relevant for fusion edge plasmas [21]. Several updates have recently been introduced in the description of plasma-surface interactions with respect to [21], some specifically for the purposes of the study described here. The focus has been on providing a more accurate description of some processes as well as the incorporation of new processes unique to post-disruptive plasmas.
Electron-induced electron emission (EIEE) can be theoretically split into three distinct processes [42]: (i) secondary electron emission, in which the emitted electrons were initially bound in the material; (ii) inelastic electron backscattering, in which primary electrons are backscattered in the interior of the material; (iii) quasi-elastic electron reflection, in which primary electrons are reflected by the material's surface potential barrier. This separation is imposed by the different energy distributions of the emitted electrons which imply varying contributions per ejected electron to material cooling. Experimentally, these three groups of emitted electrons can only be clearly distinguished when the kinetic energy of the primary electrons exceeds ∼100 eV. For lower incident energies, the emitted energy distributions strongly overlap, making any distinction impossible, especially below ∼50 eV where quasi-elastic electron reflection becomes significant [43].
Unfortunately, there are no reliable EIEE yield measurements for Be below 100 eV [44]. For this reason, in the previous MIGRAINe version [21], the EIEE yield was given by the sum of the secondary electron yield and the electron backscattering yield (both following accurate semi-empirical formulas for the energy and incident angle dependence [45, 46]), and was extrapolated down to zero below 100 eV, since low-energy electron reflection was neglected. More reasonable extrapolations are viable by exploring the common tendencies revealed by low energy EIEE measurements for other polycrystalline low-Z metals [42]. These suggest a linear increase from  at zero incident energy. Therefore, in the updated MIGRAINe version, the EIEE yield is described by the standard secondary and backscattering formulas above 40 eV and is then linearly extrapolated down to 0.1 at zero energy. Approximate schemes have also been implemented in MIGRAINe for the description of the average emitted electron energies and the angular yield dependence in the 0–40 eV range. The resulting yields for the EIEE current, after integration over the incident electron distribution, are plotted in figure 4(a) as a function of Te.

Figure 4. (a) Integrated electron-induced electron emission yields of Be as a function of the background electron temperature. Quasi-elastic reflection refers to any electron emission induced by a primary with a normal impact energy below 40 eV. (b) Integrated ion-induced electron emission yields of Ne ions impinging on Be as a function of the background ion temperature.
Download figure:
Standard image High-resolution imageIon-induced electron emission (IIEE) can be theoretically split into two distinct processes [47, 48]: (i) kinetic electron emission quantified by a yield  , which is the ionic counterpart of secondary electron emission, where the energy required for the bound electron excitation is provided by the kinetic energy of the impinging ions; (ii) potential electron emission quantified by a yield
  , where the energy required for the bound electron excitation is provided by the potential energy released during the neutralization of the impinging ions. There is an incident energy threshold
  below which kinetic electron emission cannot occur. Simple theoretical estimates [49, 50] lead to
  eV
eV  for arbitrary ions of mass mi incident on Be, which indicates that this process is typically not dominant for fusion plasmas. Similarly, there is an ionization energy threshold below which potential electron emission cannot occur. Simple theoretical estimates [50, 51] lead to approximately 10 eV for arbitrary ions incident on Be, which indicates that this process is not relevant for hydrogenic ions but can be significant for noble gas ions.
It is worth emphasizing that potential emission yields are monotonically increasing functions of the stored internal energy [52, 53] and can be particularly high for multiply charged ions. In the plasma environment of interest in this study, potential electron emission needs to be considered for  , since the respective yield should already exceed unity for q = 3. In the absence of first-principle models, experimental IIEE yields are typically fitted by semi-empirical analytical expressions. In cases in which measurements for
  are unavailable, experimental results
  are adopted [54], since the yields can be expected to be close due to the similar work functions and valence band widths of the two metals. MIGRAINe implements analytical fits for each charge state to analytical expressions capable of quantifying both Auger and auto-ionization contributions to the yield [55], see also figure 4(b). Potential emission is assumed to depend only on the normal energy component, while a secant dependence is adopted for kinetic emission [55]:
where E is the incident energy and θ is the incidence angle with respect to the surface normal. Concerning the energy distribution of emitted electrons, whose knowledge is necessary to estimate the resulting droplet cooling, for  it is assumed to be parabolic between 0 and the maximum energy consistent with the Auger neutralization processes [56], i.e.
  eV, where
  denotes the first ionization energy of Ne and Wf is the work function of Be. For multiply-charged Ne ions, the change in the energy distribution is expected to be small due to the multi-step nature of neutralization; experimental results suggest an increase in the average energy by 1–3 eV per elementary charge step [57].
The MIGRAINe treatment of energy release due to ion surface neutralization [21] has also been updated and generalized for multiply charged ions. In common with other modelling studies [58], a 100% neutralization probability is assumed for both absorbed and backscattered ions, resulting in a transfer of the ionization potential energy to the dust/droplet as heat. For each electron tunneling event, an amount of energy equal to the work function is expended in the re-equilibration of the valence band. Therefore, the total heat absorbed per impinging ion with charge number Zi is given by  regardless of whether recombination is realized via resonant neutralization or Auger neutralization. Ionization and stored energies for Ne ions are given in table 1.
Table 1. Ionization and stored energies of Ne ions for all charge states involved in the simulations [59].
| Zi | 1 | 2 | 3 | 4 | 5 | 6 | 7 | 8 |
|---|---|---|---|---|---|---|---|---|
| Ionization energy (eV) | 21.6 | 40.9 | 63.4 | 97.1 | 126 | 158 | 207 | 239 |
| Stored energy (eV) | 21.6 | 62.5 | 126 | 223 | 349 | 507 | 715 | 954 |
The treatment of physical sputtering has been extended to include impurities to be used in ITER for both divertor target heat load dissipation and disruption mitigation (N, Ne, Ar), with energies up to 10 keV. The Eckstein and Preuss empirical formulas for the energy and angular dependence are still followed [60, 61]. The energy dependent empirical parameters  ,
,  and
and  are described by sums of polynomial-exponential functions determined by least-square fits to the values tabulated in [60]. The contribution of chemically assisted physical sputtering (CAPS) is not considered because of the elevated dust/droplet temperatures [62, 63]. The hydrogenic content in the dust grains can always be expected to be low enough due to thermal desorption and CAPS should already be negligible from 800 K [63, 64].
3.3. Model accuracy
The updated MIGRAINe code [19] employed in this work accounts for major modifications of the collected fluxes in the regime of magnetized electrons and thin-sheath ions. The surface processes have been treated as consistently as possible within the restrictions from available data, as discussed in depth in the previous sections. Thus, the main remaining issue is the magnetization of the emitted electrons.
For metal surfaces at elevated temperatures thermionic emission fluxes can reach very high values compared to the incoming electron fluxes, so that a virtual cathode [65] is formed. In magnetized plasmas, the presence of a non-monotonic potential combined with gyromotion prohibits self-consistent analytical treatment and imposes numerical approaches, see e.g. [58]. In contrast to W, for Be thermionic emission is negligible (see values in table 2) due to its low melting point, high work function, and the exponential behaviour of the Richardson current. Hence we need to address only EIEE whose total yield is 0.7 at most and down to 0.1 at lower electron energies, as shown in figure 4(a). For such low to modest yields, the formation of a virtual cathode is not expected and return currents due to the magnetic field can be roughly estimated following [66, 67] for planar geometries. In the absence of an electric field, integration over angles for spherical geometry results in a global suppression of electron emission by 60%–70% compared to the unimpeded value. Such a modification of the emission will not have any drastic effect in the charging and heating since the dependence of the incoming electron current on the potential is much weaker than the sharp exponential behavior of the OML current, hence greatly reducing the sensitivity of the floating potential to the emission fluxes [19].
Table 2. Relative importance of the various physical processes in droplet charging and heating in the plasma, before and after massive Ne injection. For each process, the sign is that of the corresponding term in equations (4) and (5). The numbers quantify approximately the contribution, in percents, to the total current or heat flux of the same sign. For example, the first line of the table indicates that electron collection is the only source of negative currents—and hence has a 100% contribution to negative charging—and roughly accounts for 35% to 50% of the gross positive heat flux, defined as the sum of the heat fluxes linked to electron collection, D collection, Ne collection, D neutralization and Ne neutralization.
| Charging (%) | Heating (%) | |||||
|---|---|---|---|---|---|---|
| Sign | Before | After | Sign | Before | After | |
| Electron collection | − | 100 | 100 | + | 40–50 | 35 |
| D collection | + | 50–75 | 60–75 | + | 45–50 | 35 |
| Ne collection | + |  1 1 |
10–15 | + |  1 1 |
5 |
| EIEE | + | 25–50 | 10–15 | − | 5–10 | 5 |
| IIEE | + |  1 1 |
5–10 | − |  1 1 |
1 |
| Thermionic emission | + |  1 1 |
 1 1 |
− |  1 1 |
 1 1 |
| D neutralization | + | 1–5 | 10–15 | |||
| Ne neutralization | + |  1 1 |
10–15 | |||
| D backscattering | − | 1–5 | 10 | |||
| Ne backscattering | − |  1 1 |
 1 1 |
|||
| Thermal radiation | − |  1 1 |
 1 1 |
|||
| Vaporization | − | 80–90 | 80–90 | |||
4. Heat balance outside the plasma and mechanical collisions
4.1. Cooling by the neutral gas background
Once a given droplet leaves the plasma region, the simulations are greatly simplified since charging mechanisms are absent and the droplet temperature is affected only by three cooling processes: gray-body thermal radiation, convective heat transfer with the surrounding gas and vaporization. The heating equation then reads
Whereas radiation and vaporization cooling are already present while the droplet is inside the plasma boundary, cooling by the neutral gas is a new term, written as
where Td and Tg are the temperatures of the droplet and the neutral gas species 'g', respectively. For the gas pressures considered here, the collisional mean free path of the gas particles is  m, implying that the Knudsen number of the gas flow around the droplets is
  . In this regime, the heat transfer coefficient hg can be estimated by [68]
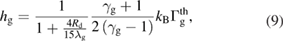
where kB is Boltzmann's constant,  is the heat capacity ratio of the gas,
  is the Maxwellian particle flux on the grain surface, with pg the gas pressure, and mg its molecular mass.
4.2. Collisions with the vessel wall
Determining the amount of kinetic energy lost when a dust grain impacts the chamber wall is crucial for the derivation of the characteristics of in-vessel dust deposition. In case the impinging particle is still liquid, the impact is systematically treated as sticking, on the basis that the spreading dynamics of the colliding droplet likely result in a large contact area, allowing fast solidification via heat transfer to the colder wall as observed in [30, 69] (see section 4.3 for estimations of such heat transfer in the case of small contact areas).
For re-solidified dust, the collisions are treated according to the elastic-perfectly plastic adhesive sphere-surface impacts model by Thornton and Ning [22, 70], recently validated for micrometer-scale W dust against experimental observations of grain-surface collisions in the sheath of magnetized plasmas [69, 71]. Taking into account energy dissipation due to adhesive forces and plastic deformation, this model quantifies the reduction of the particle velocity component normal to the surface as a function of the mechanical properties of the materials in contact, as well as the particle size and normal velocity, while the tangential component is typically conserved or weakly affected [69]. A major feature of this approach is the emergence of the sticking velocity vs, which is the minimum normal velocity the particle must have to be able to rebound. To first order, the sticking velocity can be expressed analytically as a function of the material properties and scales as  , implying that smaller particles stick more easily [22, 70]. Complications arising from the coupling between adhesion and plasticity as well as the temperature and size dependence of mechanical properties are taken into account in MIGRAINe and detailed in [21, 72]. The resulting values of vs as a function of the temperature and size of solid Be dust impinging on a smooth Be surface are plotted in figure 5(a).

Figure 5. (a) Sticking velocity vs for the impact of a solid, spherical Be dust grain on a smooth 350 K Be surface, as a function of the grain's radius Rd and temperature Td. (b) Normalized time  required for the temperature difference between a dust grain and a wall made of the same material to be reduced by a factor x, as a function of the contact radius a. Impact speeds of a few
  are typically expected to result in
  [73].
[73].
Download figure:
Standard image High-resolution imageIn the simulations, the mechanical properties assigned to the wall surface account for the differences between the Be main chamber and the W divertor region. To simplify the divertor geometry implementation, the gaps between the W dome and reflector plates were modelled as perfectly absorbing boundaries; particles entering these gaps are assumed to stick below the dome (see the wall region plotted in grey in figure 2). Randomization effects due to surface roughness have not been included in order to maintain a reasonable computational cost and avoid extra uncertainties in the results. They are expected to play a role in the location of accumulation sites only for particles with a radius up to a few μm [22].
4.3. Heat transfer upon contact
The cooling model described in section 4.1 neglects conductive heat transfer between the particles and the vessel wall during a bouncing impact. The purpose of this section is to justify this approximation by estimating the characteristic timescale for heat exchange across the dust-wall contact.
Although the general problem of heat transfer between two metallic surfaces in contact is complex [74, 75], the main scalings and relevant timescales can be obtained by considering an idealized situation involving a hot sphere in perfect contact with a cold half-space. Assuming that the bodies in contact are made of the same material, whose thermal properties are temperature-independent, the heat equation can be cast in a simple non-dimensional form. Numerical solutions can then be computed from available finite-element schemes and depend only on the geometry of the domain, namely on the contact radius a between the particle and the surface. Figure 5(b) details the results of COMSOL Multiphysics [76] simulations, yielding the values of the characteristic cooling times as a function of the contact radius, normalized to the heat diffusion time across the dust radius, given by  , where D is the thermal diffusivity of the metal. In the case of different materials in contact, an effective diffusivity can be defined and t0 remains of the same order of magnitude.
The characteristic cooling time must be compared with the duration tc of the dust-wall contact, for which a lower-bound estimate is obtained from the collision time according to Hertz's theory of elastic contacts [72, 77]. Using  as an upper-bound estimation for Be at temperatures up to 1500 K [78], one obtains
  ns and
  s for
s for  m, and the ratio
  lies below 5% for all relevant dust radii. Contact cooling during bouncing impacts can therefore be safely neglected in the simulations.
5. Results and discussion
5.1. Comparison between physical processes during the plasma stage
Given the large number of droplet charging and heating mechanisms, it is generally difficult to postulate the relative importance of each physical process a priori. Even for simplified cases such as uniform and constant plasma backgrounds, a detailed analysis of the simulation output is necessary. For the scenarios considered here, the results turn out to be fairly independent of the droplet size, and a generic picture is sketched by distinguishing only the two main stages of plasma evolution, before and after massive Ne injection. Representative values measuring the overall contribution of all relevant processes to charging and heating are given in table 2. Although these numbers are strongly tied to the details of the simulation input and should not be carelessly extrapolated (e.g. to other plasma scenarios) they provide valuable insight into the physics at play. Of particular interest is the observation that, despite the strong scaling of ion surface neutralization and IIEE with Zi, Ne impurities only have a significant effect after their massive injection, when their average charge number drops to 3 and below. Before that point, Ne ions are too few in number to have a sizeable impact, despite their high average charge number  .
.
5.2. Conversion into solid dust
As explained in section 2, the Be mass initially injected as droplets either vaporizes, collides with the wall while liquid, or re-solidifies into dust and ultimately sticks somewhere inside the chamber. Therefore, the formation of a solid dust grain from a liquid droplet only occurs when two conditions are met: (i) the droplet must survive its passage through the plasma; (ii) afterwards, it must cool down fast enough to re-solidify before it encounters the wall. Due to the surface-volume ratio effect, an increase in droplet size implies a better survivability in the plasma, but larger cooling times in the neutral gas. Moreover, slow droplets tend to remain close to the periphery of the vessel, so that they are less likely to spend time inside the plasma, and will reside longer in the cold neutral gas before colliding with the wall. Consequently, it can be expected that the production of solid dust is the most efficient for droplets with low speeds and a certain intermediate size.
These predictions are confirmed by the simulation results, as shown in figure 6. In both scenarios and regardless of size, low speeds of a few  and below dominate dust formation and only uniform and low-speed ULLN distributions lead to appreciable amounts of solid dust. Nevertheless, the final dust mass never exceeds 5% of the initial mass in the MD scenario, and 2% in the VDE scenario, even if all droplets are injected with the optimal initial size. The MD and VDE scenarios differ in the optimal initial radius—about
  m and
m and  m, respectively—and the final amount of dust produced. The fact that the MD scenario appears more favourable for dust production is linked to the position of the droplet injection points away from the plasma. Whereas droplets always enter the plasma in the VDE scenario, the plasma shape in the MD scenario is such that some droplets can remain outside the boundary if they are slow enough or injected tangentially to the wall. Since the focus of the present study is on conservative estimates, all the following results are obtained with a uniform initial speed distribution.
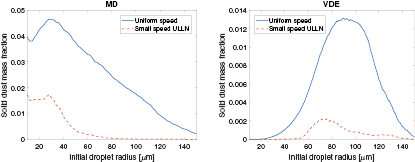
Figure 6. Fraction of the injected mass converted into solid dust as a function of the initial droplet radius, for various distributions of the initial droplet speed. Medium- and large-speed ULLN distributions lead to negligible values at the scale chosen in the graphs.
Download figure:
Standard image High-resolution imageThe main figures of merit quantifying droplet survival and re-solidification are given in table 3. A more detailed analysis of the results is presented in figure 7, which shows the size distributions of the re-solidified dust particles. In all cases, two sub-populations may be identified: a peaked distribution at  and a wider feature spreading over several tens of μm. The position of the second sub-population and its relative weight with respect to the
  m peak vary with the plasma scenario and the initial droplet size distribution; it manifests either as a heavy upper tail (in the VDE scenario with small- and medium-sized droplets) or as a second mode altogether, but it always contains the majority of the particles. Intuitively, the
  m peak consists of the particles which were injected just above the size threshold for total vaporization (which can be as high as
  m radius, depending on the initial velocity), while the second sub-population can be thought of as a distorted image of the initial droplet size distribution.
Table 3. Summary of the main results for the three upper-limit lognormal initial size distributions and a uniform distribution of the initial speed. The bottom section of the table refers to the number fraction of the re-solidified dust grains belonging to the  m sub-population and the location of the upper dust radius mode, when it exists (see figure 7).
| MD | VDE | |||||
|---|---|---|---|---|---|---|
| Small | Medium | Large | Small | Medium | Large | |
| Modal droplet radius (μm) | 30 | 75 | 120 | 30 | 75 | 120 |
| Vaporized mass (%) | 40.2 | 26.7 | 18.3 | 88.5 | 67.9 | 50.1 |
| Liquid mass (%) | 56.5 | 71.3 | 80.7 | 10.9 | 31.0 | 49.2 |
| Dust mass (%) | 3.3 | 2.0 | 1.0 | 0.6 | 1.1 | 0.7 |
 m dust fraction (%) m dust fraction (%) |
26.1 | 11.9 | 0.5 | 48.6 | 23.3 | 3.1 |
| 2nd modal dust radius (μm) | 17 | 65 | 105 | 85 | ||
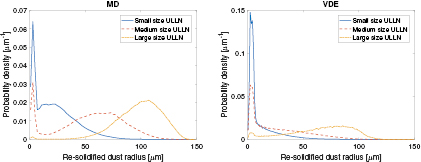
Figure 7. Size distribution of the re-solidified dust particles for the three ULLN initial size distributions and a uniform distribution of the initial speed.
Download figure:
Standard image High-resolution image5.3. Spatial distribution of solid dust
As in the previous section, generic considerations on the main physics at play can be used to predict the overall behaviour of the re-solidified particles. Since smaller grains have higher sticking velocities, they are more likely to stick upon their first collision with the chamber wall, whereas larger dust tends to rebound several times, leading to longer times of flight inside the vessel, during which gravity is the only acting force. It is therefore expected that larger dust, which carries the majority the re-solidified mass, will be preferentially found near the bottom of the vessel and on horizontal surfaces, while smaller grains will be more evenly distributed and also present on vertical surfaces. The simulated spatial distributions of solid particles plotted in figures 8 and 9 support these predictions.
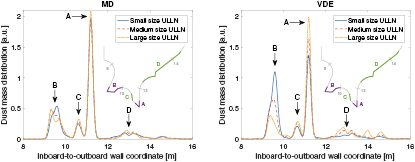
Figure 8. Spatial distribution of the surviving solid dust mass over the lower regions of the ITER poloidal cross-section, obtained by gaussian kernel density estimation with a bandwidth of 10 cm. Toroidally symmetric droplet injection with a uniform initial speed distribution was assumed. The most important features of the distribution are labelled with capital letters and highlighted on the cross-section shown in the insert. Note that the 'B' and 'C' regions include the perfectly absorbing boundaries mentioned in figure 2 and section 4.2.
Download figure:
Standard image High-resolution image
Figure 9. Spatial distribution of the average radius of solid dust over the ITER poloidal cross-section, obtained by gaussian kernel density estimation with a bandwidth of 10 cm. Toroidally symmetric droplet injection with a uniform initial speed distribution was assumed. The most important features of the distribution are labelled with capital letters and highlighted on the cross-section shown in the insert.
Download figure:
Standard image High-resolution imageIn both scenarios, most of the surviving dust mass is found to accumulate in the divertor legs and below the dome (corresponding to the peaks labelled 'A', 'B' and 'C' in figure 8), while the remaining fraction spreads over the outer divertor baffle and the lower outboard first wall (corresponding to the region labelled 'D' in figure 8). Whereas the mass distribution appears to be fairly independent of the initial droplet size in the MD scenario, larger droplet radii in the VDE case lead to a stronger inboard-outboard asymmetry. Figure 9 shows that solid dust of a few μm radius may be found all over the chamber wall in both scenarios, while the average radius of the dust in the divetor and lower outboard first wall (denoted by the labels 'A' and 'B' in figure 9) reflects the initial droplet size distribution. Due to the location of the injection point and the reduced plasma volume in the VDE scenario, dust particles larger than 10 μm in radius can also stick on the inner divertor baffle and the upper inboard first wall (corresponding to the labels 'C' and 'D' in figure 9).
These results are expected to hold qualitatively for other choices of initial distributions, as well as for more detailed wall geometries accounting for the presence of diagnostic ports or gaps between the wall elements. Indeed, fast camera observations of dust particle motion in the vicinity of PFCs show that gaps and similar geometric features do not affect the dust trajectories [71], implying that the overall gap trapping efficiency may be estimated by the ratio of the total gap area to the total wall area. The effect of PFC shaping, which is neglected in the simulations, is expected to be minor as it slightly modifies the local surface normal, i.e. the condition for bouncing impacts. Note that the average time between the injection and final sticking impact of a re-solidified dust grain is of the order of 1 s, the highest value reached in the simulation being 5 s.
5.4. Spatial distribution of droplet splashes
Since the simulated droplets are free-falling and stop upon their first encounter with the vessel wall if they are still in the liquid state, the traces of such splashing impacts can be expected to be found at any location that is not shadowed from the injection point. Since the initial droplet size does not affect its trajectory—only its survival and whether it is solid or liquid when it collides with the wall—the likelihood of finding a droplet splash at a given position depends mainly on the distributions of ejection speed and angle, which were not investigated in the present study. Nevertheless, indicative information can be obtained from the spatial distributions of the surviving mass of liquid Be in the MD and VDE scenarios. These are plotted in figure 10, where it can be seen that the results do indeed depend very weakly on the initial droplet size distribution. The strong oscillations observed in the VDE scenario are due to the insufficient sampling of injection angles; the distribution in the MD scenario is made smoother by the presence of three injection points. Qualitatively, both scenarios lead to similar results, namely that splashes are preferentially found at locations whose line-of-sight distance to the injection points is small, such as the upper part of the vessel. In terms of timescales, droplet splashes occur on average 100 ms after the injection, although the largest, slowest droplets can take up to 1.5 s to reach the wall.

Figure 10. Spatial distribution of the droplet splash mass over the ITER poloidal cross-section, obtained by gaussian kernel density estimation with a bandwidth of 10 cm. Toroidally symmetric droplet injection with a uniform initial speed distribution was assumed. The inserts in figure 9 may be used to identify the wall coordinate positions on the x-axis.
Download figure:
Standard image High-resolution image
6. Conclusions
MIGRAINe simulations of the dynamics of molten particles created in ITER by first wall melt layer splashing during major disruptions and vertical displacement events mitigated by massive neon injection reveal the key physical processes affecting droplet survival in the disrupting plasma, as well as the main characteristics of in-vessel beryllium dust accumulation. While immersed in the plasma, droplet heating is never dominated by electron collection—in contrast with the orbital motion limited theory predictions—even before the mitigating impurity injection. In the later stages of the current quench, ion processes are in fact the largest contributors to droplet heating, with a significant component due to the surface neutralization of multiply charged Ne ions. Ion-induced electron emission is of the same magnitude as electron-induced electron emission in terms of emitted currents towards the end of the disruption, but it has essentially no direct effect on droplet heating.
The overall conversion of injected droplets into solid dust is never found to represent more than 5% of the initial mass, and low injection speeds of a few m  and below are required to allow the particles time to solidify during their flight to the walls. The main dust accumulation sites are located in the divertor legs and under the dome, where the solid grains are driven by colliding repetitively against the PFCs. In both scenarios, at least 70% of the re-solidified dust mass is expected to be found in the vicinity of the divertor strike points, implying that although the 1000 kg limit on the total in-vessel dust inventory is unlikely to be reached without extreme PFC damage, the much lower limit related to dust on hot surfaces remains pertinent. A significant fraction of the remaining dust mass spreads over the lower part of the outboard main chamber, which might be an issue for nearby first mirrors.
Major disruptions appear to be more efficient at 'producing' dust due to the fact that the expected droplet sources are not in direct contact with the plasma. For the same reason, smaller droplets can survive major disruptions, resulting in the highest amount of dust being produced from droplets with an initial radius of 30 μm, compared to 100 μm for vertical displacement events. A significant fraction of the injected beryllium is expected to re-deposit on the wall as splashes, which form when a particle hits a plasma-facing component while still in the liquid state. Such splashes are more likely to occur for larger droplets and can account for 10%–80% of the initial mass depending on the injection parameters. Contrarily to solid dust, they are preferentially located on the upper regions of the main chamber wall, in the vicinity of the droplet injection points.
Acknowledgments
ITER is the Nuclear Facility INB no. 174. This paper applies new physics analysis to the estimation of potential dust production in ITER due to high energy transients which is not yet incorporated into the ITER technical baseline. The nuclear operator is not constrained by the results presented here. The views and opinions expressed herein do not necessarily reflect those of the ITER Organization.
This work has been carried out within the framework of the EUROfusion Consortium (WPPFC) and has received funding from the Euratom research and training programme 2014–2018 under grant agreement No 633053. The views and opinions expressed herein do not necessarily reflect those of the European Commission. S.R. and P.T. would also like to acknowledge the financial support of the Swedish Research Council.