
Abstract
Objective. The purpose of this study is to investigate whether and how the balance between excitation and inhibition ('E/I balance') influences the spontaneous development of human-derived neuronal networks in vitro. To achieve that goal, we performed a long-term (98 d) characterization of both homogeneous (only excitatory or inhibitory neurons) and heterogeneous (mixed neuronal types) cultures with controlled E/I ratios (i.e. E:I 0:100, 25:75, 50:50, 75:25, 100:0) by recording their electrophysiological activity using micro-electrode arrays. Approach. Excitatory and inhibitory neurons were derived from human induced pluripotent stem cells (hiPSCs). We realized five different configurations by systematically varying the glutamatergic and GABAergic percentages. Main results. We successfully built both homogeneous and heterogeneous neuronal cultures from hiPSCs finely controlling the E/I ratios; we were able to maintain them for up to 3 months. Homogeneity differentially impacted purely inhibitory (no bursts) and purely excitatory (few bursts) networks, deviating from the typical traits of heterogeneous cultures (burst dominated). Increased inhibition in heterogeneous cultures strongly affected the duration and organization of bursting and network bursting activity. Spike-based functional connectivity and image-based deep learning analysis further confirmed all the above. Significance. Healthy neuronal activity is controlled by a well-defined E/I balance whose alteration could lead to the onset of neurodevelopmental disorders like schizophrenia or epilepsy. Most of the commonly used in vitro models are animal-derived or too simplified and thus far from the in vivo human condition. In this work, by performing a long-term study of hiPSCs-derived neuronal networks obtained from healthy human subjects, we demonstrated the feasibility of a robust in vitro model which can be further exploited for investigating pathological conditions where the E/I balance is impaired.
Export citation and abstract BibTeX RIS

Original content from this work may be used under the terms of the Creative Commons Attribution 4.0 license. Any further distribution of this work must maintain attribution to the author(s) and the title of the work, journal citation and DOI.
1. Introduction
In the brain of healthy subjects, the neuronal activity is kept and controlled by a precise and well-defined balance between excitation (E) and inhibition (I) (Mossink et al 2022), defined as 'E/I balance'. Since GABA is the main inhibitory neurotransmitter of the central nervous system (Leinekugel et al 1999), it is responsible for the regulation of network excitability (Ben-Ari et al 2007). For this reason, if the physiological E/I balance is altered, it could lead to the onset of neurodevelopmental disorders (Sohal and Rubenstein 2019) in which the genetic mutations of the subjects are generally associated to altered neuronal excitability and/or synaptic communication (Geertjens et al 2022). The unbalanced E/I ratio can lead to the onset of disorders such as autism spectrum disorders (Foss-Feig et al 2017), attention deficit hyperactivity disorder (Kim et al 2017), epilepsy (Roberts 1984), and schizophrenia (Grent-'t-jong et al 2018). The incidence of genetic diseases has become extraordinarily high, affecting about 1 over 150 people (Kumar et al 2001). Consequently, investigating E/I balance in the human brain is a relevant topic in modern neuroscience.
Due to the intrinsic complexity of the human brain, research is exploring novel and alternative methods to investigate neural functions in reduced experimental models, while preserving peculiar brain features such as modularity, segregation, integration, and heterogeneity (Tononi et al 1994, Bassett and Bullmore 2006, Bullmore and Sporns 2009). To this end, in vitro models of neuronal cultures plated onto micro-electrodes arrays (MEAs) have been widely used (Spira and Hai 2013, Hong and Lieber 2019). MEAs allow to collect the electrophysiological activity of large-scale neuronal networks with a non-invasive approach and without compromising the viability and functionality of the cells coupled to the devices. To date, rodent based cultures have been the gold standard for such investigations and most of the literature is based on this experimental model (Brofiga et al 2021). However, the functionality of rodent-derived networks can only be partially compared with the physio-pathological mechanisms of the human brain (Cotterill et al 2016, Mayer et al 2018). To overcome the issues of interspecies translation, human induced pluripotent stem cells (hiPSCs) are becoming increasingly popular (Pelkonen et al 2021). Starting from the somatic cells of donors, hiPSCs allow obtaining in vitro human-derived neuronal networks with the same phenotype of the subject (Avior et al 2016, McCready et al 2022) and, thus, closer to the actual conditions in the human brain (Kirwan et al 2015). HiPSCs-derived networks exhibit neuronal activity organized into network bursts, suggesting that they develop properly and mature into functionally active networks (Hyvärinen et al 2019a). In addition, thanks to the application of the specific reprogramming protocols, it is possible to obtain different cell types (such as the glutamatergic and GABAergic ones) (Sun et al 2016, Gunhanlar et al 2018). Despite promising premises, neuronal networks derived from induced pluripotent stem cells have not yet been as widely characterized as other animal models.
In the present work, we introduce a bioartificial experimental model with a controlled E/I ratio based on in vitro hiPSCs-derived neuronal networks obtained from healthy subjects. This peculiar system allowed us to investigate whether and how the E/I balance affected the in vitro development in terms of spontaneous electrophysiological activity. To respond to our scientific question, we performed longitudinal recordings on neuronal networks with different balance of excitation and inhibition, obtained by varying the percentage of glutamatergic and GABAergic neurons. For the first time, these cultures were monitored for up to 98 d in vitro, thus demonstrating the robustness of the system. During that timeframe, we investigated and compared the developmental profile of hiPSC-derived networks at five different configurations, starting from fully excitatory (E:I 100:0) up to fully inhibitory (0:100) cultures, including heterogeneous combination of both cell types with different percentages (25:75, 50:50, 75:25). We proved that the nominal E/I ratio of the heterogeneous neuronal networks were consistent with immunostaining and imaging quantification. Spike-based functional connectivity analysis was used to characterize the E/I dynamics patterns to prove that the different E/I ratio showed significant differences also from a functional point of view. By computing classical descriptive parameters of electrophysiological activity, we found that the homogeneous networks behave differently from all the heterogeneous configurations. In particular, the fully inhibitory networks lack in the organization into bursts and exhibit a pronounced tonic firing, while the fully excitatory networks showed descriptive parameters characteristic of spiking, bursting and network bursting activity deviating from the heterogeneous networks trend. On the other hand, we proved that increased inhibition in the heterogeneous cultures affects the duration and the organization of the bursting and network bursting activity.
In conclusion, we presented a reliable in vitro brain-on-a-chip system capable to deepen the fundamental role of excitation/inhibition balance in hiPSCs-derived neuronal networks, that can be further exploited for studying neurodevelopmental disorders where this balance is impaired.
2. Materials and methods
2.1. HiPSC-derived neuronal cultures
We used two previously characterized hiPSCs lines genetically modified to generate homogeneous populations of excitatory and inhibitory neurons thanks to the forced expression of the transcription factors neurogenin-2 (Ngn2) and Achaete-scute homolog 1 (Ascl1) (Mossink et al 2022). We received the hiPSCs lines in frozen vials from Dr Frega (University of Twente). Both lines were generated from fibroblasts. Control line 1 (C1, healthy 30 years-old female) was reprogrammed via episomal reprogramming (Coriell Institute for medical research, GM25256). Control line 2 (C2, healthy 51 years-old male) was reprogrammed via a non-integrating Sendai virus (KULSTEM iPSC core facility Leuven, Belgium, KSF-16-025). The thawed hiPSCs cultures were resuspended into E8Flex medium (Thermo Fisher Scientific) supplemented with E8 supplements (2%, Thermo Fisher Scientific), penicillin/streptomycin (1%, Sigma-Aldrich), G418 (50 μg ml−1, Sigma-Aldrich) and puromycin (0.5 μg ml−1, Sigma-Aldrich). Glutamatergic cortical Layer 2/3 neurons were derived from C1 by overexpressing mouse neuronal determinant Ngn2 upon doxycycline (4 μg ml−1, Sigma-Aldrich) treatment (Frega et al 2017). GABAergic neurons were derived from C2 by overexpressing mouse neuronal determinant Ascl1 (Addgene 97 329) upon doxycycline treatment and supplementation with forskolin (10 μM, Sigma Aldrich) (Mossink et al 2022). The hiPSCs can be considered differentiated into neurons after 3 weeks of doxycycline and forskolin treatment (Shi et al 2016, Frega et al 2017). The cultures were maintained into the incubator at stable condition (37 °C, 5.5% CO2, 95% humidity atmosphere). The medium was refreshed at 50% every two days.
2.2. Neuronal network cultures
The neuronal cultures were treated with the adapted pipeline presented in (Wang et al 2023). Briefly, PDMS rings were used to favor the attachment and to both confine and protect the cells without creating patterned networks and without affecting the cells' viability (Liu et al 2019, Ming et al 2021). Each ring had a diameter of 6 mm and height of about 1 mm. The PDMS rings were obtained using a mixture of PDMS base (Syligard 184) and curing agent at a 10:1 (w/w) ratio, which was polymerized in oven (80 °C for 15 min). The day before the neuronal cultures plating, the rings were positioned and let adhere to the MEA surface. The devices were sterilized in an oven (120 °C for 3 h) and pre-coated over night with poly-L-Ornithine (50 μg ml−1, Sigma-Aldrich) and human laminin (20 μg ml−1, BioLamina) (Hartmann et al 2023). At DIV 0, neurons (iNs) were co-plated with rat astrocytes (A) to favor neuronal growth and maturation (Tang et al 2013) in a ratio equal to 70:30 (iNs:A) (figure 1(c)). The glutamatergic (E) and GABAergic (I) neurons were mixed in different proportions to obtain 5 configurations: E:I 100:0, 75:25, 50:50, 25:75, 0:100 (figure 1(b)). The neuronal cultures density was equal to 1200 cells mm−2. During the first week, the neuronal cultures were maintained in Neurobasal medium (Thermo Fisher Scientific) supplemented with B27 supplements (2%, Thermo Fisher Scientific), penicillin/streptomycin (1%, Sigma-Aldrich), stable L-Glutamine (1% GlutaMax 100x, Thermo Fisher Scientific), human Brain-Derived Neurotrophic Factor (BDNF, 10 ng ml−1, Sigma-Aldrich), human Neurotrophin-3 (NT-3, 10 ng ml−1, Sigma-Aldrich), doxycycline (4 μg ml−1, Sigma-Aldrich) and forskolin (4 μg ml−1, Sigma-Aldrich). After 7 DIV, fetal bovine serum (FBS, 2%, Thermo Fisher Scientific) was added to the aforementioned supplemented medium to support astrocytes. After 14 DIV, doxycycline and forskolin were removed from the medium. The neuronal cultures on MEAs were stably maintained in the incubator (same conditions specified in the previous paragraph) up to 98 DIV. The medium was refreshed at 50% each two days.

Figure 1. Experimental protocol. (a) Schematic representation of the cell culture protocol. From left to right: starting from healthy subjects, a skin biopsy was performed to procure fibroblasts. By the application of a reprogramming protocol, fibroblasts regress to a stem stage, originating hiPSCs cultures. Induced neurons (iNs) were obtained after 3 weeks of doxycycline treatment. (b) Sketch of the five configurations obtained by varying the ratio between glutamatergic (orange) and GABAergic (blue) neurons (E:I) in the neuronal cultures. (c) Sketch of the MEAs exploited in this study. Neuronal cultures were composed by glutamatergic (orange) and GABAergic (blue) neurons co-plated with rat astrocytes (green). The cells were placed in the active area of the devices, characterized by 60 electrodes.
Download figure:
Standard image High-resolution image2.3. Experimental set-up and dataset
The neuronal cultures were plated on commercial MEAs, i.e. 60 TiN electrodes arranged in an 8 × 8 grid layout on a glass surface (Multi Channel Systems—MCS, Reutlingen, Germany). The electrodes were 30 μm in diameter and equally spaced with a 200 μm of distance. The electrophysiological data were acquired with the MEA2100 recording system (MCS) with the MC_rack software (MCS). After a 10 min period of acclimatation out of the incubator, the electrophysiological spontaneous activity was recorder for 15 min in stable condition (37 °C, 5% CO2) and sampled at 10 kHz. The neuronal networks activity was recorded from DIV 35 until DIV 98. The number of devices recorded for each configuration in each temporal step is reported in table 1. All collected data were obtained from neuronal networks derived from three different experimental batches. It is worth noticing that we observed the entire development of the 56%, 86%, 63%, 63% and 83% of the cultures for the 0:100, 25:75, 50:50, 75:25, and 100:0, respectively.
Table 1. Recordings dataset. Scheme of the recordings performed from DIV 35 to DIV 98 (columns) for each configuration (rows). The reported numbers represent the number of neuronal networks plated and recorded on MEAs.
| 35 | 42 | 49 | 56 | 63 | 70 | 77 | 84 | 91 | 98 | |
|---|---|---|---|---|---|---|---|---|---|---|
| 0:100 | 9 | 9 | 8 | 8 | 8 | 6 | 6 | 5 | 5 | 5 |
| 25:75 | 7 | 7 | 7 | 7 | 7 | 7 | 6 | 6 | 6 | 6 |
| 50:50 | 8 | 8 | 6 | 6 | 6 | 6 | 5 | 5 | 5 | 5 |
| 75:25 | 8 | 8 | 8 | 7 | 7 | 7 | 6 | 5 | 5 | 5 |
| 100:0 | 6 | 6 | 6 | 6 | 6 | 6 | 5 | 5 | 5 | 5 |
2.4. Data analysis
In the following subsections, we explain in detail the analyses carried out on the data and, in particular, the parameters we extrapolated to characterize the networks. The parameters are summarized in the glossary (supplementary).
2.4.1. Spiking and bursting activity
Offline data analysis was performed using SpyCode (Bologna et al 2010) and in-house code developed in MATLAB (The Mathworks, Natick, MA, USA) inspired to previously developed software (Pastore et al 2018a), allowing the extraction of parameters that describe the spontaneous network activity. We pre-processed the data adapting the pipeline presented in a previous study (Brofiga et al 2022) and here summarized for the sake of clarity. Spike detection was performed using the Precision Timing Spike Detection (PTSD) algorithm (Maccione et al 2009). The noise threshold for individual electrode was set at ten times the standard deviation of the baseline noise. The parameters required for the PTSD were the peak lifetime period (set at 2 ms), associated to the duration of the spike, and the refractory period (set at 2 ms), i.e. the minimum time elapsed between consecutive spikes. The mean firing rate (MFR, i.e. the number of spikes in the unit time) for each culture was calculated by averaging the firing rates of each active channel. A channel was considered active if its firing rate was greater than 0.1 spikes s−1 (sp s−1) (Mossink et al 2021). Bursts were detected exploiting the logarithmic binning of the neuronal inter-spike interval (Pasquale et al 2010). An event was defined bursts if it was composed of at least ten spikes with an intra-burst frequency higher than 50 sp s−1. To discern two consecutive bursts, we evaluated the inter-burst interval (IBI), i.e. the temporal distance between the end of a burst and the beginning of the following one. If the IBI was lower than 50 ms, we merged the two bursts. An active channel was considered bursting if its bursting rate was greater than 0.4 bursts min−1 (Mossink et al 2021). The mean bursting rate (MBR, i.e. the number of bursts per minute) for each culture was calculated by averaging the bursting rates of each bursting channel. After, the burst detection was performed, we extrapolated the following parameters to characterize the neuronal activity: burst duration (BD) and percentage of random spikes (RS), defined by calculating the mean percentage of spikes per bursting channel that did not belong to a burst. An event was defined as network burst if 20% of the bursting channels simultaneously presented activity. All the aforementioned spiking and bursting statistics (i.e. MFR, MBR, BD, RS) related to the different configurations (i.e. E:I 100:0, 75:25, 50:50, 25:75, 0:100) at each DIV were obtained by averaging the parameters of each culture belonging to the considered configuration.
2.4.2. Network bursting activity
From the network burst detection, the following parameters were derived: mean network bursting rate (NBR) computed for each culture individually as the number of network bursts detected in a minute, and the network burst duration (NBD). Then, we computed the cumulative spike time histograms (STHs): the cumulative instantaneous firing rate (bin = 10 ms) related to all detected network bursts were aligned with respect to the longest network burst peak. From the cumulative STH, we inferred the peak amplitude by considering the maximum value of the shape (STHpeak). We obtained the average cumulative STH for each configuration by averaging the cumulative STHs of each culture belonging to the considered configuration. We computed the 90% confidence interval by considering all the shapes of the same configuration to evaluate the robustness of the dataset. We evaluated the evolution of the cumulative STH by analyzing the trend of the rising and decaying phases. The rising phase of the cumulative STH was considered as the part of the curve ranging from the time required to pass from the 10% to the 90% of the peak amplitude. The rising phase has been fitted with a double exponential function:

where  ,
,  and c are the coefficients of the fitting equation. The smaller exponent between
  and
and  represents the neuron recruitment rate (τrise) (Van De Vijver et al
2019). The decay phase of the cumulative STH was considered as the part of the curve ranging from the time required to pass from 90% to 10% of the peak amplitude of the curve after the peak itself. The decay phase has been fitted with a first-degree exponential function:
represents the neuron recruitment rate (τrise) (Van De Vijver et al
2019). The decay phase of the cumulative STH was considered as the part of the curve ranging from the time required to pass from 90% to 10% of the peak amplitude of the curve after the peak itself. The decay phase has been fitted with a first-degree exponential function:

where  and
and  are the coefficients of the fitting equation and δ represents the network modulation (τdecay) during the network bursts events (Marom and Shahaf 2002). All the aforementioned network bursting statistics (i.e. NBR, NBD, STHpeak, τrise, and τdecay) related to the different configurations (i.e. E:I 100:0, 75:25, 50:50, 25:75, 0:100) at each DIV were obtained by averaging the parameters of each culture belonging to the considered configuration.
2.4.3. Functional connectivity
The statistical interdependence between neuron pairs was evaluated by extracting the functional connectivity. In order to distinguish both excitatory and inhibitory functional connections, we inferred connectivity by adopting the Total Spiking Probability Edges (TSPE) algorithm (De Blasi et al 2019). Briefly, once the cross-correlograms were obtained, an edge filter was applied to them. Such procedure allowed identifying the local maxima and minima, corresponding to excitatory and inhibitory connections, respectively. After the connectivity matrix has been computed, we used a threshold to discard those values that did not reasonably identify actual functional connections or that were not compatible with a physiological propagation speed. First, we applied a spatial filter to keep only the functional connections that guarantee a propagation speed between 30 and 300 mm s−1 (Jacobi and Moses 2007). Then, we used a hard threshold independently evaluated for the excitatory and inhibitory connections (Pastore et al 2018b), defined as follows:

where μ and σ are the mean and the standard deviation of all non-zero cross-correlation matrix elements, and n is an integer. The subscripts e and i are relative to the excitatory and inhibitory links, respectively. We set for all experiments  = 1 and
  = 2 (Brofiga et al
2022).
= 2 (Brofiga et al
2022).
2.4.4. Synchronization
The effect of the different percentages of inhibitory neurons was evaluated in terms of synchronization level of both spiking and bursting activity. For each pair of electrodes k and j, the normalized cross-correlogram  was computed within a window of 50 ms (T) using a bin of 0.1 ms (
 ). The normalized cross-correlation was obtained using the following equation:
where  indicates the timing of an event in the k train.
From the cross-correlation function, we computed the coincidence index ( ), defined as follows:
where the numerator represents the area of the correlogram around zero and i is the number of bins around the zero-bin ( 1 ms).
2.4.5. Statistics
Statistical analyses were performed using MATLAB (The MathWorks, Natick, MA, USA). We evaluated the normal distribution of the data using the Kolmogorov–Smirnov normality test. Since the data were not normally distributed, we performed a non-parametric Kruskal–Wallis test. To establish statistically significant differences, p values < 0.05 were considered significant. All values in the text are reported as mean ± standard deviation, unless differently stated.
2.5. Immunocytochemistry
At DIV 70, cells were fixed with 4% paraformaldehyde (PFA) for 10 min at room temperature. Subsequently, the cultures were permeabilized with 0.2% Triton-X100 diluted in PBS for 10 min. Non-specific binding sites were blocked with a 1-hour treatment of blocking buffer solution (BBS) composed by PBS, 0.2% Triton-X100, and 5% of fetal bovine serum (FBS, Sigma-Aldrich). The primary antibodies were diluted in BBS and incubated overnight at 4 °C. We used anti-GABA (1:500, Poly Rabbit, A2052, Sigma-Aldrich) and anti-NeuN (1:500, Poly Guinea Pig, Synaptic Systems) as primary antibodies. The day after, we rinsed twice the samples with PBS to remove the excess primary antibodies solution. The secondary antibodies were diluted in BBS and incubated for one hour at room temperature. The following secondary antibodies were used: Alexa Fluor 546 (1:1000, Goat anti-Guinea Pig, ThermoFisher Scientific), and Alexa Fluor 488 (1:700, Goat anti-Rabbit, Invitrogen). We imaged with fluorescence equipped microscope (Olympus BX-51). Images were acquired at 50X magnification. Fluorescent signals were analyzed using Fiji software (Schindelin et al 2012). All the samples were acquired with the same settings, to compare the signals between the different experimental configurations. The number of glutamatergic neurons was defined as the difference between the number of total neurons (NeuN) and the number of GABAergic neurons (GABA A2052). We collected 240 images (80 for each heterogeneous configuration) from different samples.
3. Results
3.1. Morphological characterization reflects E/I ratio
We morphologically characterized the heterogeneous configurations (i.e. 25:75, 50:50, and 75:25) by performing immunocytochemistry to prove that we can effectively control the different percentages of the plated glutamatergic and GABAergic neurons. Figures 2(a)–(c) shows a representative image of each heterogeneous configuration. Since NeuN primary antibody has a specificity for neuronal nuclear proteins, it is expressed in the nuclei of any differentiated neuron. The presence of glutamatergic neural nuclei marked with NeuN can be noticed in red (the only marker for that type of cell), while the presence of NeuN-marked GABAergic neuronal nuclei can be observed in yellow, since it overlaps with anti-GABA primary antibody (labeled in green, GABA neurotransmitter specific). Thus, the reported images indicate the right differentiation in both GABAergic and glutamatergic neurons. Then, to ensure that the nominal proportions of glutamatergic and GABAergic neurons were those actually obtained, we counted the differently labeled excitatory and inhibitory neurons. We found ratios close to the nominal values (figure 2(f)). In particular, the 75:25 configuration showed an average value of inhibition equal to 29% ± 2.5% (mean ± standard error of mean—SEM). The 50:50 exhibited a percentage of GABAergic neurons equal to 51% ± 2.6% (mean ± SEM), while the 25:75 showed 68% ± 2.3% (mean ± SEM) as average fraction of inhibitory neurons. Significant differences were found among all the configurations, thus showing a clear distinction between the E/I ratios (25:75 vs 50:50, p = 6.6⋅10−6; 25:75 vs 75:25, p = 1.1⋅10−17; 50:50 vs 75:25, p = 9.1⋅10−9).
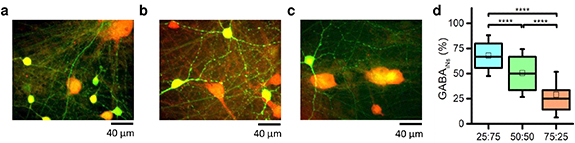
Figure 2. Morphological characterization of the E/I cultures. Network images at DIV 70 of a representative (a) 25:75; (b) 50:50; (c) 75:25 configuration. Neurons were stained in order to visualize neuronal nuclear protein (red: NeuN) and GABA neurotransmitter (green: anti-GABA) to distinguish GABAergic from glutamatergic neurons. (d) Box plots represent the percentage of GABAergic neurons counted for each heterogeneous configuration. In the box plots, data are represented with the percentile 25-75 (box), the standard deviation (whiskers), the median (line), and the mean (square) values (**** refers to p < 0.0001).
Download figure:
Standard image High-resolution image3.2. HiPSC-derived inhibitory neuronal networks exhibit tonic firing
We first analyzed the spontaneous electrophysiological activity of the homogeneous networks composed by GABAergic neurons (i.e. 0:100 configuration). Over the entire development, the cultures showed a tonic activity, and an increasing signal amplitude (A0:100_DIV35 = 47.30 ± 0.08 μV (mean ± SEM); A0:100_DIV98 = 86.19 ± 0.10 μV (mean ± SEM)) in terms of single channel activity was observed (figures 3(a) and (c)), revealing a percentage of variation (Var%35vs98) equal to +82.20%. At first glance, the electrophysiological activity of the same representative network at DIV 35 (figure 3(b)) and DIV 98 (figure 3(d)), displayed an increase in the firing at the network level as emerges by looking at the average firing rate profile. Then, we computed the MFR to quantitatively evaluate the evolution of the network firing rate. The MFR showed statistically significant differences with increasing values during the weeks (figure 3(e), MFR0:100_DIV35 = 1.13 ± 0.73 sp s−1, n = 9; MFR0:100_DIV98 = 8.15 ± 5.04 sp s−1, n = 5; p = 0.008) with Var%35vs98 = +621%. Moreover, the neuronal activity was not characterized by organized bursting or network bursting patterns which were completely missing. For this reason, in figures 3(f) and (g) we only show the extreme time points, i.e. DIV 35 and DIV 98, to avoid redundant information. The MBR and NBR showed very low values, even close to zero at both DIV 35 and DIV 98 (figures 3(f) and (g)), demonstrating that few bursts or network bursts were detected during the development, even in more advanced temporal steps (MBR0:100_DIV35 = 0.11 ± 0.27 bursts min−1, MBR0:100_DIV98 = 0.75 ± 0.75 bursts min−1, NBR0:100_DIV35 = 0.11 ± 0.27 NBs min−1, NBR0:100_DIV98 = 0.11 ± 0.16 NBs min−1). Consequently, most spikes were classified as RS, i.e. not belonging to bursts (figure 3(h), RS0:100_DIV35 = 98.83 ± 2.61%, RS0:100_DIV98 = 97.25 ± 1.79% with Var%35vs98 = −1.6%). Given the lack of bursting and network bursting activity in the 0:100 configuration, we did not consider it for further analysis.
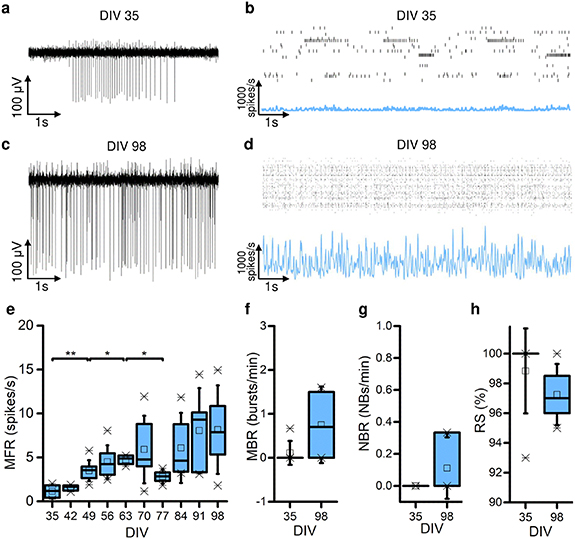
Figure 3. Pure inhibitory cultures characterization. (a) Raw data recorded by an electrode of a representative 0:100 culture at DIV 35. (b) Raster plot (on top) and corresponding cumulative spike time histogram (on bottom) of the same representative culture in (a) at DIV 35. (c) Raw data recorded by an electrode of the same representative culture in (a) at DIV 98. (d) Raster plot (on top) and corresponding cumulative spike time histogram (on bottom) of the same representative culture in (a) at DIV 98. (e) Mean firing rate (MFR) of the 0:100 configuration during the days in vitro. (f) Mean bursting rate (MBR) of the 0:100 configuration at DIV 35 and DIV 98. (g) Random spikes (RS) percentage of the 0:100 configuration at DIV 35 and DIV 98. (h) Network bursting rate (NBR) of the 0:100 configuration at DIV 35 and DIV 98. In each box plot (e)–(h). In the box plots, data are represented with the percentile 25-75 (box), the standard deviation (whiskers), the median (line), the mean (square), and the minimum and maximum (crosses) values (* refers to p < 0.05 and ** to p < 0.01).
Download figure:
Standard image High-resolution image3.3. The E/I ratio impacts the spiking and bursting activity during development
We monitored the activity of our cultures from DIV 35 up to DIV 98, focusing on parameters related to the spiking and bursting activity (figure 4). In the heterogeneous conditions (i.e. 25:75, 50:50, 75:25), we observed an increase in the MFR during the cultures' growth regardless of the presence of the inhibitory component. Across the network development, the MFR displayed a monotonous increase (figure 4(a)). Considering DIV 35 and DIV 98 (first and last temporal checkpoints), the networks showed a percentage of variation (Var%35vs98) equal to +1840% in 25:75 (n35 = 7, n98 = 6), +1560% in 50:50 (n35 = 8, n98 = 5) and +1230% in 75:25 (n35 = 8, n98 = 5). Simultaneously, an increase in the MBR was observed as well (figure 4(b), Var%35vs98 +85% in 25:75, +100% in 50:50, +250% in 75:25). Moreover, a temporal redistribution of the spiking activity was highlighted by a reduction of both BD and RS values (figures 4(c) and (d). Focusing on the BD, in the heterogeneous configurations a trend with ascending and then descending phase was observed. In the 25:75 and 75:25 a maximum value was reached at DIV 49 (BD25:75_DIV49 = 1390 ± 480 ms and BD75:25_DIV49 = 2124 ± 624 ms). On the other hand, the 50:50 showed a slower increase in BD profile, reaching the highest value at DIV 63 (BD50:50_DIV63 = 1567 ± 262 ms). Then, the BD profile decreased in all configurations until DIV 98, reaching the final values of: BD25:75_DIV98 = 725 ± 65 ms, BD50:50_DIV98 = 853 ± 104 ms, and BD75:25_DIV98 = 776 ± 116 ms. On the other hand, the fully excitatory networks (100:0, n35 = 6, n98 = 5) showed a statistical increase in MFR only during the two first weeks, reaching an average value of MFR100:0_DIV49 = 6.25 ± 5.6 sp s−1. After DIV 49, the MFR100:0 values did not show any significant variation. Moreover, in 100:0 configuration there was a reorganization of the electrophysiological activity induced by a temporal redistribution of the spikes: regardless the constant values of MFR (figure 4(a)), it can be qualitatively observed an increase in the MBR (Var%35vs98 = +210%), indicating a reorganization of spikes into burst. This spikes' redistribution was also demonstrated by a constant trend of the firing in front of the reduction in BD (Var%35vs98 = −44%) and RS (Var%35vs98 = −60%). All the statistical differences are reported in the supplementary tables 2 and 3.

Figure 4. Spiking and bursting characterization over the development of the heterogeneous and the pure excitatory networks (a)–(d). (a) Mean firing rate (MFR); (b) mean bursting rate (MBR); (c) burst duration (BD); (d) percentage of random spikes (RS) of 25:75 (cyan), 50:50 (green), 75:25 (orange), and 100:0 (red) configurations. Data are represented with the mean (dot) and the mean squared error (whiskers). Spiking and bursting features comparison at DIV 70 (e)–(h). (e) Mean firing rate (MFR); (f) mean bursting rate (MBR); (g) burst duration (BD); (h) percentage of RS of 25:75 (cyan), 50:50 (green), 75:25 (orange), and 100:0 (red) configurations. Data are represented with the percentile 25-75 (box), the standard deviation (whiskers), the median (line), the mean (square), and the minimum and maximum (crosses) values (* refers to p < 0.05 and ** to p < 0.01).
Download figure:
Standard image High-resolution imageTo define the best temporal step to compare the 4 configurations, we fitted the MFR profile for all the configurations with the Hill function (figure S1). We evaluated the accuracy of the fitting model by computing the coefficient of determination (R2). The fitting indicated a relationship between the model and the data for the heterogeneous configurations with R2 = 0.93, 0.95, 0.96 for 25:75, 50:50, and 75:25, respectively. On the other hand, the homogeneous configurations showed R2 = 0.65 for 0:100 and R2 = 0.75 for 100:0. We considered the temporal step in which the fitted curve reached 80% of the plateau as the day of maturation (i.e. corresponding to a stable level of activity). In particular, we obtained: DIV 63 for the 0:100, DIV 70 for the 25:75, DIV 59 for the 50:50, DIV 67 for the 75:25, and DIV 67 for the 100:0. To compare the configurations at the same time point, we chose DIV 70, which was the highest obtained value. Starting with the evaluation of the MFR, the heterogeneous cultures (i.e. 25:75, 50:50, 75:25) did not show statistically significant differences due to the presence of different inhibitory percentage (figure 4(e), MFR25:75 = 20.61 ± 4.15 sp s−1, MFR50:50 = 21.60 ± 4.80 sp s−1, MFR75:25 = 25.21 ± 1.67 sp s−1). The pure excitatory neuronal networks showed a lower firing activity with respect to all the heterogenous configurations (figure 4(e) MFR100:0 = 5.81 ± 4.01 sp s−1, 25:75 vs. 100:0 p = 0.004, 50:50 vs. 100:0 p = 0.006, 75:25 vs. 100:0 p = 0.009). On the other hand, MBR showed decreasing values with the increasing percentage of the excitation (figure 4(f), MBR25:75 = 8.17 ± 0.72 burst min−1, MBR50:50 = 6.18 ± 0.27 burst min−1, MBR75:25 = 5.35 ± 0.84 burst min−1). Statistical differences arose between 25:75 and 50:50 (p = 0.006), and between 25:75 and 75:25 (p = 0.003). Furthermore, the 100:0 firing activity reduction was reflected in a reduced bursting activity with a value of MBR100:0 = 3.20 ± 2.74 burst min−1. Subsequently, we investigated how the inhibition percentage affected the BD. Considering the heterogeneous configurations, although the 50:50 did not show statistical differences with the other two, a trend could be identified: the value of BD decreased with the increase of the percentage of the inhibition into the neuronal cultures (figure 4(g), BD25:75 = 1151 ± 149 ms, BD50:50 = 1319 ± 154 ms, BD75:25 = 1578 ± 290 ms, 25:75 vs. 75:25, p = 0.016). The BD100:0 deviated from the heterogeneous configuration trend and showed values with a higher spread (figure 4(g), BD100:0 = 931.54 ± 416.50 ms) and statistically significant difference between 100:0 and 75:25 (p = 0.01). By analyzing the distribution of the spikes in the bursting pattern, the percentage of RS among heterogeneous configurations decreased with the increase of the percentage of the excitation (figure 4(h), 25:75 vs. 50:50, p = 0.005, 25:75 vs. 75:25, p = 0.006). On the other hand, the pure excitatory networks differed again from the heterogeneous configurations with statistically significant differences, showing a higher presence of RS (figure 4(h), RS25:75 = 16.86% ± 2.85%, RS50:50 = 11.33% ± 2.34%, RS75:25 = 9% ± 0%, RS100:0 = 65.50% ± 23.42%. 100:0 vs. 25:75, p = 0.003, 100:0 vs. 50:50, p = 0.004, 100:0 vs. 75:25, p = 0.008). To summarize, we can state that the completely excitatory cultures represent an extreme configuration with a particularly different behavior with respect to the heterogeneous configurations for what concern all the parameters analyzed. We can also assert that the percentage of inhibition does not affect the firing activity, since the MFR is comparable across the heterogeneous configurations. However, the inhibition component affects the activity at bursting level, decreasing the duration of bursts and increasing the frequency of burst events and the percentage of RS.
3.4. Inhibition percentage affects the network bursting behavior
In this section, we focused on the network bursting activity. In figure 5, we reported the raster plots (top panel) and the cumulative STHs (bottom panel) of four representative neuronal cultures at DIV 70, one for each considered configuration (i.e. 25:75, 50:50, 75:25 and 100:0). At first glance, differences can be observed. First, in the heterogeneous configurations (figures 5(a)–(c)), the frequency of the occurrence of network events decreases as the level of excitation increases. Second, the NBD increases with the reduction of inhibition into the networks. Third, the 100:0 configuration (figure 5(d)) showed a lower activity amplitude and a completely different shape of the cumulative STH than the heterogeneous configurations. To quantify these claims, we extrapolated the NBR (figure 5(e)) and the NBD (figure 5(f)). The heterogeneous configurations show a decreased NBR with the reduction of the percentage of the excitatory neurons, reflecting the MBR trend (figure 5(e), NBR25:75 = 8.16 ± 0.74 NBs min−1, NBR50:50 = 5.79 ± 0.81 NBs min−1, NBR75:25 = 5.12 ± 1.16 NBs min−1, 25:75 vs. 50:50, p = 0.006, 25:75 vs. 75:25, p = 0.003). Despite there are not statistically significant differences between the NBD across the heterogeneous configurations (figure 5(f)), also for this parameter we can observe the same increasing trend of the BD when the amount of excitation increases in the neuronal networks. The 100:0 configuration shows NBR and NBD values (NBR100:0 = 6.40 ± 2.06 NBs min−1, NBD100:0 = 2.31 ± 1.20 s) that deviate from the trend of heterogeneous configurations, as seen above for other parameters. In figure 6(a), we reported all the network bursts aligned with respect to the peak of the longest network burst of a representative culture for each configuration at DIV 70 with the respective cumulative STH (overlapped). Despite we chose representative neuronal networks, the n = 32 cultures are characterized by repeatable neuronal network activity, since the 90% confidence interval of the average cumulative STH is restricted for all the considered configurations (figure S2). In figure 6(b), we reported the average cumulative STH of each configuration obtained by averaging the cumulative STHs of each culture belonging to the same configuration. From a qualitative point of view, the heterogeneous cultures show a different amplitude (STHpeak) of the cumulative STH and, again, a diverse NBD, in particular the decay phase duration (figure 6). These qualitative considerations are supported by statistically significant differences: the STH peak amplitude is inversely proportional to the percentage of GABAergic neurons present in the neuronal cultures (figure 6(b), inset. STHpeak25:75 = 10 367 ± 1497 sp s−1, STHpeak50:50 = 13 445 ± 786 sp s−1, STHpeak75:25 = 16 049 ± 1161 sp s−1; 25:75 vs. 50:50, p = 0.005; 25:75 vs. 75:25, p = 0.003; 50:50 vs. 75:25, p = 0.011). The time constant of the rise dynamics (τrise, figure 6(b), inset) shows comparable values for the heterogeneous configurations (τrise 25:75 = 2.01 ± 0.69 ms, τrise 50:50 = 1.35 ± 0.64 ms, τrise 75:25 = 1.72 ± 0.30 ms), while the τdecay shows decreasing values with the increased percentage of the inhibition into the heterogeneous neuronal networks (τdecay 25:75 = 66.21 ± 6.45 ms, τdecay 50:50 = 83.15 ± 26.21 ms, τdecay 75:25 = 102.48 ± 29.40 ms, 25:75 vs. 75:25, p = 0.017). On the other hand, the 100:0 shows different shape of the curve, a reduced NBD and a drastic reduction of the amplitude of the cumulative STH (figure 6). These qualitative considerations are supported by the statistically significant differences of the STH peak amplitude between the 100:0 and the heterogeneous configurations (figure 6(b), inset. STHpeak100:0 = 5148 ± 4227 sp s−1; 100:0 vs. 25:75, p = 0.045, 100:0 vs. 50:50, p = 0.018 100:0 vs. 75:25, p = 0.004). Furthermore, the 100:0 reveals higher τrise values (τrise 100:0 = 54.13 ± 28.42 ms, 100:0 vs. 25:75, p = 0.009, 100:0 vs. 50:50, p = 0.006 100:0 vs. 75:25, p = 0.005) and a minimum value of τdecay (τdecay 100:0 = 37.09 ± 11.91 ms, 100:0 vs. 25:75, p = 0.003, 100:0 vs. 50:50, p = 0.004 100:0 vs. 75:25, p = 0.003). To summarize, even at the network level activity, the 100:0 configuration shows a different behavior from heterogeneous networks. On the other hand, the amount of inhibition in the heterogeneous configurations affects the frequency, the duration (in particular the decay dynamic) and the amplitude of the network-wide events.

Figure 5. Network bursting activity in the heterogeneous and pure excitatory cultures at DIV 70. (a)–(d) Representative raster plots (on top) and respective cumulative spike time histograms (on bottom) of 40 s spontaneous activity of neuronal cultures at DIV 70, collected by a 60-electrodes MEA of (a) 25:75, (b) 50:50, (c) 75:25, and (d) 100:0 configurations. A black dot and a dense black band represent a detected spike and a network burst, respectively. (e) Box plots of network bursting rate (NBR) of the compared configurations at DIV 70. (d) Box plots of network burst duration (NBD) of the compared configurations at DIV 70. In the box plots, data are represented with the percentile 25-75 (box), the standard deviation (whiskers), the median (line), the mean (square), and the minimum and maximum (crosses) values (* refers to p < 0.05 and ** to p < 0.01).
Download figure:
Standard image High-resolution image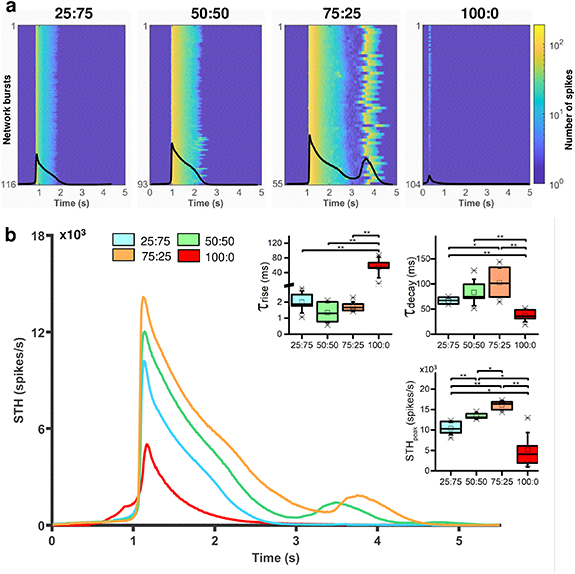
Figure 6. Cumulative spike time histogram (STH) evaluation in the heterogeneous and pure excitatory cultures at DIV 70. (a) Aligned network bursts with respect to the peak of the longest network burst with the respective cumulative spike time histograms (overlapped) of a representative network. From left to right: 25:75, 50:50, 75:25, and 100:0 configurations. (b) Average cumulative spike time histograms of each configuration (25:75 cyan, 50:50 green, 75:25 orange and 100:0 red). Inset: box plots of STH features at DIV 70: time constant of rise (τrise) and decay dynamics (τdecay), and STH peak amplitude. In the box plots, data are represented with the percentile 25-75 (box), the standard deviation (whiskers), the median (line), the mean (square), and the minimum and maximum (crosses) values (* refers to p < 0.05 and ** to p < 0.01).
Download figure:
Standard image High-resolution image3.5. Inhibitory functional connections play a key role at spiking and bursting synchronization level
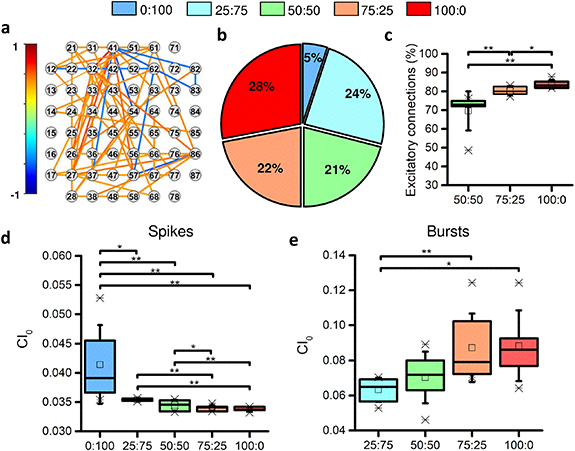
In the previous sections, we found that the different percentages of inhibitory neurons plated at DIV 0, which modulate differently the network activity, are stable over development from a morphological point of view. In order to verify whether these percentages were found and maintained also from a functional point of view, we investigated the functional connectivity using the TSPE algorithm (see section 2.4.3). Figure 7(a) shows a representative example of the functional connectivity map of a physiological neuronal network (75:25). Each node represents an electrode of the MEA, while links indicate the detected functional connections. The topological characterization of the inhibitory networks (0:100) was not performed as the low spiking and almost absent bursting activity did not allow the extraction of robust cross-correlograms. In fact, considering DIV 70, the connections detected in inhibitory networks represent only 5% of the total functional connections detected in all configurations (figure 7(b)). Moreover, due to the limit imposed by the algorithm for the detection of causal connections from inhibitory to inhibitory and from inhibitory to excitatory neurons in a non-random network, we decided to also neglect the networks of the 25:75 configuration. In fact, due to its unbalanced composition in favor of the inhibitory component, this configuration presents many of these wrongly detected connections. Figure 7(c) quantifies the percentage of excitatory connections that modulate the neuronal activity in the different configurations. We detected 69.6  10.4% excitatory connections in the 50:50 configuration, 80.32.3% in the 75:25 configuration, and approximately 83.8
  2.3% in the fully excitatory (100:0) configuration. The reported values deviate from the putative percentage of excitatory neurons (figures 2(d) and 7(c)); nonetheless, it is worth noticing how the percentage of functional excitatory connections increased as a function of the increase of excitatory neurons. The 50:50 networks displayed a percentage of excitatory connections lower than the 75:25 condition of about 17.0% (p = 0.004), and lower than the 100:0 configuration of about 13.3% (p = 0.002). Moreover, the 75:25 configuration showed 4.2% fewer excitatory connections than the 100:0 configuration (p = 0.03).
Figure 7. Functional connectivity and synchronization analysis at DIV 70. (a) Representative functional connectivity map of a 75:25 network. (b) Percentage of detected functional connections in the different configurations computed as the number of functional connections established in each configuration normalized with respect to the sum of all detected connections (in all configurations). (c) Percentage of functional excitatory connections. (d) Synchronization level in terms of spiking and (e) bursting activity. In the box plots, data are represented with the percentile 25-75 (box), the standard deviation (whiskers), the median (line), the mean (square), and the minimum and maximum (crosses) values (* refers to p < 0.05 and ** to p < 0.01).
Download figure:
Standard image High-resolution image
Since the inhibitory component of neuronal networks is considered responsible for the synchronization of network activity (Bonifazi et al
2009), it was interesting to study how both the observed functional and structural variations at the core of this study modulated the global temporal organization of the events. We evaluated the synchronization level (CI0) of the network in terms of both spiking (figure 7(d)) and bursting (figure 7(e)) activity. From the spiking activity point of view, a descending trend of synchronization level was observed as a function of the decrease of inhibitory cells that composed the networks. In fact, inhibitory networks (0:100), which are characterized by tonic activity, showed an average synchronization value of 0.03  0.0003, which was higher than all the other configurations. Focusing on the heterogeneous configurations, there were no appreciable statistical variations between 25:75 and 50:50 (p = 0.05). Instead, 25:75 showed a sync value higher than 75:25 by 4.1% (p = 0.001). A reduction of 1.3% in the level of synchronization was observed between the 50:50 configuration and 75:25 one (p = 0.01). At this point, a sort of plateau in the synchronization of the spiking activity was reached: purely excitatory networks (100:0) had comparable values with the 75:25 ones (p = 0.5) and lower synchronization values than all other configurations. A different behavior was observed at the bursting activity level (figure 7(e)): although not always statistically relevant, an increase in the synchronization value was observed as the excitatory contribution increases, indicating a greater network synchronization (network burst) in cultures with a higher percentage of excitation.
4. Discussions and conclusions
In this study, we presented a human in vitro neuronal system for investigating whether and how the E/I balance affects the electrophysiological activity of hiPSCs-derived neuronal populations during development. We performed recordings of neuronal networks with different proportions of excitation and inhibition, obtained by varying the percentage of glutamatergic and GABAergic neurons (i.e. 0:100, 25:75, 50:50, 75:25, 100:0). To the best of our knowledge, this is the first work showing E/I controlled neuronal cultures longitudinally monitored up to 98 d in vitro, chronically coupled to MEA devices, demonstrating their reliability and thus providing a solid characterization of long-term hiPSCs-derived neuronal networks.
Thanks to the morphological characterization by immunostaining and image analysis, we showed we can steer the nominal E/I ratio within reasonable ranges, demonstrating that we can build up experimental models in which excitation and inhibition ratio is controlled (figure 2). Moreover, by performing the functional connectivity analysis, we showed how the E/I ratios are reflected by significant differences in the percentage of excitatory functional connections within the network (figure 7).
We found that homogeneous (i.e. purely excitatory or inhibitory cultures) configurations showed a different behavior from the heterogeneous ones. Specifically, the fully inhibitory networks exhibited both burst and network burst-free activity (figure 3), in line with previous studies on the rat model of the striatum (Segal et al 2003), a brain structure mainly constituted of inhibitory neurons. The fully excitatory networks exhibited a completely different trend (figure 4). In particular, we observed that the firing rate of the fully excitatory networks is lower (figure 4(e)), bursts are shorter (figure 4(g)), and there is more random spiking (figure 4(h)) with respect to the heterogeneous configurations at DIV 70. Furthermore, the network activity is generally lower, with a decreased NBR and STH amplitude, than the other configurations (figures 5 and 6). The DL analysis further confirmed all the above: by grouping the heterogeneous configurations in a superclass and comparing them with the two homogeneous ones, we reached nearly 100% of classification accuracy (figure S3(c)). Moreover, it is worth noticing that the behavior of the two extreme configurations (i.e. 100:0 and 0:100) is in line with what has been obtained with computational models (Sukenik et al 2021). Indeed, we demonstrated that homogenous networks are not suitable to represent the in vitro physiological activity of neuronal populations.
As for the heterogeneous configurations, we found that the electrophysiological activity of the networks was influenced by the percentage of inhibition in the cultures. Being the inhibitory neurons the main responsible for the packaging of spikes into organized activity (burst), we found that MBR increased when the percentage of inhibition increases, finding a maximum value in the 25:75 configuration (figure 4(f)). Moreover, we proved that inhibition controls the dynamics of the decay phase: inhibition compressed the bursts, leading to a reduction of both bursts (figure 4(g)) and network bursts (figure 5(f)) duration (reducing the decay phase), consistently with what was found in rat models (Baltz et al 2010). This last aspect was confirmed by observing no variation in the rise phase of network burst dynamics and finding statistical differences for the decay phase (figure 6) with minimum values for the configuration with more inhibition (25:75). On the other hand, the NMDA and AMPA receptors, characteristic of excitatory neurons, are the main responsible for the increase of the intra burst frequency (Jyothsna Suresh et al 2016, Teppola et al 2019). In our experimental model, by varying the E/I ratio, we found that significant differences arose in the amplitude of the STH (figure 6) which represents the maximum spiking frequency within network bursts. Increases in the STH peak values were obtained by augmenting the excitation and reaching the maximum value for the configuration 75:25, in line with studies performed on neocortex (Teppola et al 2019) and hippocampal (Jyothsna Suresh et al 2016) rat-derived models. Furthermore, depending on the E/I ratio, the networks showed different STH shapes representing network burst activity (figures 5(a) and 6). An interesting aspect is that, although there were clear trends, there were no significant differences between 75:25 and 50:50 in the MBR, BD, RS, NBR, NBD and tau decay parameters. We further performed a novel deep learning (DL)-based analysis (see section S1 for implementation and details on the method), designing a classifier capable of distinguishing the exhibited dynamics of in vitro neural networks exploiting images of the cumulative STHs as input. The DL analysis, even if based on a different data type with respect to the previous spike-based analysis, confirmed that 50:50 and 75:25 ratios showed a similar dynamic, indistinguishable by the algorithm (figure S3), suggesting a stable dynamic of the neuronal network despite the different inhibitory components. This support the hypothesis of a robust homeostatic behavior that counteracts the E/I variations by balancing E/I connectivity and preserving the E/I equilibrium, whether it is not extremely upset (as in the case of 25:75), in line with previous studies performed on mouse, hiPSCs-derived, and computational models (Sasaki et al 2019, Sukenik et al 2021).
In line with the recent literature (Estévez-Priego et al 2023), we claim that our hiPSCs based neuronal model, in which we can control the E/I ratio, improves some of the current in vitro models (mostly of animal origin) from several points of view and has relevant advantages that will be addressed in the following.
Human vs animal. In previous studies it has been shown that the human-derived in vitro models, particularly the hiPSCs-derived networks, exhibited the typical patterns of activity of the 'gold standard' animal-derived cultures (Napoli and Obeid 2016, Tukker et al 2016, Kasteel and Westerink 2017, Moakley et al 2019). Nevertheless, several dissimilarities are encountered between human- and animal- derived models, such as different phases of the neuronal network maturation (Linaro et al 2019, Hyvärinen et al 2019a), and pathophysiological human-brain-specific aspects not expressed by animal models. This makes the comparison and the translation between the two models (e.g. drug response tests) particularly intricated, especially when related to the study of neurodevelopmental diseases. Differently, hiPSCs-derived neuronal networks showed functional traits closer to the ones of human primary cultures, able to resemble the activity of both in vivo cerebral cortex and cortical slices (Kirwan et al 2015, Estévez-Priego et al 2023), and thus overcoming problems related to species-translation and constituting more faithful scenarios. In addition to that, we need to underline that in our experimental model the in vitro cells are not completely of human origin. Indeed, we exploited human-derived neurons together with rat astrocytes, since the latter are already widely characterized in the literature unlike human astrocytes (Degl'Innocenti and Dell'Anno 2023). Although astrocytes influence the neuronal activity, the electrophysiological signals that we recorded and characterized are obtained from the neuronal cells.
Characterization. HiPSCs-derived networks have not yet been fully characterized from the electrophysiological point of view, particularly when dealing with different ratio of E/I neurons. To date, only few studies have investigated firing and bursting patterns of hiPSCs-derived neuronal cultures (Kirwan et al 2015, Odawara et al 2016a, Tukker et al 2018, Izsak et al 2019, Trujillo et al 2019, Hyvärinen et al 2019a). We reported a full characterization, which includes the analysis of the network events. Indeed, in vitro cultures are characterized by phenomena of synchronized networks (bursts/network bursts), which are crucial for the tuning of the connectivity within the central nervous system, for motor actions, and for cognitive and perceptive functions (Schnitzler and Gross 2005).
Inhibition and heterogeneity. Previous studies typically did not consider the inhibitory component and dealt with purely excitatory networks (Kirwan et al 2015). However, the inhibitory fraction in the cortex and hippocampus is typically from 15% to 30% (Sahara et al 2012): heterogeneity is therefore the best solution against extreme configurations (i.e. 100:0 and 0:100) to approach a physiological condition. Among the various configurations tested in our work, heterogeneity is extensively analyzed with three different E/I ratios, wherein 75:25 is the closest to the in vivo condition in the cortex. We analyzed networks with particular balances, including the 25:75, in which the E/I ratio was completely overturned, up to 0:100. Previous studies considered only a single mixed configuration (i.e. with both glutamatergic and GABAergic neurons) with undefined ratio (Estévez-Priego et al 2023) or different E/I ratios stopping at proportion where the excitatory part predominates, thus without exceeding the limit for which the networks do not compensate the imbalance, leading to not find differences in the electrophysiology of such networks despite the different E/I ratios plated (Sasaki et al 2019).
Long term. Most in vitro electrophysiological studies extract information and get conclusions from temporally limited experiments, with the risk of missing crucial timeframes to understand physiological events (Saalfrank et al 2015, Habibey et al 2022). Since neuronal development is a fundamental aspect to regulate differentiation, apoptosis, and neuronal migration (Zhang and Poo 2001, Spitzer 2006, Kilb et al 2011), and many neurodevelopmental disorders insurge in mature neuronal networks, in our study we showed the long-term evolution of hiPSCs-derived neuronal network during the spontaneous development. Despite few works presented the long-term characterization of hiPSCs-derived neuronal networks (Odawara et al 2016a, Hyvärinen et al 2019a), none of them finely controlled the balance between the excitatory and inhibitory neurons in the cultures. Here, for the first time, we proposed a longitudinal study of five different E/I configurations. We confirmed that, during the development, the networks evolve and mature, requiring many days in vitro to reach a state of full maturation, especially if GABAergic neurons are plated in the cultures. In fact, to carry out a proper investigation, the inhibitory system must reach an appropriate state of maturation, given by the hyperpolarizing shift in the GABA reversal potential. Indeed, this hyperpolarization shift is the key to allow GABAergic neurons to modulate network activity and to establish E/I balance during the network development (Ben-Ari 2002, Akerman and Cline 2006, Ben-Ari et al 2007, Warm et al 2022). The shift of the GABA reversal potential, and thus the maturation of the inhibitory system, has been shown in literature to be between DIV 35 and DIV 49 (Amin et al 2017, Mossink et al 2022). After DIV 49 inhibitory neurons can therefore exert a hyperpolarizing influence on glutamatergic neurons (Isaacson and Scanziani 2011, Sahasranamam et al 2016). Indeed, we found that the maturation steady state of our neuronal networks was reached at DIV 70 (figure S1), compatible with the maturation of inhibition system which has already performed the shift of the GABA reversal potential.
In conclusion, in our work we presented a reliable in vitro brain-on-a-chip system based on hiPSCs-derived neurons, where we were able to precisely control the balance between excitation and inhibition. The cultures were longitudinally monitored and kept healthy for more than 3 months, a time which allowed us to characterize the electrophysiological properties of the networks on a long-time scale. Since a long-term characterization of hiPSCs-derived neuronal networks with different E/I balances, as we proposed, has never been carried out, we decided to perform such an important study in well controlled conditions. Therefore, we worked with the more simplified yet valuable 2D model than a complex 3D network. We can anticipate that this study is the starting point for future development of 3D systems coupled to 3D MEAs.
Given all the above, our experimental model based on in vitro hiPSC-derived neurons has been demonstrated to be robust and suitable for translational studies and precision medicine applications in the field of neurodevelopmental disorders where the E/I ratio is unbalanced.
Acknowledgments
Work supported by #NEXTGENERATIONEU (NGEU) and funded by the Ministry of University and Research (MUR), National Recovery and Resilience Plan (NRRP), project MNESYS (PE0000006)—A Multiscale integrated approach to the study of the nervous system in health and disease (DN. 1553 11.10.2022)
The authors wish to thank the University of Twente, in particular Dr Monica Frega, for kindly supplying the hiPSCs cultures, Dr Mariateresa Tedesco for gently providing rat astrocytes, and Dr Paolo Massobrio for his kind support on the data analysis procedure and useful discussion of the results.
Data availability statement
The data that support the findings of this study are openly available at the following URL/DOI: https://osf.io/sw3br/#:~:text=DOI%2010.17605/OSF.IO/SW3BR.
Ethical statements
The experimental protocol was approved by the European Animal Care Legislation (2010/63/EU), by the Italian Ministry of Health in accordance with the D.L. 116/1992 and by the guidelines of the University of Genova (Prot. 75F11.N.6JI, 08/08/18). We used two previously characterized h-iPSCs lines (Mossink et al 2021). Both lines were generated from fibroblasts. Control line 1 (C1, healthy 30 years-old female) was reprogrammed via episomal reprogramming (Coriell Institute for medical research, GM25256). Control line 2 (C2, healthy 51 years-old male) was reprogrammed via a non-integrating Sendai virus (KULSTEM iPSC core facility Leuven, Belgium, KSF-16-025). We received the h-iPSCs lines in frozen vials by Dr Frega (University of Twente).
We declare that the research was conducted in accordance with the principles embodied in the Declaration of Helsinki and in accordance with local statutory requirements.
We declare that all participants gave written informed consent to participate in the study (Coriell Institute for medical research, GM25256 and KULSTEM iPSC core facility Leuven, Belgium, KSF-16-025).
We declare that the research involves not identifiable human subjects, confirming that participant anonymity is totally protected.
Supplementary data (16.9 MB PDF)