
Abstract
Objective. When multitasking, we must dynamically reorient our attention between different tasks. Attention reorienting is thought to arise through interactions of physiological arousal and brain-wide network dynamics. In this study, we investigated the relationship between pupil-linked arousal and electroencephalography (EEG) brain dynamics in a multitask driving paradigm conducted in virtual reality. We hypothesized that there would be an interaction between arousal and EEG dynamics and that this interaction would correlate with multitasking performance. Approach. We collected EEG and eye tracking data while subjects drove a motorcycle through a simulated city environment, with the instructions to count the number of target images they observed while avoiding crashing into a lead vehicle. The paradigm required the subjects to continuously reorient their attention between the two tasks. Subjects performed the paradigm under two conditions, one more difficult than the other. Main results. We found that task difficulty did not strongly correlate with pupil-linked arousal, and overall task performance increased as arousal level increased. A single-trial analysis revealed several interesting relationships between pupil-linked arousal and task-relevant EEG dynamics. Employing exact low-resolution electromagnetic tomography, we found that higher pupil-linked arousal led to greater EEG oscillatory activity, especially in regions associated with the dorsal attention network and ventral attention network (VAN). Consistent with our hypothesis, we found a relationship between EEG functional connectivity and pupil-linked arousal as a function of multitasking performance. Specifically, we found decreased functional connectivity between regions in the salience network (SN) and the VAN as pupil-linked arousal increased, suggesting that improved multitasking performance at high arousal levels may be due to a down-regulation in coupling between the VAN and the SN. Our results suggest that when multitasking, our brain rebalances arousal-based reorienting so that individual task demands can be met without prematurely reorienting to competing tasks.
Export citation and abstract BibTeX RIS

Original content from this work may be used under the terms of the Creative Commons Attribution 4.0 license. Any further distribution of this work must maintain attribution to the author(s) and the title of the work, journal citation and DOI.
1. Introduction
The reorienting of attention is a crucial requirement of multitasking, for example when driving a vehicle. Driving requires us to shift our attention to different stimuli, such as the vehicle in front, road signs, billboards, or pedestrians on the side of the street. When we reorient our attention to a billboard, we must partially disengage attention from the vehicles in front of us while taking in salient information from the billboard. This process requires the brain to perform an 'attentional balancing act,' where attention is partially directed from the road to the billboard, while avoiding a crash. How the brain's reorienting response facilitates this balance remains an open question.
Brain networks and neural processes involved in attention reorienting have been widely studied over the past few decades (Ponser 1980, Corbetta and Shulman 2002, Corbetta et al 2008). In addition to studying brain dynamics, many studies have also investigated the relationship between pupil-linked arousal and attention reorienting (Murphy et al 2011, Sara and Bouret 2012, Hong et al 2014, Waschke et al 2019, van Kempen et al 2019, Joshi and Gold 2020). Using pre-stimulus baseline pupil diameter as surrogate markers for arousal levels, these studies have reported changes in task performance, attentional engagement, and cortical synchronization as arousal levels increase or decrease (Murphy et al 2011, Hong et al 2014, Waschke et al 2019, van Kempen et al 2019). Several recent studies investigating the relationship between attention reorienting and arousal typically share the same basic experimental paradigm, employing either a simplistic auditory oddball or target discrimination task (Murphy et al 2011, Hong et al 2014, Waschke et al 2019, van Kempen et al 2019). While these tasks are well understood and easily reproducible, they do not represent how humans orient their attention in realistic environments. In particular, they do not represent scenarios in real-world multitasking, such as driving, where arousal may strongly interact with reorienting and attention to one task may degrade the performance in the other task.
Recently, there has been substantial interest in measuring brain dynamics while subjects perform tasks in virtual reality (VR) (for a review see Bohil et al (2011), Choi et al (2023)) with studies investigating cognitive processes from learning to attention. One reason for conducting neuroscience experiments related to attention and reorienting in VR is evidence for it modulating cognitive arousal (Faller et al 2019, Hofman et al 2021, Lapborisuth et al 2022), and physiological evidence for increased activity in neural signatures of executive function (Redlinger and Shao 2021).
In this study, we aimed to characterize the neural dynamics of attention reorienting as a function of pupil-linked arousal for a complex multitasking scenario in an immersive, naturalistic environment. We hypothesized that there would be a relationship between the subject's level of arousal and their brain dynamics of the reorienting responses and that this link would correlate with multitasking performance. To test this hypothesis, we employed an interactive 3D target detection paradigm presented in a VR headset in which the participants had to reorient their attention between two primary tasks (controlling the speed of a vehicle and detecting a target image). Subjects performed two versions of the task, one condition considered 'easy' and one considered 'hard'. To investigate the underlying neural correlates of attention reorienting at different arousal levels, we collected electroencephalography (EEG), eye tracking, and behavioral data from each subject. We then divided the experimental trials two different ways, one based on task difficulty level (easy vs. hard) and another based on the pre-image onset baseline pupil diameter (low vs. high pupil-linked arousal).
We first investigated the difference in behavioral performance measures across the easy and hard and low and high pupil-linked arousal conditions. We utilized overt (target accuracy and number of crashes) and covert (dwell time and reaction time) performance measures to explore how task difficulty and pupil-linked arousal levels affect overall behavioral performance. Interestingly, we found that pupil-linked arousal and task difficulty were not strongly correlated, suggesting that both exogenous and endogenous factors were at play in the variation of pupil-linked arousal. In addition, we observed significant improvement in multitasking performance across low and high pupil-linked arousal conditions but not across the easy and hard task difficulty conditions. This suggested that arousal changes potentially modulated the brain dynamics of multitasking reorienting.
We then conducted several analyses to investigate the interaction between pupil-linked arousal and brain dynamics underlying multitask attention reorienting. First, we investigated the evoked EEG and pupil dilation responses for target and distractor trials in the low and high pupil-linked arousal conditions. We then performed a single-trial analysis of target vs. distractor discrimination to study the task-relevant trial-by-trial correlations between EEG and pupil dilation dynamics. We further investigated the differences between brain dynamics across pupil-linked arousal conditions in the oscillatory and connectivity spaces. The resulting current source density distribution maps were then compared across low and high pupil-linked arousal conditions to define the regions with significantly different oscillatory activity. Lastly, we calculated the differences in functional connectivity between low and high pupil-linked arousal conditions across four major brain networks associated with attention and arousal modulation, namely the salience network (SN), the default mode network (DMN), the dorsal attention network (DAN) and the ventral attention network (VAN). We found decreased functional connectivity between regions in the SN and the VAN as pupil-linked arousal increased. This suggested that improved multitasking performance at high arousal levels may be due to a down-regulation in coupling between the VAN and the SN, supporting our hypothesis and providing evidence that the brain rebalances arousal-based reorienting so that individual task demands can be met without prematurely reorienting to competing tasks.
2. Materials and methods
2.1. Subjects
Twenty-five healthy volunteer subjects (21 male, 4 female, aged 18–40 years old) participated in this study. Subjects reported no neurological illness or medication, and all had normal or corrected to normal vision. Informed consent was obtained in writing from all subjects prior to the experiment in accordance with the guidelines and approval of the Columbia University Institutional Review Board.
2.2. Virtual environment
A customized 3D virtual environment was created specifically for the experiment using Unity3D game development software (Unity Technologies, CA, USA). The environment consists of a simulated city street with buildings placed on the left and right-hand sides (figure 1(b)). Subjects ride down the street on a motorcycle following a vehicle traveling in front. Blank white billboards are placed on the buildings at eye level with the subject. Each billboard has a dimension of 5 m by 5 m and is placed on the building at a distance of 10 m from the center of the street. As the subject approaches each pair of billboards, at a distance of 20 m, an image appears either on the left or on the right billboard. Each image is chosen at random from five different categories—egg, accordion, starfish, guitar, and dice. The images were taken from the THINGS object concept and object image database (Hebart et al 2019). The image remains on the billboard until the subject passes while the other billboard remains white. The environment was presented to the subjects using a Varjo XR3 headset (Varjo Technologies, Helsinki, Finland) at a frame rate of 90 Hz.
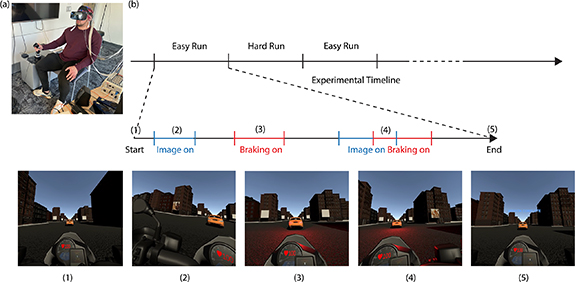
Figure 1. Multitasking target detection paradigm. (a) Experimental setup showing an example subject performing the task in VR while the EEG and eyetracking data were recorded. (b) Experimental timeline showing the progression of the experiment. Each subject performed a total of eight experimental runs—four in the easy condition and four in the hard condition, in randomized order. During each run, the subject was instructed to follow the vehicle in front closely without crashing while also counting the number of target images that appeared on the billboards. Each numbered image represents different stages of the paradigm. (1) The start of the experimental run. (2) When an image appears on the billboard. (3) When the vehicle in front brakes. (4) When both the vehicle in front brakes and an image appears on the billboard. (5) The end of the experimental run. In order to keep the paradigm as naturalistic as possible, the subject was allowed to move their head and eyes naturally throughout the experiment. The view of the paradigm shown in each stage tracked that of the forward-facing direction of the subject's head movement.
Download figure:
Standard image High-resolution image2.3. Immersive multitasking target detection paradigm
Subjects performed an immersive multitasking target detection paradigm during each run of the experiment (figure 1(b)). Riding on a motorcycle down a simulated city street, the subject was instructed to follow the vehicle in front by controlling the speed of the motorcycle using a joystick controller (Hotas Warthog Flight Stick, Thrustmaster, Carentoir, France). The subject was instructed to follow the vehicle closely without crashing or falling too far behind. The vehicle in front was programmed to randomly brake and accelerate throughout each experimental run. Thus, the subject was required to continuously control the speed of the motorcycle to closely match the speed of the vehicle to avoid crashing. If the subject fell too far behind (over 9 m from the vehicle in front), an alarm sound was played to encourage the subject to accelerate and catch up to the vehicle. If the subject crashed into the vehicle or if the alarm sound went off for more than 10 s, the subject was required to restart the run.
In addition to controlling the speed of the motorcycle, the subject was also instructed to count the number of target images that appeared on the billboards. Prior to the start of the experiment, the subject was informed which category of images (e.g. egg, accordion, starfish, guitar, or dice) was the target category and that the rest were considered distractor categories. The subject was instructed to count the number of target images displayed during each experimental run and to report the final count to the experimenter at the end of each run. A total of 40 images were displayed during each experimental run with approximately 1 in 4 being target images. Each run lasted approximately four and a half minutes. In order for the task to be as naturalistic as possible, the subject was allowed to move their head and eye naturally in order to observe the images displayed on the billboards.
Each subject performed the immersive multitasking target detection paradigm under two conditions—easy and hard. In both conditions, both the vehicle in front and the subject's motorcycle began driving at a constant speed of 15 m s−1. During the easy condition, the vehicle in front brakes and accelerates at a normal pace (0.3 m s−2), mimicking that of a typical driving scenario. While during the high arousal condition, the vehicle in front brakes and accelerates at an unusually fast pace (0.6 m s−2), mimicking that of a road rage scenario (Zhang et al
2016). In both conditions, the duration in which the vehicle brakes and accelerates is chosen at random ( s). In order to keep the differences between the two conditions down to a minimum, only the braking rate of the vehicle was modulated while other factors such as the driving speed (15 m s−1) and braking frequency (0.2 probability of braking per second) were kept constant in both conditions. Each subject performed four easy runs and four hard runs (eight in total). The order of the runs was randomized for each individual subject prior to the start of the experiment.
2.4. Data acquisition
EEG data were collected using a Biosemi ActiveTwo amplifier (Biosemi, Amsterdam, The Netherlands) with 64 Ag/AgCl electrodes at a sampling rate of 2048 Hz. The electrodes were placed according to the international 10–20 system. Two additional ECG electrodes were placed on the subject's chest, one underneath the collarbone towards the left shoulder and one underneath the collarbone towards the center of the chest. All electrode impedances were kept below 30 kΩ and a common average reference (CAR) was used. Eye-tracking data was collected using a built-in Varjo eye-tracker inside the Varjo XR3 headset (Varjo Technologies, Helsinki, Finland). Pupil diameter, gaze position, and focal distance information were collected at a sampling rate of 200 Hz. A five-point calibration was performed using the Varjo base software prior to any data collection from the eye-tracker. A customized data collection software 'ReNa' was developed based on the open-sourced data streaming platform lab streaming layer (Kothe 2013) in order to synchronize and record all of the data streams together.
2.5. Data preprocessing
Pupillometry data were preprocessed using customized Matlab scripts (The MathWorks, MA, USA). Blinks were identified and removed from the pupil diameter data based on the validity signal from the eye-tracker. Missing pupil data, for example during eye blinks, were interpolated using linear interpolation, and a moving average of 50 data points (0.25 s) was performed to smooth out inconsistencies in the recorded data. Pupil diameter data from each subject were then concatenated and standardized across all experimental runs. Pupil diameter epochs were extracted from −1000 ms to 3000 ms locked to image onset.
EEG data were preprocessed using customized Matlab scripts and with built-in EEGLAB functions (Delorme and Makeig 2004). EEG data were band-pass filtered between 0.5 and 50 Hz and downsampled to 256 Hz. Channel removal was performed via visual inspection. The remaining EEG data were re-referenced using a CAR. Independent component analysis (ICA) was performed to remove components associated with blinks and horizontal eye movements. Following ICA removal, missing data channels were interpolated. EEG data epochs were then extracted from −500 to 2000 ms locked to image onset. Baseline correction was performed using data from −200–0 ms prior to image onset.
2.6. Behavioral and neural data splits
We split our data into halves based on two different measures—task difficulty and pupil-linked arousal level. For task difficulty split, the trials were split based on the experimental conditions (i.e. easy or hard). For pupil-linked arousal split, the trials were split based on the baseline pupil diameter calculated using standardized mean pupil diameter value from −1000 ms to 0 ms prior to image onset. The trials with mean pupil diameter values lower than the subject's median were considered low arousal trials figure 2. The trials with a mean pupil diameter value higher than the subject's median were considered high arousal trials. The pupil dilation and EEG event-related potential (ERP) results were calculated by taking a mean of the pupil diameter epochs and EEG data epochs over all trials within each condition for each subject.

Figure 2. Block diagram summary of data analysis steps. We begin by splitting the preprocessed behavioral, pupil, and EEG data into low and high pupil-linked arousal conditions. We then calculate overt and covert behavioral measures for each pupil-linked arousal condition, namely target accuracy and number of crashes for overt measures and dwell time and reaction time for covert measures. We also calculate the mean pupil dilation and event-related potentials (ERPs), which are then fed into the hierarchical discriminant component analysis (HDCA), oscillatory power analysis, and functional connectivity analysis. The HDCA leads to the area under the receiver operating characteristic curve (AUC) results and the discriminating components used to plot the forward models. The oscillatory power analysis leads to the current source density results. Lastly, the functional connectivity analysis leads to the lagged phase synchronization results across different brain networks.
Download figure:
Standard image High-resolution image2.7. Behavioral performance measures
We investigated a total of four different behavioral performance measures in this study. The two overt behavioral performance measures we investigated are target accuracy and a number of crashes, both of which are the main objectives of the multitasking paradigm. The overt behavioral performance measures for the easy and hard conditions were calculated based on the experimental condition in which each subject performed the run. To calculate the overt behavioral performance measures for the low and high pupil-linked arousal conditions, the mean pupil baseline value across all trials in each run was used to assign each run into low or high arousal condition for that subject. We further investigated two additional covert behavioral performance measures related to the task: dwell time and reaction time. These two measures are used to explore the strategies employed by the subjects during multitasking. Dwell time was calculated as the time during each trial in which the subject's gaze fell within 20∘ of the center of the billboard image. Reaction time was calculated as the amount of time the subject took to slow down once the car in front started braking. To split the reaction time into low and high arousal conditions, the pupil baseline value of that trial during which the braking took place was used. Lastly, to calculate the difference between reaction time and dwell time as a function of pupil-linked arousal, we assigned each reaction time to each dwell time using the closest onset of the braking period after an image was presented on the billboard. We then split the pupil baseline value for each subject into quintiles and calculated the difference between reaction time and dwell time across all trials in that quintile.
2.8. Hierarchical discriminant component analysis (HDCA) and forward models
HDCA (Jangraw et al 2014) was performed on the epoched EEG and pupil dilation data to obtain single-trial target vs. distractor discriminating components and their corresponding EEG forward models. HDCA was performed on 0–1000 ms of epoched EEG data and 0–3000 ms of epoched pupil dilation data locked to image onset for the low and high arousal conditions. The discriminating components and forward models were computed as described in Lapborisuth et al (2022). In short, the epoched EEG data were input into dimension reduction methods, namely principal component analysis followed by ICA before being divided into ten, 100 ms, bins. Fisher linear discriminant analysis (FLDA) was performed on each bin to determine the within-bin weights across independent components (ICs):

where wj
is the vector of within-bin weights for bin j,  and
and  are the mean and covariance of the EEG data in the current bin, and + and − subscripts refer to target and distractor trials, respectively. The weights wj
were then applied to the IC activations
are the mean and covariance of the EEG data in the current bin, and + and − subscripts refer to target and distractor trials, respectively. The weights wj
were then applied to the IC activations  to determine the within-bin interest score (e.g. discriminating component) zji
for each bin i and each trial j:
to determine the within-bin interest score (e.g. discriminating component) zji
for each bin i and each trial j:
By concatenating the within-bin interest scores and the input EEG data across trials, the forward model for each 100 ms bin can be calculated and plotted onto a scalp map to visualize the contributions of each EEG data channel to the discriminating components. For cross-bin classification, logistic regression was applied to the second-level feature vector zi for each trial to determine the cross-bin weights v:
where ci denotes the class (+1 for targets and −1 for distractors) for trial i. The cross-bin weights were then used to calculate the final single cross-bin interest score (e.g. discriminating component) yi for each trial:

Ten-fold cross-validation was used to create the training and testing sets. The area under the receiver operating characteristic (ROC) curve (AUC) was used to quantify the performance of the classifier. Similarly, the pupil dilation data were divided into six, 500 ms bins before FLDA was performed to determine the within-bin interest scores and lastly, logistic regression was performed to determine the final discriminating component for each trial.
2.9. Current source density and functional connectivity analysis
The analysis of EEG oscillatory source signal known as 'current source density' was performed using the exact low-resolution brain electromagnetic tomography (eLORETA) method built into the latest LORETA-KEY software (Pascual-Marqui et al 1994, 2011, Pascual-Marqui 1999). eLORETA is a linear inverse solution method that can reconstruct cortical activity using surface EEG data with zero localization error (Pascual-Marqui et al 2011). It utilizes a three-shell spherical head model along with EEG electrode coordinates registered to the Talairach atlas to produce a 3D solution in the cortical gray matter space, divided into 6239 voxels, with a resolution of 5 mm3. The resulting 3D images correspond to the cortical distribution of the oscillatory sources of the electrical activity in different frequency bands. In this study, we computed eLORETA images using the epoched EEG data from 0 to 2000 ms for low and high arousal trials in eight frequency bands: delta (2–4 Hz), theta (4–8 Hz), alpha 1 (8–10 Hz), alpha 2 (10–13 Hz), beta 1 (13–16 Hz), beta 2 (16–20 Hz), beta 3 (20–30 Hz) and gamma (30–60 Hz).
The LORETA software was also used to calculate functional connectivity measures using a voxel-wise approach across different regions-of-interest (ROIs). The connectivity measure used is known as 'lagged-phase synchronization' which measures the similarity between signals in frequency domains based on normalized Fourier transforms (Pascual-Marqui et al 2011). Lagged-phase synchronization is considered to be a nonlinear functional connectivity measure that represents the connectivity of two signals after excluding the instantaneous zero-lag component and is thus considered to only represent physiological connectivity information (Pascual-Marqui et al 2011). We specified 24 ROIs as defined in table 1. The ROIs were selected based on previous literature surrounding functional connectivity of brain networks associated with attention orienting and arousal (Zhou et al 2018, Bernard et al 2020). These networks include the DMN, SN, DAN, and VAN.
Table 1. MNI coordinates of ROIs used in LORETA functional connectivity analysis.
| Network | Region | X | Y | Z |
|---|---|---|---|---|
|
DMN | Posterior cingulate cortex | −3 | −57 | 21 |
| DMN | Anterior medial prefrontal cortex | 3 | 54 | 18 |
| DMN | Left angular gyrus | −48 | −69 | 33 |
| DMN | Right angular gyrus | 51 | −63 | 27 |
| SN | Dorsal anterior cingulate cortex | −3 | 15 | 42 |
| SN | Left anterior insula | −36 | 15 | 6 |
| SN | Right anterior insula | 33 | 18 | 6 |
| SN | Left anterior prefrontal cortex | −27 | 45 | 30 |
| SN | Right anterior prefrontal cortex | 30 | 42 | 30 |
| DAN | Left frontal eye field | −24 | −9 | 57 |
| DAN | Right frontal eye field | 27 | −3 | 54 |
| DAN | Left inferior frontal gyrus | −51 | 9 | 27 |
| DAN | Right inferior frontal gyrus | 54 | 12 | 30 |
| DAN | Left inferior parietal sulcus | −42 | −36 | 45 |
| DAN | Right inferior parietal sulcus | 39 | −42 | 51 |
| VAN | Right superior temporal gyrus | 63 | −16 | 49 |
| VAN | Right middle temporal gyrus | 62 | −46 | 6 |
| VAN | Right inferior temporal gyrus | 54 | −22 | 18 |
| VAN | Right frontal inferior gyrus (pars orbitalis) | 48 | 27 | −8 |
| VAN | Right frontal inferior gyrus (pars orbitalis) | 54 | 26 | −12 |
| VAN | Right frontal inferior gyrus (pars triangularis) | 46 | 20 | 18 |
| VAN | Right precentral gyrus | 48 | 6 | 51 |
| VAN | Right middle frontal gyrus | 45 | 9 | 46 |
| VAN | Left frontal inferior gyrus | −45 | 17 | 19 |
Abbreviations. DMN = default mode network, SN = salience network, DAN = dorsal attention network, VAN = ventral attention network. a Note. Data are from Zhou et al (2018). b Bernard et al (2020).
Statistical analysis on the current source density data was performed using a statistical nonparametric mapping method known as Fisher's permutation test (Holmes et al 1996, Nichols and Holmes 2002), built into the LORETA software. The localized cortical activity in each frequency band was compared across the low and high arousal conditions using voxel-by-voxel independent F-ratio tests based on log-transformed current source density data. Voxels that reach statistical significance were identified via Fisher's permutation method with 5000 data randomizations to create the critical probability threshold of p < .05 using maximal statistics. We performed similar comparisons across conditions to determine statistical differences in the lagged phase synchronization between the 24 ROIs in each frequency band. Independent t-tests were performed across all 24 ROIs (276 connections) and 8 frequency bands (276 × 8 = 2208 tests). To correct for multiple comparisons, Fisher's permutation method with 5000 data randomizations and a probability threshold of p < .05 was also used.
3. Results
3.1. Behavioral performance results
We first evaluated the overt behavioral performance measures of the interactive target detection task, namely target accuracy and number of crashes. When looking at target accuracy as a function of experimental conditions, subjects performed the target detection task with a similar level of accuracy in both the easy  and hard
  conditions (M = mean, SD = standard deviation) (figure 3(d)). However, the total number of crashes was higher in the hard condition (29 times total across all subjects) compared to in the easy condition (3 times total across all subjects) (figure 3(c)). These results suggest that as task difficulty increases, subjects' performance decreases in one task (crashing more often) but not the other (detecting target images). On the other hand, when looking at target accuracy as a function of arousal levels, subjects performed significantly better in the high arousal condition
  compared to the low arousal condition
  ,
,  , p < .05 (figure 3(d)). Additionally, the total number of crashes was lower for the high arousal condition (14 times total across all subjects) compared to the low arousal condition (18 times total across all subjects) (figure 3(c)). These results suggest that as pupil-linked arousal level increases, subjects' performance increases in both tasks (crashing less often and detecting target images more accurately). Taken together, these results suggest that we only observe significant improvements in multitasking performance when looking at behavioral performance as a function of pupil-linked arousal but not as a function of task difficulty. Furthermore, these results also suggest that pupil-linked arousal level does not directly correlate with each experimental condition. We further investigated this hypothesis by calculating the percentage of easy and hard trials in the low and high arousal conditions. We indeed found that both the low and high arousal trials are represented by a mixture of easy and hard trials (figures 3(a) and (b)), confirming our hypothesis that pupil-linked arousal and task difficulty do not directly correlate with each other.
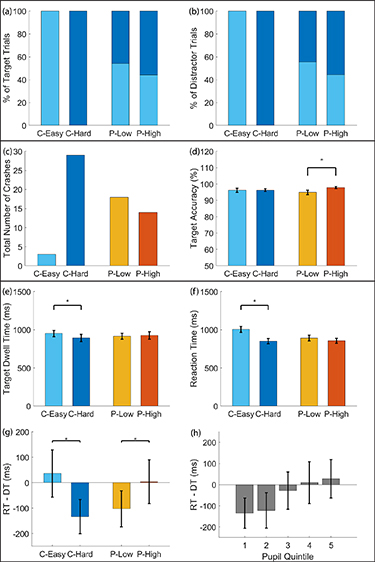
Figure 3. Behavioral performance results. (a) Percentage of target trials in each condition as represented by task difficulty level. (b) Percentage of distractor trials as represented by task difficulty level. (c) Total number of crashes by all subjects. (d) Mean target accuracy. (e) Mean target dwell time. (f) Mean reaction time. (g) Mean difference in reaction time and dwell time. (h) Mean difference in reaction time and dwell time by baseline pupil quintile. Error bars represent standard error of the mean. Black asterisks indicate significant mean differences across conditions (Student's paired t-test, p < .05). Figures (c) and (d) represent overt behavioral performance measures whereas (e)–(h) represent covert behavioral performance measures.
Download figure:
Standard image High-resolution imageIn order to better understand the multitasking strategy employed by the subjects, we further investigated two covert behavioral performance measures related to the driving task (reaction time) and the target detection task (dwell time). We found that when trials were divided based on experimental conditions, the reaction time and dwell time on target images are both significantly shorter in the hard condition ( ms and
  ms) compared to in the easy condition (
 ms and
  ms),
ms),  , p < .001 and
  , p < .05, respectively (figures 3(e) and (f)). However, we found no significant differences when trials were divided based on pupil-linked arousal (figures 3(e) and (g)). These results suggest that for subjects to improve their overall multitasking performance as a function of pupil-linked arousal, there is a trade-off between how long one dwells on the target image on the side of the road and how long one takes to react to a braking vehicle in front. We conducted further analysis of the covert behavioral performance by subtracting dwell time from reaction time both as a function of experimental conditions and pupil-linked arousal. We found that the difference in dwell time and reaction time was significantly different across both the easy (
 ms) and hard (
 ms) conditions,
  , p < .05, and the low (
 ms) and high (
 ms) pupil-linked arousal conditions,
  , p < .05 (figure 3(g)). However, since we only observed significant improvements in multitasking performance across the pupil-linked arousal conditions but not across task difficulty conditions, we focused our further analyses of brain dynamics on its relationship to pupil-linked arousal. We hypothesized that if subjects performed better at higher pupil-linked arousal levels, there would be a systematic trade-off between reaction time and dwell time since in order to reduce the number of crashes and maintain target detection accuracy, the subjects would need to dwell less and react quicker (i.e. reduce the dwell time relative to reaction time for braking). By dividing the trials into quintiles based on pupil baseline values, we found a systematic relationship between the difference in reaction time and dwell time and the level of pupil-linked arousal (ordinal logistic regression, p < .001) (figure 3(h)), suggesting a change in attention reorienting strategy as pupil-linked arousal level increases.
3.2. ERPs and pupil dilation results
To investigate the differences in neural correlates of attention reorienting in the low and high pupil-linked arousal conditions, we first calculated the mean ERPs and evoked pupil response for target and distractor trials (figure 4). For the evoked pupil response, we observed a much greater overall increase in pupil diameter for both target and distractor trials in the low pupil-linked arousal conditions compared to the high pupil-linked arousal conditions. This result is consistent with previous literature reporting greater evoked pupil response during low pupil baseline diameter and diminished evoked pupil response during high pupil baseline diameter (Murphy et al 2011, Hong et al 2014, van Kempen et al 2019). For both target and distractor trials and in high and low pupil-linked arousal conditions, we observed two distinct peaks, one at approximately 500 ms and another at approximately 1700 ms following image onset. The first peak shows approximately the same amplitude for both target and distractor trials, whereas the second peak shows a higher amplitude for target trials. This is consistent with previous literature describing the earlier peak as a result of ocular artifacts due to large saccades made by the subjects to observe the images on the billboard (Brisson et al 2013, Mathôt et al 2018) whereas the second peak is the result of pupil dilation associated with recognizing target objects (Jangraw et al 2014, Lapborisuth et al 2022). For the ERP results, we observed similar evoked potential patterns for the low and high pupil-linked arousal conditions for each of the three midline electrodes (Fz, Cz and Pz) (figure 4(b)). The most noticeable differences between target and distractor trials are observed in the Cz and Pz electrodes at approximately 300–1000 ms following image onset. This is consistent with the P300 signal observed in other target detection paradigms (Murphy et al 2011, Hong et al 2014, Jangraw et al 2014, Lapborisuth et al 2022). However, it is important to point out the greater temporal spread of the P300 signal in the current work when compared to the conventional P300 signal. This is likely due to the design of the paradigm in which subjects are required to reorient their attention from one primary task (the driving task) to another (the target detection task), resulting in a greater temporal spread of the orienting signal. A similar result was observed in our earlier work with a similar experimental setup (Lapborisuth et al 2022).

Figure 4. Pupil dilation and EEG event-related potential (ERP) results. Grand average (a) standardized pupil dilation and (b) EEG ERPs for the Fz, Cz and Pz electrodes across all subjects (N = 25), where t = 0 indicates the time of stimuli onset. Shaded regions represent the standard error of the mean while the dotted black line represents the difference between the mean value for target and distractor trials. The bar graphs represent the grand average baseline pupil diameter values from −1000 to 0 ms for targets (red) and distractor (blue) trials. The left column represents the low pupil-linked arousal condition whereas the right column represents the high pupil-linked arousal condition.
Download figure:
Standard image High-resolution image3.3. HDCA and forward model results
We further investigated the differences in brain dynamics involved in attention reorienting across conditions by performing a single-trial target vs. distractor analysis (HDCA) on the epoched EEG and pupil dilation data. The mean AUC results for the EEG and pupil dilation classifiers are shown in figure 5(a). The performance of the EEG classifiers is comparable across the low ( ) and high (
 ) pupil-linked arousal conditions (figure 5(a)). Similarly, the performance of the pupil dilation classifiers is also comparable across the low (
 ) and high (
 ) pupil-linked arousal conditions (figure 5(a)). To further investigate the relationship between task-relevant EEG and pupil dynamics, we calculated the correlations between the EEG and pupil dilation discriminating components for each condition. The correlation values for both the low and high pupil-linked arousal conditions were significantly greater than zero (
 and
and  , respectively) (figure 5(b)). This result suggests that there exists a correlation between single-trial EEG and pupil dilation task-relevant activity when trials are split by pupil-linked arousal.

Figure 5. Hierarchical discriminant component analysis (HDCA) results. (a) The mean area under the ROC curve (AUC) across all subjects (N = 25) for the EEG classifier and the pupil dilation classifier. (b) The mean correlation coefficients between the EEG and pupil dilation discriminating components across all subjects (N = 25). Error bars represent the standard error of the mean. Black asterisks represent significant mean differences from zero (Student's one-sample t-test p < .05).
Download figure:
Standard image High-resolution imageWhen plotting the head topography map of the forward models (figure 6), we observed similar discriminating activity in the parietal regions from 600 to 1000 ms post stimuli onset for both the low and high pupil-linked arousal conditions (figure 6 Top). These results correspond to those of the ERP results previously reported (figure 4(b)). The strong positive activity in the parietal sites also matches that of the typical P300 activity (Hong et al 2014, Jangraw et al 2014, Lapborisuth et al 2022). When looking at differences across the low and high pupil-linked arousal conditions, we observed slight positive activity in the frontoparietal regions centering at approximately 600–1000 ms post stimuli onset (figure 6 Bottom).

Figure 6. Forward model results. Mean forward models of the EEG discriminating components for each 100 ms bin following stimuli onset. (Top) The mean forward models for the low and high pupil-linked arousal conditions. (Bottom) The mean forward model differences between the low and high pupil-linked arousal conditions. The color bar represents the level of mean relative neural activity at each electrode across each time interval.
Download figure:
Standard image High-resolution image3.4. Current source density and functional connectivity results
In order to better investigate the differences in the neural dynamics underlying attention reorienting in the oscillatory source space, we compared the LORETA current source density results for all trials (targets + distractors) across the low and high pupil-linked arousal conditions. We found significantly higher LORETA current source density in the high arousal condition in the delta, theta, alpha 2, beta 2 and gamma bands (figure 7). The regions that showed significantly higher current source density includes the superior temporal gyrus (STG), the frontal eye fields (FEFs), the anterior cingulate cortex (ACC), the anterior prefrontal cortex (aPFC), the orbitofrontal cortex (OFC) and the middle frontal gyrus (MFG). The complete list of regions for each frequency band can be found in the supplementary material section. This result suggests that there is an overall increase in oscillatory activity across wide-ranging frequency bands and brain regions as pupil-linked arousal increases.
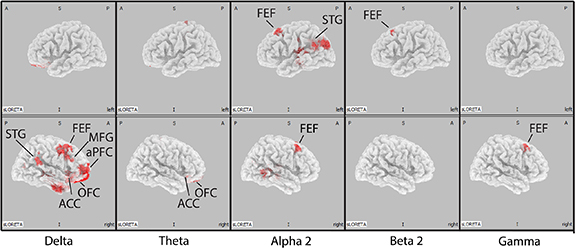
Figure 7. Current source density results. Shaded regions (in red) show significantly higher current source density in the high arousal condition compared to the low arousal condition in the delta (2–4 Hz), theta (4–8 Hz), alpha 2 (10–13 Hz), beta 2 (16–20 Hz) and gamma (30–60 Hz) bands. Abbreviation: FEFs = frontal eye fields, STG = superior temporal gyrus, MFG = middle frontal gyrus, aPFC = anterior prefrontal cortex, OFC = orbitofrontal cortex, ACC = anterior cingulate cortex.
Download figure:
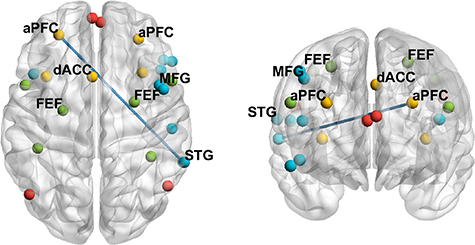
Standard image High-resolution imageNext, we utilized 'lagged phase synchronization' to compare the level of functional connectivity between 24 ROIs (table 1) across the low and high pupil-linked arousal conditions. While we did not find any significant differences across low and high pupil-linked arousal conditions when compared across all trials, we found significantly lower lagged phase synchronization between the left aPFC and the right STG in the alpha 1 band in the high arousal condition compared to the low arousal condition when compared across target trials only (figure 8). The left aPFC is part of the SN whereas the right STG is part of the VAN (table 1). Together, these results suggest that while the overall oscillatory activity may increase as pupil-linked arousal increases, there may also be a decrease in functional connectivity levels across different brain networks as pupil-linked arousal increases.
Figure 8. Functional connectivity results. Blue lines showing significantly lower 'lagged phase synchronization' in the alpha 1 band between the left anterior prefrontal cortex (aPFC) and the right superior temporal gyrus (STG) in the high arousal condition compared to the low arousal condition when compared across target-only trials. Colored spheres represent regions of interest (ROIs) of the four different brain networks—red = default mode network (DMN), yellow = salience network (SN), green = dorsal attention network (DAN) and blue = ventral attention network (VAN). A complete list of ROIs and their corresponding MNI coordinates can be found in table 1. Abbreviation: FEFs = frontal eye fields, MFG = middle frontal gyrus, OFC = orbitofrontal cortex, dACC = dorsal anterior cingulate cortex.
Download figure:
Standard image High-resolution image
4. Discussion
The current study explored the relationship between pupil-linked arousal and neural dynamics underlying attention reorienting in a multitasking paradigm performed in VR. We found that multitasking performance and differences in subjects' reorienting strategy could be indexed by pupil-linked arousal. Further investigation into EEG oscillatory source analysis via eLORETA showed higher current source density in high pupil-linked arousal trials compared to low pupil-linked arousal trials across most frequency bands in regions traditionally associated with the DAN and VAN. Functional connectivity analysis across brain networks showed a decrease in connectivity levels across the SN and VAN in the alpha band, suggesting that decoupling of the two networks might be the mechanism by which brain dynamics change to maintain, and even improve, multitask performance at high levels of arousal.
4.1. Attention reorienting and arousal modulation in an immersive environment
While a number of previous studies have explored the relationship between attention reorienting and pupil-linked arousal (Murphy et al 2011, Sara and Bouret 2012, Hong et al 2014, Waschke et al 2019, van Kempen et al 2019, Joshi and Gold 2020), they typically employed standard oddball or target discrimination tasks (Murphy et al 2011, Hong et al 2014, van Kempen et al 2019), which do not represent how humans reorient their attention in real-world situations. For example, when we drive a car, we have to constantly monitor our surroundings and reorient our attention between the car in front and various objects in the environment, such as road signs, pedestrians, or other emergency vehicles. This requires constant multitasking and reorienting of attention between different stimuli. By employing the use of VR, we were able to better replicate such a situation and presented it to the subjects in an immersive and interactive environment. While recent studies have begun using VR as a tool to present immersive paradigms to the subjects (Hofman et al 2021, Tian et al 2021, Lapborisuth et al 2022), our current work is novel in employing multitasking in an immersive environment. Additionally, we also had subjects perform the task under two different task difficulty levels, namely easy and hard. Previous studies typically measured the changes in pupil-linked arousal under only a single experimental condition (Murphy et al 2011, Hong et al 2014, van Kempen et al 2019). While our results demonstrate that task difficulty and pupil-linked arousal are not directly correlated (figures 3(a) and (b)), the immersive multitasking target detection paradigm employed in the current study still succeeds in modulating the level of pupil-linked arousal across different trials of the experiment.
4.2. Task performance variations when sorted by task difficulty vs. by pupil-linked arousal
Arguably the most notable theory relating task performance and arousal level is the adaptive gain theory of locus coeruleus-norepinephrine (LC-NE) function proposed by Aston-Jones and Cohen (2005). LC is a small nucleus located in the dorsal pons inside the brainstem. It is the main source of cortical NE and has projections throughout the cerebral cortex. Traditional studies have linked LC to the control of both attention and arousal (Aston-Jones and Cohen 2005, Corbetta et al 2008, Sara and Bouret 2012, Bast et al 2018). LC exhibits two types of activity known as tonic and phasic modes. The adaptive gain theory states that tonic LC activity, represented by pupil-linked arousal, modulates the trade-off between task exploitation and exploration in a manner similar to that of the Yerkes–Dodson arousal curve (Aston-Jones and Cohen 2005). A low level of tonic LC activity is associated with an unaroused state and disengagement from the environment whereas high tonic activity is associated with non-commitment to a task and exploratory behaviors of the environment (Aston-Jones and Cohen 2005, Corbetta et al 2008). Meanwhile, moderate LC tonic activity is associated not only with high focus on relevant tasks and stimuli but also the strongest level of phasic LC activity, resulting in optimal task performance (Aston-Jones and Cohen 2005, Corbetta et al 2008, Murphy et al 2011).
In the current study, we investigated the effects of task difficulty and pupil-linked arousal levels on task performance (figure 3). We observed significant improvements in the overt behavioral performance measures as pupil-linked arousal increased but not as task difficulty increased. These results suggest that the relationship between task difficulty and pupil-linked arousal is not linear. In addition, we also observed a systematic trade-off between the two covert behavioral measures related to multitasking as pupil-linked arousal levels increased. These behavioral performance results we observed may first appear at odds with the adaptive gain theory. One possible explanation is that since we initially only split trials into low and high pupil-linked arousal conditions, our results may not cover the entire range of tonic LC activity levels. It is possible that while our low pupil-linked arousal condition results in low tonic LC activity, our high pupil-linked arousal condition may only result in moderate tonic LC activity. The increase in task performance from low and to moderate tonic LC activity as observed in the current study would therefore be in line with the adaptive gain theory. Another possible explanation for the behavioral results we observed is the multitasking nature of our experimental paradigm. While previous studies typically reported optimal performance at a moderate level of pupil-linked arousal, they employed an experimental paradigm with a single and more simplistic task (Murphy et al 2011, Faller et al 2019) in comparison to the paradigm employed in the current study. Considering that multitasking requires the subjects to constantly explore the surrounding environment and balance the trade-offs between two or more tasks (Janssen et al 2011, Farmer et al 2018), the increase in overall performance observed in the current study is in fact consistent with the adaptive gain theory suggesting that high pupil-linked arousal is associated with non-commitment to a task and exploratory behaviors of the environment (Aston-Jones and Cohen 2005).
4.3. Relationship between EEG and pupil dynamics during attention reorienting
Pupil diameter is one of the main psychophysiological markers of the LC-NE system (Joshi et al 2016, Joshi and Gold 2020). It has been suggested that pupil diameter is an index for both the tonic and phasic LC activity (Gilzenrat et al 2010, Murphy et al 2011). While baseline pupil diameter has been associated with tonic LC activity (Rajkowski et al 1993), acute pupil dilation has been associated with phasic LC activity and the reorienting of attention, such as during target detection or oddball tasks (Gilzenrat et al 2010, Murphy et al 2011, Hong et al 2014). Recent studies have shown an association between baseline pupil diameter and various attention-related neural and physiological measures, including the P300 response and phasic pupil dilation (Murphy et al 2011, Hong et al 2014, van Kempen et al 2019). P300 is an ERP component measured via EEG over the centro-parietal regions that peak around 300–500 ms following the presentation of a task-relevant stimulus (Pritchard 1981). P300 demonstrates many similarities to that of the phasic LC response as they both show an enhanced response to behaviorally-relevant stimuli compared to distractors (Corbetta et al 2008). Murphy et al (2011) reported an inverted U-shape relationship between baseline pupil dilation and the P300 response. On the other hand, a negative linear relationship between baseline pupil diameter and phasic pupil dilation has been observed in multiple human studies (Gilzenrat et al 2010, Murphy et al 2011, Hong et al 2014, van Kempen et al 2019). While these studies did not find a direct relationship between the P300 response and phasic pupil dilation, a more recent study found a positive relationship between pupil dilation and the consistency of the centro-parietal positivity, a neural measure related to perceptual decision-making similar to that of the P300 signal (van Kempen et al 2019).
In our study, we investigated the relationship between baseline pupil diameter and attention-reorienting-related measures by splitting the trials into low and high pupil-linked arousal conditions. The similarity between the shape and latency of the P300 response observed in the low and high pupil-linked arousal conditions (figure 4(b)) of the current study is consistent with the similarity between the P300 amplitude of the top and bottom pupil diameter quintiles reported in Murphy et al (2011). Similarly, the diminished pupil dilation response in the high pupil-linked arousal condition (figure 4(a)) is consistent with the negative linear relationship between pre-stimulus pupil diameter and pupil dilation response observed in multiple previous studies (Gilzenrat et al 2010, Murphy et al 2011, Hong et al 2014, van Kempen et al 2019). Our single-trial target vs. distractor analysis revealed that while both the EEG and pupil dilation contain task-relevant information, they do not differ based on pupil-linked arousal level (figure 5(a)). While this result is consistent with the similar shape and latency of the EEG ERP response across the two conditions, the comparable AUC results for the pupil dilation data across the two conditions suggest that the diminished pupil dilation in the high pupil-linked arousal condition still contains a similar level of task-relevant information as that of the pupil dilation data in the low pupil-linked arousal condition. We believe this is the first time this finding has been reported. Additionally, our correlation analysis between the discriminating components of the EEG ERP and pupil dilation response did not reveal any significant differences between the low and high pupil-linked arousal conditions, consistent with findings reported by Murphy et al (2011) and Hong et al (2014). When looking at mean head topographies of the task-relevant EEG components, we observed the expected positive activity in the parietal regions for both low and high pupil-linked arousal conditions at approximately 600–1000 ms following stimuli onset, matching that of the ERP results. However, the difference plot revealed higher frontoparietal activity in the high pupil-linked arousal condition (figure 6). This result is consistent with evidence for higher activity in the ACC during periods of higher arousal (Ebitz and Platt 2015, Joshi et al 2016). Together, these results suggest that the task-relevant EEG dynamics vary as arousal level varies, driving our subsequent analysis of attention reorienting as a function of pupil-linked arousal.
4.4. EEG oscillatory activity and functional connectivity as a function of pupil-linked arousal
Numerous studies have previously linked the level of arousal and attention reorienting to changes in spectral power and connectivity levels between different networks within the brain (Proskovec et al 2018, Schubring and Schupp 2019, 2021, Kim et al 2021, Podvalny et al 2021, Pfeffer et al 2022). The majority of studies focused on investigating the effects of emotional arousal on oscillatory brain activity (Schubring and Schupp 2019, 2021, Kim et al 2021). These studies typically reported differences in the alpha and beta band power across different levels of emotional arousal (Schubring and Schupp 2019, 2021, Kim et al 2021). More recent studies have begun investigating the effects of pupil-linked arousal on the changes in spectral signature and cortical network synchronization across wide-ranging frequencies as related to sensory behavior and perceptual decision-making (Waschke et al 2019, Podvalny et al 2021, Pfeffer et al 2022). Podvalny et al (2021) reported covariations between pupil-linked arousal and spectral power across large-scale cortical networks in a magnetoencephalography study. Different frequency bands were found to have a different relationship with pupil-linked arousal. While delta generally showed a negative relationship with pupil-linked arousal, theta demonstrated an inverted U-shape relationship whereas alpha, beta, and gamma showed an overall positive relationship with pupil-linked arousal. Similar changes across different frequency bands were reported in Pfeffer et al (2022). In a separate study focusing on the effects of attention reorienting on the dynamics of oscillatory activity and functional connectivity, it was found that attention reorienting resulted in an increase in theta band activity and a decrease in alpha and beta band activity within the regions associated with the DAN and VAN (Proskovec et al 2018). It was also reported that functional connectivity within the DAN was higher following invalid target presentation compared to following valid target presentation (Proskovec et al 2018).
Employing eLORETA, we investigated the differences in oscillatory activity between low and high pupil-linked arousal conditions across all 6239 voxels within the brain. We found significantly higher current source density in the high pupil-linked arousal condition in the delta, theta, alpha 2, beta 2, and gamma bands across various regions (figure 7). Notably, these regions include the FEF, STG, and MFG which are part of the DAN and VAN (Corbetta et al 2008, Vossel et al 2014, Zhou et al 2018, Bernard et al 2020). The other significant regions include the ACC and OFC, which have been implicated in the control of attention and arousal (Robbins 2000, Critchley et al 2001). These results appear both in line and at odds with results reported in earlier studies linking spectral power to pupil-linked arousal, which typically reported an increase in spectral power of higher frequency bands (alpha, beta, and gamma) but a decrease in spectral power of lower frequency bands (delta) as arousal level increases (Podvalny et al 2021). One possible explanation is the overlap between the change in spectral power caused by attention reorienting and the change caused by pupil-linked arousal. Considering that attention reorienting typically causes an increase in lower frequency band power (Proskovec et al 2018) and pupil-linked arousal in higher frequency band power (Podvalny et al 2021, Pfeffer et al 2022), the results observed in the current study may represent an overlap between the change caused by both factors.
We also investigated the differences in functional connectivity between low and high pupil-linked arousal conditions using lagged phase synchronization measures found in eLORETA. We found significantly lower lagged phase synchronization between a region within the SN (aPFC) and a region within the VAN (STG) in the alpha 1 band in the high pupil-linked arousal condition when compared across target trials (figure 8). This result is in line with previous findings reporting alpha band desynchronization during high emotional arousal (Schubring and Schupp 2019, Kim et al 2021). The reduction in connectivity between the SN and VAN as pupil-linked arousal increases is also consistent with the 'network reset' theory of LC function as proposed by Bouret and Sara (2005). Suggesting that LC activation interrupts ongoing activity and promotes dynamic reorganization of functional neural networks (Bouret and Sara 2005), it is possible that the decrease in functional connectivity between networks observed in the current study is the result of high tonic LC activity associated with a high level of pupil-linked arousal. Lastly, it is important to note that the differences in functional connectivity were observed only during target trials. One possible explanation for this result is that both the SN and VAN are known to activate following task-relevant stimuli (Corbetta et al 2008, Chen et al 2016), thus possibly contributing to the functional connectivity differences observed when compared across target trials but not when compared across distractor trials.
4.5. Limitations and future directions
One of the major limitations of the current study is the limited number of total trials performed by each subject, thus preventing the division of trials into more than two conditions. Due to the more realistic nature of the paradigm and the experimental setup involving the use of VR, a few subjects began reporting feelings of nausea after approximately 40 min of data collection, thus limiting the total number of trials we collected to 320 trials per subject. While we were able to split the data into low and high pupil-linked arousal conditions, we were simply unable to further split the data into smaller groups while still having enough statistical power for the analyses we performed. This limitation prevented us from investigating the nonlinear relationship between pupil-linked arousal and different attentional and oscillatory measures observed in other previous studies (Murphy et al 2011, van Kempen et al 2019). Future studies should aim to collect more data while maintaining the realistic nature of the current experimental paradigm. Another limitation of the current study is the indirect modulation of pupil-linked arousal via task difficulty levels. While the main goal of our study is to investigate the neural dynamics underlying attention reorienting at different levels of arousal, it became clear throughout our analysis that the modulation of task difficulty, as designed by our experimental paradigm did not lead to a direct correlation with the modulation of pupil-linked arousal level as intended. Further studies looking to investigate the relationship between pupil-linked arousal and neural dynamics may benefit from directly modulating arousal levels rather than through the variations of task difficulty levels.
5. Conclusion
We hypothesized that during immersive and demanding multitasking, there would be a relationship between subjects' level of arousal and their brain dynamics of the reorienting response. We further hypothesized that this relationship would correlate with multitasking performance. Using EEG and eye tracking, we measured the variations in the subjects' level of pupil-linked arousal as they reoriented attention between two different tasks in an immersive experimental paradigm presented in VR. We then investigated the neural and physiological dynamics of attention reorienting at low and high levels of pupil-linked arousal. We found evidence suggesting that the subjects' overall task performance increases as pupil-linked arousal increases and that the EEG and pupil dynamics of attention reorienting are coupled to pupil-linked arousal level. Specifically, as pupil-linked arousal increases, overall oscillatory activity increases and functional connectivity between the SN and VAN networks decreases. These results suggest that as pupil-linked arousal increases, the decoupling between the SN and VAN may lead to a rebalancing of the reorienting response that enables improved performance at high arousal levels. Our study provides a deeper insight into the relationship between attention reorienting and pupil-linked arousal, especially in a more realistic and immersive environment.
Acknowledgments
The authors would like to thank Ziheng Li and Adithya Narayana for their contributions with refining the experimental paradigm and data acquisition. This work was supported by grants from the National Science Foundation (IIS-1816363, OIA-1934968), the Army Research Laboratory Cooperative Agreement W911NF-10-2-0022, the Air Force Office of Scientific Research under Award Number FA9550-22-1-0337, and a Vannevar Bush Faculty Fellowship from the US Department of Defense (N00014-20-1-2027). The authors have confirmed that any identifiable participants in this study have given their consent for publication.
Data availability statement
The data used in the current study is publicly available using the following link: https://github.com/pawanlap/LIINC_VR_Arousal. Any other materials or information the reader may require is available from the authors upon reasonable request.
Supplementary data (0.6 MB PDF)