
Abstract
Objective: recently, pupil oscillations synchronized with steady visual stimuli were used as input for an interface. The proposed system, inspired by a brain-computer interface based on steady-state visual evoked potentials, does not require contact with the participant. However, the pupil oscillation mechanism limits the stimulus frequency to 2.5 Hz or less, making it hard to enhance the information transfer rate (ITR). Approach: here, we compared multiple conditions for stimulation to increase the ITR of the pupil vibration-based interface, which were called monocular-single, monocular-superposed, and binocular-independent conditions. The binocular-independent condition stimulates each eye at different frequencies respectively and mixes them by using the visual stereoscopic perception of users. The monocular-superposed condition stimulates both eyes by a mixed signal of two different frequencies. We selected the shape of the stimulation signal, evaluated the amount of spectral leakage in the monocular-superposed and binocular-independent conditions, and compared the power spectrum density at the stimulation frequency. Moreover, 5, 10, and 15 patterns of stimuli were classified in each condition. Main results: a square wave, which causes an efficient pupil response, was used as the stimulus. Spectral leakage at the beat frequency was higher in the monocular-superposed condition than in the binocular-independent one. The power spectral density of stimulus frequencies was greatest in the monocular-single condition. Finally, we could classify the 15-stimulus pattern, with ITRs of 14.4 (binocular-independent, using five frequencies), 14.5 (monocular-superimposed, using five frequencies), and 23.7 bits min−1 (monocular-single, using 15 frequencies). There were no significant differences for the binocular-independent and monocular-superposed conditions. Significance: this paper shows a way to increase the number of stimuli that can be simultaneously displayed without decreasing ITR, even when only a small number of frequencies are available. This could lead to the provision of an interface based on pupil oscillation to a wider range of users.
Export citation and abstract BibTeX RIS

Original content from this work may be used under the terms of the Creative Commons Attribution 4.0 license. Any further distribution of this work must maintain attribution to the author(s) and the title of the work, journal citation and DOI.
1. Introduction
Brain–computer interface (BCI) technology, which enables communication between the human brain and a computer, has attracted attention in the fields of medicine and rehabilitation [1–3]. The BCI provides a non-muscular means of interaction for people with severe motor impairments, such as amyotrophic lateral sclerosis, locked-in syndrome and spinal cord injuries. It enables them to convey their wishes to caregivers, type text or control a robotic arm or wheelchair. Electroencephalography (EEG), which includes event-related synchronization/desynchronization [4–6], steady-state visual evoked potential (SSVEP) [7–9] and P300 evoked potential [10–12] types, is the most applicable source of information for BCI control. In particular, SSVEPs (produced in the cortical visual cortex by steady visual stimuli) have frequently been employed because they require minimal training and exhibit a good signal-to-noise ratio (SNR) [13–15]. In an SSVEP-based BCI, multiple blinking patterns are simultaneously presented to the user and the appearance of the SSVEP response associated with the output device action causes the corresponding action to be performed. However, an EEG measurement requires electrodes or probes to be attached to the scalp, which is discomforting for users [16].
The pupil size changes in response to a modulation in the luminance of a visual stimulus [17, 18]. This is called the pupillary light reflex, and clinical studies have used it to identify the sites of disorders in visually impaired patients by non-invasively manipulating their nervous systems with visual stimuli and by monitoring their pupil responses [19, 20]. Recently, it has been reported that covert attention affects the amplitude of the pupillary light reflex [21, 22], which was inspired by earlier work by Naber et al [23]. Naber et al also reported that the pupil synchronously oscillates with the blinking stimulus that a participant gazes at [24]. Therefore, the frequency of the pupil oscillation indicates the target that is gazed at when several targets blink at different frequencies. They termed this method pupil frequency tagging (PFT). This pupil oscillation is easily measured with a camera. On the basis of this discovery, Mathôt et al were the first to apply the pupillographic method as a BCI [25]. They used the pupillary response that occurs when participants covertly attend to one of two stimuli flickering in counter phases, and they developed an interface in which the target is recognized by time domain analysis. Thus, a pupillographic interface is expected that acts as a BCI that does not require contact with the user and does not require calibration.
Each command of the BCI system must be mapped to a unique stimulus pattern. A disadvantage of an interface based on pupil oscillation is the strict requirement of the synchronization of the response to the stimulus pattern. The range of strong pupil oscillations is at most approximately 0.3–2.3 Hz [24]. The range of stimulation frequencies that cause oscillation is considerably lower and safer than the 15–25 Hz range where epileptic seizures tend to occur [26]. However, it is a serious problem in that it limits the number of communication channels compared with SSVEP-based BCIs. Nevertheless, reported systems based on pupil oscillation have not overcome this limitation. For SSVEP-based BCIs, many approaches have been proposed to code more targets with a limited number of input stimuli. Popular approaches include frequency and phase coding [27–35]. In particular, phase coding uses blinking stimuli that differ only in the relative phase at the same frequency (e.g. using up to eight phases at a single frequency) [35]. However, there is a limit to the number of choices when only one frequency or phase is linked to each stimulus.
The superposition of different frequencies has been proposed to increase the number of classifiable targets [36–38] in SSVEP-based BCI studies. Mu et al generated six visual stimuli from four different frequencies by superimposing two different frequencies. Thereafter, they used the multiple peaks obtained by the linear combinations of the stimulus frequencies to make a decision and achieved an accuracy of 70% with nine participants [39]. Yan et al generated a two-frequency SSVEP response by flickering two nearby visual stimuli at different frequencies. Nine visual stimuli were generated from three different frequencies, and a classification accuracy of 75.94% was achieved with eight participants [40]. Thus, the dual-frequency stimulation method is expected to elicit more unique responses than the single-frequency method. Additionally, when the blink frequencies are closely placed, a long-time window (high-frequency resolution) is required to accurately recognize them. However, if many stimuli are created with a few frequencies, this can shorten the measurement time because the space between the blink frequencies is increased [41].
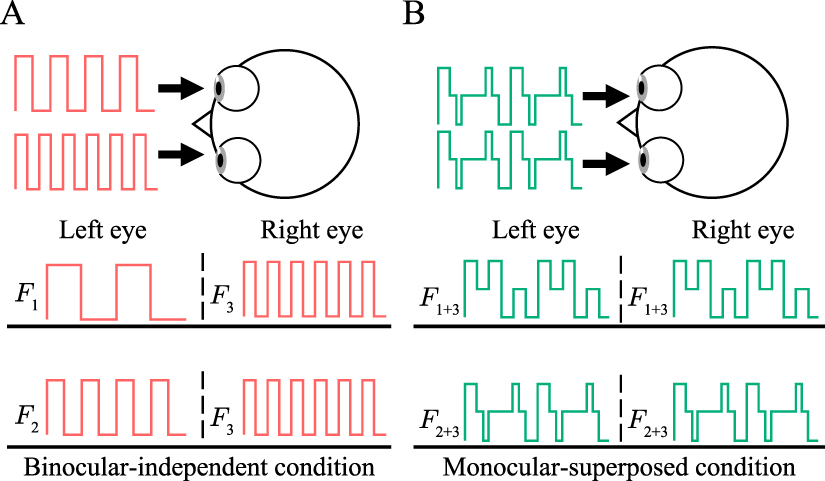
Here, we studied the feasibility of the dual-frequency stimulation to increase the number of stimuli that can be simultaneously displayed, even when only a small number of frequencies are available for a BCI system based on the pupillary light reflex. Two different conditions are proposed for the method; one is a stimulus in which two different frequencies are presented in a monocularly superposed manner (monocular-superposed condition). The other is a condition in which two different frequencies are presented at the same spatial location and separately in both eyes (binocular-independent condition), as shown in figure 1.

Figure 1. Pupillary stimulation conditions using two different frequencies. (A) Binocular-independent condition stimulates different frequencies for the left and right eye. (B) Monocular-superposed condition mixes signals with different frequencies in advance and administers them to both eyes as a common stimulus.
Download figure:
Standard image High-resolution imageThe principle of the pupillary light reflex is essentially different from SSVEP. SSVEP is the brain's electrical potential response, whereas the pupillary light reflex occurs because of light impulses from the right and left eyes joining in the Edinger–Westphal nucleus and transmitting to the right and left oculomotor nerves [42–44]. Thus, the pupil contracts on the illuminated (direct light reflex) and opposite unilluminated sides (consensual light reflex). Owing to the neural circuitry, the pupillary light reflex mixes the information on the left and right stimuli and provides a linear sum of the frequencies to the monocular vision system. The pupil light reflex system is a two-input–one-output system.
The multifocal method stimulates different regions of the monocular retina by stimulating different spatial locations. Graham et al proposed using visual evoked potential when stimulating the multifocal pattern for the detection of visual field defects in glaucoma [45]. Maddess et al evaluated the pupil response under blue reduced light to robustly detect the viewing area by using a 44-separate multifocal stimulation pattern [46]. In contrast, the binocular-independent condition in this paper stimulates the same retinal location in both eyes at different frequencies, and the monocular-superposed condition stimulates the same retinal location in both eyes with the same signals, which are superposed at different frequencies. Each condition displays multiple stimulation patterns on the same screen but does not consider synchronization between these patterns.
Although this is an important application issue, only a few studies have considered the possibility of the generation of an unexpected frequency component because of the non-linear characteristics of the optic nerve circuit. Howarth et al observed that there was no beat frequency component of the two signals in the pupil response when stimuli were dichotomously presented whereas a beat frequency component appeared when stimuli were presented monocularly superimposed [47]. When a linear system was stimulated with the sum of two sinusoidal waves, the output was a linear sum, but if it was a non-linear system, the output included the stimulus frequency and power of the combined frequency. From this result, they predicted that there would be a non-linear transformation (e.g. rectification) before the signals from both eyes joined. Their study was conducted for the neurological purpose of elucidating the structure of the pupillary light reflex pathway, not for the use of the pupillary light reflex in a BCI.
We investigated the pupil responses of subjects presented with independent or superposed stimuli using an head-mounted display (HMD). We considered three conditions for presentation: monocular-superposed, binocular-independent, and monocular-single (PFT) conditions. First, we experimented to determine what shapes of stimulation signals are suitable to induce a pupillary light reflex. Second, we evaluated the amount of spectral leakage at the beat frequency for the monocular-superposed and binocular-independent condition signals when gazing at them. Third, we compared the power spectrum density (PSD) between the monocular-single and binocular-independent conditions. Finally, to examine system feasibility and information transfer performance, we classified 5, 10, and 15 patterns of stimuli using each condition. A preliminary version of this study has been reported [48].
2. Methods
Thirteen healthy participants in their 20 s participated in this study (P1–P13). Seven males (P1, P2, P3, P4, P5, P6, P9 aged 21–24) participated in experiment 1, five males and one female (P1, P2, P3, P4, P7 and P8 aged 21–24) participated in experiment 2, and five males and one female (P2, P9, P10, P11, P12 and P13 aged 21–24) participated in experiment 3. The experimental design details in this study were approved by the ethics committee for non-medical research of Tottori University on 8 June 2020, conforming to the Declaration of Helsinki (7th revision). The participants provided written informed consent prior to the experiment.
2.1. Data acquisition
The participants sat on chairs and wore HMD devices (Vive Pro Eye, HTC Corp.) on which the stimuli were presented (figure 2(A). The horizontal/vertical field of view (FoV) of the HMD is about 98°/98°, and the resolution of the display is 2880 × 1600 pixels. The maximum size of the stimulation pattern of this study was under 59° horizontal FoV and under 28° vertical FoV. The device had an integral video-based eye-tracking function that worked under continuous infrared illumination at a sampling rate of 120 Hz.
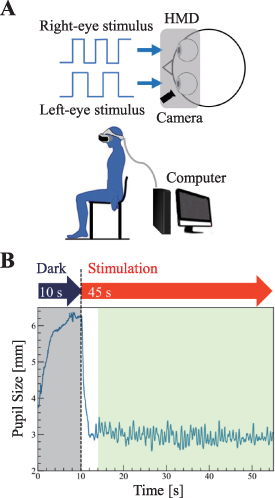
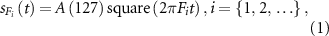
Figure 2. Experimental design. (A) Experimental setup: Participants sat in chairs, and pupil sizes were recorded with a head-mounted display system. (B) Experimental protocols for experiments 1 and 2: An example of a typical pupil oscillation is shown. The stimulus was initiated 10 s after the experiment started, and data from 2 s after the start of the stimulus were used to exclude the large contractions immediately after the stimulus.
Download figure:
Standard image High-resolution imageThe luminance of the stimuli was calibrated using a chromameter (ColorCAL II, Cambridge Research System, Kent, UK). Visual stimulation and pupil data acquisition were programmed (Unity Technologies, USA) with SRanipal SDK (Ver. 1.3.2.0, HTC Corp.).
The participants gazed at a single stimulus per trial, and their pupil diameters were measured during this time. The pupil sizes were interpolated with a cubic spline fit during blinks. The data for the first 2 s were excluded from the analysis because of the large transient contractions that occur at the onset of visual stimulation [19, 49]. To account for individual variability in pupil size, the pupil data were normalized to a 200 ms baseline period prior to each stimulus onset (i.e. normalized pupil size = absolute/baseline pupil size) [50]. Differences were not observed in the pupil diameter between the left and right eyes of the participants. Considering the well-established consensual response of the pupillary light reflex and symmetry in pupil responses between the two eyes in healthy participants, we only report the diameter of the left pupils [43].
2.2. Stimulus design
It is possible that different luminance modulation schemes induce larger pupillary oscillations in the pupil [51]. We evaluated the magnitude of the pupillary response to a visual stimulus presented in sinusoidal and square-wave forms to determine the modulation scheme of a stimulus that elicits a strong pupillary response. This preliminary experiment was conducted on four participants. Each stimulus was presented for 50 s and with five frequencies presented in random order. The stimulus was centered on the screen in the right eye. Participants were asked to overtly gaze at the target stimuli. A total of 20 trials (two conditions × five stimulation frequencies × two trial) were conducted for each participant. Discrete Fourier transform (DFT) was used to examine the effect of the visual stimulus on the overall data. The pupil response was divided into 20 s windows with a frequency resolution of 0.05 Hz, and the PSDs were additively averaged at a 90% overlap rate.
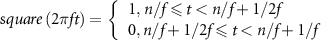
The square sequence,  , for the signal blinking with frequency
  Hz was described as follows:
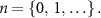
where  indicates a square waveform with a period of
  s,
s,
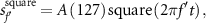
The luminance of the targets,  , was indicated using an RGB color. The color of the target was (R, G, B) = (127, 27, 127), henceforth referred to as A(127). The display luminance values at the pupil position were A(0) = 0 cd m−2, A(127) = 21 cd m−2, and A(255) = 122 cd m−2.
As shown in figure 3, the square wave,

Figure 3. Effect of the luminance-modulation waveform: pupil responses and mean power spectral density in sine and square waves. Five stimulation frequencies were tested: 0.3, 0.75, 0.9, 1.5 and 2.25 Hz. Two sessions were conducted by each participant. Pupillary responses with square waves were higher than those with sine waves.
Download figure:
Standard image High-resolution image
exhibited a larger amplitude of the pupil light reflex than the sinusoidal stimulus
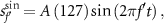
when  ={0.3, 0.75, 0.9, 1.5, 2.25}. The ratio of the peak values to the effective value (which is called the crest factor) of a square wave is lower than that of a sinusoidal wave. Therefore, it can efficiently induce a pupillary light reflex even in HMD displays in which the maximum luminance is limited.
2.3. Experimental procedure
2.3.1. Experiment 1
Here, we investigated the differences in pupil response between the binocular-independent condition or the monocular-superposed condition. When a stimulation signal is generated as the sum of two sinusoidal waves, the frequency components will not change if the response of the pupil diameter is linearly related to the light intensity. However, if the non-linearity of the pupil response is high, certain component in the frequency domain other than the input frequency will appear in the pupil response. As shown in in the left side of figure 4(A), the shape of the stimulus target was a square (9° viewing angle). The stimulation patterns of the binocular-independent condition were  and
and  , where
  indicated that the
  and
and  stimuli were administered to the left and right eyes, respectively. The stimulation patterns of the monocular-superposed condition were
  and
and  . Here, the stimulation wave,
  , for
, for  obeyed the equation
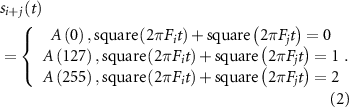

Figure 4. Stimulation patterns and the experimental protocol. (A) Stimulation pattern of the experiments. A single target with 9° was displayed in experiment 1. A six-stimulus pattern was displayed in experiment 2. Each target of the pattern was a square, and the size of one side was 8°. The targets were set around a circle with a 28° diameter. The stimulation frequencies were drawn as left eye [Hz]/right eye [Hz]. The stimulus patterns of experiment 3 were drawn for the right side, each target was a square, and the viewing angle of the pattern was 8.6°. The horizontal size of the patterns was 58.7°, and those of the vertical size were 8.6°, 18.8°, and 27.4°, respectively. The stimulation frequencies for the dual-frequency conditions (binocular-independent and monocular-superposed) were drawn on the upper side of each target, and the stimulation frequency for the monocular-single condition was drawn on the lower side of each target. (B) Experimental protocol for experiment 3. All stimuli in each condition were presented in 3 trials. There was an initial 10 s, and after each trial, a 5-s rest time was set.
Download figure:
Standard image High-resolution imageThree frequencies were assigned to the stimulation pattern  ,
,  ,
,  Hz. Participants were asked to overtly gaze at the target stimuli. As shown in figure 2(B), after 10 s of darkness, visual stimuli were presented for 45 s. Three measurements were taken for each condition, so 4 × 3 = 12 trials.
2.3.2. Experiment 2
This experiment examined the PSDs of the pupil response between the binocular-independent condition and the monocular-single condition. As shown in the left side of figure 4(A), the six stimulus patterns  ,
,  ,
,  ,
,  ,
,  , and
, and  ) were equally displayed in a circle with a 28° diameter of the viewing angle from the center of the visual field. Each target was a square, and the width and height were 8° each in the viewing angle. Three patterns were monocular-single condition and others were binocular-independent condition. As specific frequencies, we selected the set of stimulus frequencies (0.9, 1.25, and 1.5 Hz) that satisfied the following requirements.
- The range is one within which a reliable pupil oscillation can be measured (over 0.5 Hz and under 2.5 Hz).
- Each frequency is spaced over
 0.12 Hz.
 - There is no double or triple cycle of an already selected frequency.
- The beat frequencies do not match any stimulus frequencies.

Participants were cued at the start of each trial to overtly gaze at one of the six targets. To eliminate order effects, the six targets were randomly gazed at. The participants were allowed to take a break between experiments. After 10 s of darkness, visual stimuli were presented for 45 s as shown in figure 2(B). The experiment was conducted three times for each gaze condition, and 18 data were obtained per participant. No training was performed prior to the experiment.
2.3.3. Experiment 3
This experiment examined the classification accuracy for each of the three conditions (monocular-single, monocular-superposed, and binocular-independent conditions) with varying numbers of stimuli (5, 10, and 15). The right side of figure 4(A) shows the stimulus arrangement when the number of stimuli was 5, 10, and 15 and the stimulation frequencies. The monocular-single frequency condition used frequencies for the number of stimuli to be used. The monocular-superposed frequency and binocular-independent frequency conditions used the desired number of stimuli by combining the frequencies used.
The experimental protocol is shown in figure 4(B). The total duration of each session (for each stimulus) was 55 s, consisting of three trials. In each trial (10 s duration), the same stimulus was presented to the subject with a 5 s rest time in between the trials. An initial rest of 10 s was included in each session. Participants were cued at the start of each trial to overtly gaze at one of the targets. To eliminate order effects, the target to gaze at and the stimulation conditions (monocular-single, monocular-superposed, and binocular-independent) were randomly selected. Which targets to gaze at was counter-balanced across participants. No pre-experimental practice was conducted. The experiment was conducted three times for each gaze condition, and 270 trials were obtained per participant.
2.4. Signal processing and classification
2.4.1. Time-frequency analysis
The strength of the pupillary oscillations was analyzed using the DFT and Burg method, which produces a power spectrum between frequencies.
In experiment 1, the DFT was used to examine the effect of the visual stimulus on the overall data. The pupil response was divided into 20 s windows with a frequency resolution of 0.05 Hz, and the PSDs were additively averaged at a 90% overlap rate.
In experiment 2, the Burg method was used to obtain the features for the recognition of the gazing target with a short window. A band-pass filter of 0.4–3.0 Hz was applied to the segments (windows). Thereafter, the parameters of the autoregressive (AR) model were estimated using the Burg method for 92% of the segments, and the PSD of the pupil oscillations was calculated. An ensemble average was obtained at an overlap rate of 99%. The order and frequency resolution of the AR model were set to 300 and 0.025 Hz, respectively. It was considered that the shortened time window of the frequency analysis would achieve a high information transfer rate (ITR). The difference in classification accuracy was studied when the window length was 3.0–20.0 s at an interval of 1.0 s.
In experiment 3, the DFT was used without overlap. The time window length was modulated from 1.0 to 10.0 s at 1.0 s intervals, and zero padding was applied to achieve a frequency resolution of 0.025 Hz.
2.4.2. Signal-to-beat ratio (SBR)
We called the peak of the unexpected frequencies the beat frequency and used the SBR to evaluate the effect on the observed pupil response. The beat signal is not observation noise; it is rather generated by a biological mechanism. However, it should be avoided whenever possible because the existence of beat frequency signals degraded the command classification performance of the proposed interface. The SBR was calculated by dividing the mean amplitude of each of the two stimulus frequencies by the mean of the highest beat frequency:

The SBR was virtually the same as the signal-to-noise ratio (SNR) when the power of the beat frequency was significantly higher than that of the other spectrum components.
2.4.3. Signal processing and classification
To recognize the target being gazed at, we used a simple classification with a threshold. First, we obtained the PSD of the pupil diameter and normalized it to the highest PSD of one. The frequency of the first highest peak was always considered a pattern gazed at. Second, if the frequency of the second highest peak was over the threshold, it was considered a pattern gazed at. The threshold was common between different participants, and the value was obtained with a 0.01 resolution from the measured data by using cross-validation (see 2.5).
Figure 5 shows the determination for each target when the threshold was 0.5. As indicated in the upper panels, only one frequency peak was beyond the threshold when the gazing targets were identical ( ,
,  and
and  ). Oppositely, as shown in the lower row, two peak frequencies appeared beyond the threshold when the gazing targets were different (
 ,
,  and
and  ).
).

Figure 5. Normalized power spectral density (PSD) at a window width of 8 s when participant P4 viewed six stimulation pattern in experiment 2. The PSD was normalized by dividing the PSDs of the frequency bands by the maximum. The red tinted areas around the red dashed lines indicate the acceptable range of the frequency peaks.
Download figure:
Standard image High-resolution image2.5. Classification accuracy evaluation
The classification accuracy was estimated using k-fold cross-validation. The dataset was divided into a training set for choosing the optimal parameter (threshold) and a test set for estimating the accuracy. Three measurements were taken for each stimulus condition. Therefore, parameter k of the cross-validation was three. The accuracy rate was defined as
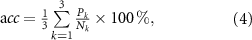
where  is the number of correctly classified attempts and
  is the number of attempts when the fold number was k.
2.6. ITR of the interface
In addition to accuracy, the ITR is a common metric used to evaluate BCI performance. It measures the information transmitted by the system per unit time and is defined as follows:
where  is the number of stimuli,
  is the target identification accuracy and
  is the time required to make a selection (s). We assumed that the processing time was negligibly short and the rest time as initial stimulation was not included in T; therefore, the ITR calculated in this study was higher than that in a practical application.
2.7. Statistical analysis
In experiment 1, significance levels were calculated using a paired t-test. The p-values below 0.05 were considered significant. In experiment 2, we analyzed the difference in PSDs depending on the stimulus condition on the basis of multiple comparison tests (paired-t-tests) with Bonferroni correction. The significance levels were set at p < 0.05. In experiment 3, we analyzed the difference in accuracies depending on the stimulus condition on the basis of multiple comparison tests with Bonferroni correction. Moreover, we also used multiple comparison tests (paired-t-tests) with Bonferroni correction to analyze the difference in ITRs, the stimulus condition, and the number of stimulation patterns. The significance levels were all set at p < 0.05.
3. Results
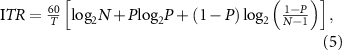
3.1. Experiment 1: superiority of the independent stimulation of the right and left eyes
Figure 6 shows the mean  PSD of the pupillary responses generated by the synthetic waves or independent stimuli in seven participants. Figures 6(A) and (B) show the results for the stimulation frequencies of 0.5 and 1.5 Hz, and figures 6(C) and (D) show those for 1.0 and 1.5 Hz. Peaks appeared at the stimulation frequencies in the plots for each condition. Comparing figures 6(A) and (B), the PSD at 1.5 Hz was not significantly different whereas that at 0.5 Hz was significantly lower for the binocular-independent condition (0.5 Hz:
 1.5 Hz:
  ). Comparing figures 6(C) and (D), the PSD at 1.0 Hz was not significantly different whereas that at 1.5 Hz was significantly lower for the binocular-independent condition (1.0 Hz:
 1.5 Hz:
 ). Peaks appeared at the beat frequencies of the stimulation frequencies. Comparing figures 6(A) and (B), the PSD at the beat frequency (1.5 − 0.5 Hz = 1.0 Hz) was significantly lower for the binocular-independent condition (
 ). Comparing figures 6(C) and (D), the PSD at a beat frequency (1.5 − 1.0 Hz = 0.5 Hz) was significantly lower for the binocular-independent condition (
 ).
).
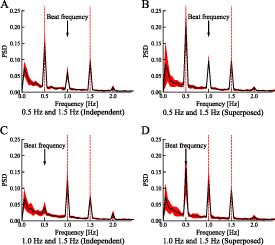
Figure 6. Power spectral density of the pupil response with binocular-independent stimuli (A and C) and monocular-superposed stimuli (B and D). Vertical lines show the stimulation frequencies. The colored area indicates the range of the standard deviation. When identical superposed signals were used for stimulation, an unexpected peak (beat frequency) appeared. By contrast, when independent signals were used, the peak power of the beat frequency reduced.
Download figure:
Standard image High-resolution imageAs shown in figure 7(A) for 0.5 Hz: 1.5 Hz, the SBR of the binocular-independent condition was significantly higher than that of the monocular-superposed condition at 1.5 Hz ( ) and was not significantly different from that of the monocular-superposed condition at 0.5 Hz (
 ). The mean of the binocular-independent condition was higher than that of the monocular-superposed condition. As shown in figure 7(B) for 1.0 Hz: 1.5 Hz, the SBR of the binocular-independent condition was significantly higher than that of the monocular-superposed condition at 1.0 Hz (
 002) and 1.5 Hz (
 ).
).

Figure 7. Difference in signal-to-beat ratios (SBRs) of different stimulation methods. (A) SBRs when the stimulation frequencies were 0.5 and 1.5 Hz, and (B) SBRs when the stimulation frequencies were 1.0 and 1.5 Hz. The results were obtained by dividing the peak value at the beat frequency by the peak value at the stimulus frequency. The asterisks indicate the statistical significance of the paired-samples t-test (**p < 0.005, ***p < 0.0005).
Download figure:
Standard image High-resolution imageThese results showed that the binocular-independent condition was more suitable for discrimination using the stimulus frequency because it was less affected by the beat component. A previous study on an SSVEP-based BCI employed the beat frequency for classification [52] because it was significantly higher than the amplitude of the stimulation frequency. However, the present results for the pupil light response indicated that the amplitude of the beat frequency was not significantly higher than that of the stimulation frequency. Subsequently, we employed independent binocular stimulation to identify stimulus patterns, unless otherwise specified.
3.2. Experiment 2: identifiability of gazed visual stimuli as a system
We determined if the stimulus patterns that were not gazed at but were in the field of view affected the pupil responses using time–frequency analysis when six stimulus pattern was displayed. Three of the six stimuli were for the monocular-single condition ( ,
,  , and
, and  ), and the other three were for the binocular-independent condition (
 ). Figure 8 shows the time–frequency analysis results when participant P4 gazed at each target for 40 s by independent bilateral stimulation. We observed spectrum peaks at the stimulus frequency corresponding with the gazed-at target. Each gaze stimulus elicited a different and unique pupil response. No effects from the beat frequency or ambient light from the non-gazed-at target were observed.

Figure 8. Time–frequency maps acquired when subject P4 gazed at six different visual stimuli . In the upper panels, the stimulus frequency was the same for both eyes, and a single frequency strongly appeared. In the lower panels, the stimulus frequencies differed, and the two frequencies appeared in parallel. The beat frequency had little effect. The window width was set to 4.0 s. The spectrum was estimated by using the Burg method with a 300th-order autoregressive model.
Download figure:
Standard image High-resolution imageFigure 9 shows the mean and standard error of the spectral peaks generated when the participants gazed at each visual stimulus. The PSDs tended to be high when the stimulation frequencies of both eyes were identical. In most cases, PSDs of the monocular-single condition were significantly higher than these of the binocular-independent condition, except in the case of between 
 (t(5) = 2.54, p = 0.10).
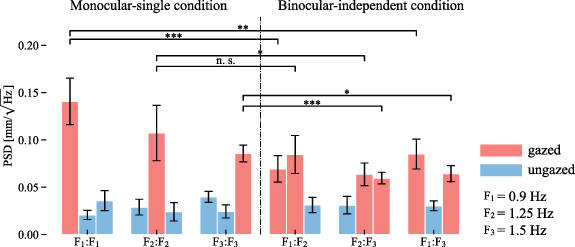
Figure 9. Mean power spectral density (PSD) of the subjects for each gaze target. The error bars indicate the standard error. PSDs at frequencies corresponding to the gazed-at targets significantly increased for all targets; even non-gazed-at targets were simultaneously illuminated. In most cases, the PSDs of the monocular-single condition were significantly greater than the PSDs of the binocular-independent condition at each frequency.
Download figure:
Standard image High-resolution imageIn this system, the width of the time window represented the approximate time from when the participant began to gaze at the pattern. Therefore, the width of the time window should be shorter to increase the ITR. Figure 10(A) shows the mean classification accuracy rate across the participants when the time window width was varied from 3 to 20 s. The mean classification accuracy rate increased with an increase in the time window widths from 3 s (26.4%) to 7 s (80.1%). The highest mean accuracy rate was 92.6% at 12 s. A window wider than 12 s appeared not to improve the accuracy. Figure 10(B) shows the simulated mean ITR. On average, the theoretical maximum ITR of 12.5 bits min−1 was achieved when the window width was 7 s.
Figure 10. (A) Mean accuracy rate and (B) information transfer rate for the subjects when the time window for classification time was changed. The time window varied from 3 to 20 s. The chance level was 16.6%.
Download figure:
Standard image High-resolution image3.3. Experiment 3: comparison of three conditions
Finally, we compared the accuracies and the ITRs of each condition of experiment 3 to confirm the feasibility of the dual-frequency method (figure 11). The window width for classification was set to 6.0 s. The mean accuracy for the five stimulus patterns was 66.7% for binocular-independent, 77.8% for monocular-superposed, and 95.6% for monocular-single, with ITRs of 8.3 bits min−1, 11.9 bits min−1, and 20.2 bits min−1. The mean accuracy for the ten stimulus patterns was 62.8% for binocular-independent, 64.4% for monocular-superposed, and 87.7% for monocular-single, with ITRs of 12.7 bits min−1, 13.1 bits min−1, and 25.3 bits min−1. The mean accuracy for the 15 stimulus patterns was 58.9% for binocular-independent, 59.6% for monocular-superposed, and 78.5% for monocular-single, with ITRs of 14.4 bits min−1, 14.5 bits min−1, and 23.7 bits min−1.

Figure 11. Classification accuracies and ITRs for each condition. The error bars indicate the standard deviation. (A) A multiple comparison analysis of accuracies was performed between the stimulation conditions. (B) A multiple comparison analysis of ITRs was performed including the number of stimulus patterns and stimulation conditions. *: p < 0.05, **: p < 0.005.
Download figure:
Standard image High-resolution image
The accuracy of the monocular-single condition for each stimulation pattern case was significantly higher than the binocular-independent condition (t(5) = 3.69, p= 0.042; t(5) = 4.25, p= 0.024; t(5) = 5.08, p= 0.012), and the monocular-single condition for the ten-stimulation pattern case was significantly higher than the binocular-independent condition for the ten-stimulation pattern cases (t(5) = 7.00, p= 0.003). On the other hand, there were no significant differences between the binocular-independent and the monocular-superposed conditions.
The ITR of the monocular-single condition for the 15-stimulation pattern case was significantly higher than the binocular-independent condition for the five-stimulation pattern and the monocular-superposed condition for the ten-stimulation pattern case (t(5) = 6.76, p= 0.039; t(5) = 6.93, p= 0.035), and the monocular-single condition for the ten-stimulation pattern case was significantly higher than the monocular-superposed condition for the ten-stimulation pattern case (t(5) = 6.44, p = 0.048). The highest ITR through all conditions and number of stimulations was obtained under the monocular-single condition for the ten stimulation patterns (25.3 bits min−1) (confusion matrices of each participant are shown in figure S3(1)–(6)).
4. Discussion
This study aimed to increase the number of communication channels in pupillary light reflex-based BCIs, and we propose to use independent dual-frequency mixed stimulus presentation to both eyes. The results showed that the independent stimuli suppressed the spectral leakage at the beat frequency and enhanced the SBR. In addition, compared with conventional single-frequency coding, frequency superposition induced more complex responses, thereby classify 15 channels with five frequencies. To the best of our knowledge, this is the first study to increase the number of communication channels by dual-frequency mixed stimulation in a pupillary light reflex-based BCI. In addition, the use of HMDs to present the stimuli in a completely dichotomous manner is a feature of this investigation. There have only been a few studies of SSVEP-based BCIs that proposed to use dual-frequency stimulation to increase visual stimulation [36–41], and no countermeasure has been considered for the recently proposed pupillary light reflex-based BCI.
4.1. Binocular-independent condition
The results of experiment 1 indicated that the independent stimulation of both eyes suppressed the spectral leakage of the beat frequency component, whereas superposition stimulation increased it. This result is consistent with the results of Howarth et al who investigated nonlinear processes within the pupillary pathway [47]. In frequency coding, which extracts stimulus frequencies from pupil oscillations and decodes the gaze target, the gaze target would be misidentified if energy is observed at a frequency that should not be included in the stimulus signal. When the SBR < 0, it indicated that the beat frequency spectrum exceeded the stimulus frequency spectrum, and the system misinterpreted the beat frequency as the stimulus frequency. Suppressing the difference component using independent stimulation would facilitate the identification of the stimulation frequency, and there would be no need to avoid using stimuli with frequencies that match the beat frequency.
The results of experiment 2 indicated that the response of pupil reflex in the monocular-superposed condition (same stimulus on-offset pattern shown in both eyes) was stronger than the independent condition (different stimulus on-offset pattern shown in both eyes). This suggests that the effect of lateral suppression was stronger than the orienting responses in this experimental condition.
The results of experiment 3 indicated that, although we carefully selected the stimulus frequencies so that the beat frequencies were not affected by the classification result, the accuracy and ITRs of the monocular-superposed condition were not higher than those of the binocular-independent condition.
4.2. ITRs of monocular-single condition
For a pupillary light reflex-based BCI with single-frequency coding, Muto et al achieved over 98% discrimination performance when the difference in the blinking frequency between the stimuli was larger than Δf= 0.12 Hz [53]. When the range of the stimulation frequency was 0.7–1.9 Hz and the difference between the frequencies was 0.12 Hz, the number of stimuli would be approximately 11 at most. Our experimental system was able to identify 15 frequencies with an identification rate of 78.5% (ITR = 23.7 bits min−1). The difference in the shape (sine or square wave) of the stimulation signal may have contributed to increasing the ITR of our system. Achieving a higher ITR with the PFT method, which we call monocular-single condition, is not an objective of this paper, but the highest ITR of our system was 25.3 bits min−1 (single method/10 stimuli). This was higher than the 21.26 bits min−1 reported by Muto et al.
4.3. Comparison with other methods
The results of experiment 3 indicated that the binocular-independent and monocular-superposed conditions could be classified fifteen patterns with five different frequencies. However, we do not believe that these approaches are the optimal solution. For example, a gradual 'zoom-in' method has the advantage of easily increasing the number of classifiable targets without decreasing the ITR, even with fewer frequencies that can be stimulated. Mathôt et al reported a zoom-in method for classifying eight targets with repeated binary segmentation; the accuracy of this method was 90% (chance level = 12.5%), and the mean ITR was 4.86 bits min−1 [25]. The mean of the classification time in each trial was 28 s. It was higher than Naber et al [24], who used unique frequencies for each target (PFT method); the accuracy was 73 ± 20% (chance level = 25%), and the mean ITR was 2.32 bits min−1 when they classified four patterns. However, the zoom-in method changes the content being displayed with each zoom-in, resulting in a slight delay in user recognition and, consequently, a slight decrease in ITR with each trial. If it were possible to stimulate with only five frequencies, the ITR for the binocular-independent condition would be 14.4 bits min−1 (see figure 11). On the other hand, the zoom-in method requires four repetitions of binary classification for 15-pattern classification. An accuracy of 97% or better within 3.0 s is required to obtain the same ITR as the binocular-independent condition when the user recognition delay is assumed to be 1.0 s. This suggests that the zoom-in method is not a gold standard.
The zoom-in method might be extended to reduce the number of classification trials by using several unique frequencies. For example, if five patterns are classified in the first trial, and three patterns are classified in the second trial, then 15 patterns can be classified in these two classification trials. In experiment 3, in the monocular-single condition, the five-stimulus pattern was classified with 92.2% with a 4 s window width (see figures S1 and S2, in the supplementary materials). In this setting, the ITR for 15-pattern classification can be 21.4 bits min−1 even if a 1.0 s delay time exists for user recognition. Although the interface design will be complex, the ITR of an extended zoom-in method could be higher than that of the binocular-independent condition. Meanwhile, the mean ITRs for the dual-frequency conditions were higher for the 15-stimulus pattern (14.4/14.5 bits min−1, binocular-independent/monocular-superposed conditions) than for the ten-stimulus pattern (12.7/13.1 bits min−1) or the five-stimulus pattern (8.3/11.9 bits min-1). At least, the ITRs did not decrease as the number of simultaneously displayed patterns increased. Therefore, the extended zoom-in method may not be suitable in combination with dual-frequency conditions.
4.4. Binocular rivalry (BR)
The presentation of different visual stimuli to both eyes may induce BR [54]. BR is a phenomenon in which conscious perception spontaneously alternates between left and right images. There have been recent reports that BR slightly affects the pupil [23]. However, in the present experiment, the effects of BR were negligible because the stimuli were simple shapes and not two colors, and BR is unlikely to occur when spatially identical stimuli that flash at different frequencies are presented [55].
4.5. Non-linearity of the pupillary light reflex
The non-linearity of the pupillary light reflex was deeply involved in this study. The beat frequency component due to superposition stimulation can be easily explained by the hypothesis of Howarth et al [47], which states that it is caused by a non-linear transformation located before the confluence of the left and right eye stimuli. However, Howarth et al discussed the reasons for generating the beat frequency component of the pupil response in the frequency domain, as opposed to the time domain. Therefore, the effects of the independent and superposition stimulation of the pupil response have not been fully explained. They chose a stimulus frequency so high that the stimulus did not generate oscillations. Therefore, they possibly did not model well at low frequencies. Baitch and Levi observed that there was a beat frequency component in the evoked potentials in the visual cortex caused by independent stimuli [56]. Their results differed from those of the pupil's responses. This study is for engineering. Therefore, it is not possible to describe the detailed structure and response characteristics of the binocular summation from the viewpoint of neuroscience and electrophysiology. Considering that the non-linearity of the pupillary light reflex may affect BCI performance, it will be necessary to investigate the nature of the pupil oscillation in detail from a neuroscientific point of view.
4.6. System development
As a future experimental plan, we may improve BCI performance by implementing visual feedback [57, 58]. In addition, we need to consider the idling state of the BCI system. One way to deal with this is to use thresholds [7, 59]. The BCI system can be activated when the pupil response exceeds a pre-defined threshold. Another possibility is to build a hybrid system with an eye tracker or similar system. Gaze estimation by eye tracking requires accurate calibration, and there are fears that it will select non-gazed-at (but in the field of view) targets. In addition, when the target is dense and small, BCI using the biological signals generated by blink stimuli has been observed to perform better than eye tracking [60]. Therefore, by combining eye-tracking measurements with SSVEP measurements using blinking stimuli, it is possible to identify the object that is truly being gazed at [61–64]. In the pupillometry-based system, pupil measurement and eye tracking can be combined in a simple system with only a camera.
4.7. Limitations
Certain limitations existed in this study. First, we selected a combination of stimulus frequencies that generated a beat frequency component and investigated only a limited number of frequencies. Second, we showed that at least 15 stimulation patterns can be applied; however, it was not determined how many visual stimuli can be increased without degrading discrimination performance. Next, there were individual differences in the selection accuracy. These individual differences could have caused differences in attention, which could have been improved by minimal attentional training. Finally, lesions such as relative afferent pupillary defect and amblyopia could affect the results.
4.8. Prospects of pupillary-based BCI
This study replaced a cognitive estimation component of BCI with the pupil light reflex from the SSVEP of surface EEG. The eyes may reflect various brain activities and attention [65–67]. We believe that the pupil response denotes several brain activities through the central nerve. In the future, more brain activities will be inferred from pupil response.
Acknowledgments
This study was supported by a research grant from The Mazda Foundation and JSPS KAKENHI (22H01451). The authors would like to thank Ms. Ami Fujii and Mr. Yuto Oshika for their support during data collection
Conclusion
The slow movement of the pupillary reflex limits the bandwidth of the available stimulus frequencies. We increased the number of patterns by combining two different frequencies. Regarding the input method of the stimuli, we used a condition with two distinct monocular-superposed frequencies and one with different frequencies presented in each eye separately but in the same spatial location.
On the basis of the results of preliminary experiments, we defined the shape of the stimulus signal as a square wave to efficiently elicit the pupillary light reflex. Next, we defined the SBR to evaluate the spectral leakage. Then, we created six visual stimuli using three different frequencies; three of the six stimuli were for the monocular-single condition, and the other three were for the binocular-independent condition. The PSDs of the stimuli for monocular-single were greater than those of binocular-independent. Finally, we attempted to classify 5, 10, and 15 patterns of stimuli under monocular-superposed, monocular-single, and binocular-independent conditions. Under all conditions, we classified the 15 stimulus patterns with better-than-chance accuracy.
In this paper, we demonstrated the feasibility of the binocular-independent condition for noncontact pupillary light reflex brain- BCIs. The results of this study provide a clue to solving the problem of the insufficient number of channels in pupillary light reflex based BCIs.
Data availability statement
The data that support the findings of this study are available upon reasonable request from the authors.
Supplementary data (2.2 MB PDF)