
Abstract
Objective. Vagus nerve stimulation (VNS) is Food and Drug Administration-approved for epilepsy, depression, and obesity, and stroke rehabilitation; however, the morphological anatomy of the vagus nerve targeted by stimulatation is poorly understood. Here, we used microCT to quantify the fascicular structure and neuroanatomy of human cervical vagus nerves (cVNs). Approach. We collected eight mid-cVN specimens from five fixed cadavers (three left nerves, five right nerves). Analysis focused on the 'surgical window': 5 cm of length, centered around the VNS implant location. Tissue was stained with osmium tetroxide, embedded in paraffin, and imaged on a microCT scanner. We visualized and quantified the merging and splitting of fascicles, and report a morphometric analysis of fascicles: count, diameter, and area. Main results. In our sample of human cVNs, a fascicle split or merge event was observed every ∼560 µm (17.8 ± 6.1 events cm−1). Mean morphological outcomes included: fascicle count (6.6 ± 2.8 fascicles; range 1–15), fascicle diameter (514 ± 142 µm; range 147–1360 µm), and total cross-sectional fascicular area (1.32 ± 0.41 mm2; range 0.58–2.27 mm). Significance. The high degree of fascicular splitting and merging, along with wide range in key fascicular morphological parameters across humans may help to explain the clinical heterogeneity in patient responses to VNS. These data will enable modeling and experimental efforts to determine the clinical effect size of such variation. These data will also enable efforts to design improved VNS electrodes.
Export citation and abstract BibTeX RIS

Original content from this work may be used under the terms of the Creative Commons Attribution 4.0 license. Any further distribution of this work must maintain attribution to the author(s) and the title of the work, journal citation and DOI.
1. Introduction
Electrical stimulation of the cervical vagus nerve (cVN) using implanted electrodes (i.e. vagus nerve stimulation, VNS) is an existing clinical therapy approved in over 50 countries, and implanted in over 100 000 patients between 1989–2012 [1, 2]. Implanted vagus nerve stimulators are currently approved by the Food and Drug Administration to treat epilepsy, depression, and obesity, as well as for stroke rehabilitation [3–6], and they are in clinical trials to treat diverse conditions including heart failure, diabetes, and rheumatoid arthritis [7–9].
The cVN is an attractive target for neuromodulation therapies as it is easily identifiable with ultrasound, and it can be accessed with a well-established and relatively simple surgical procedure [10]. In humans, the cVN consists of over 100 000 fibers: efferent fibers originate from the brainstem and innervate most visceral organs (e.g. lungs, heart, diaphragm, liver, and intestines), while afferent fibers return to the brainstem and influence noradrenergic, serotonergic, and cholinergic inputs to the cortex [10–12]. Therefore, intervening at the cVN presents the opportunity to modify function within both the brain and most viscera [13–22].
Several recent studies in animal models suggested that smaller, multi-contact electrodes may more selectively stimulate specific portions of the cVN by better isolating intended activation of therapeutic fibers from unwanted activation of off-target fibers [23, 24]. Low-threshold, large-diameter motor efferent fibers of the vagus innervate throat muscles; activation of these fibers putatively drives the most common side effects, causing cough, throat pain, voice alteration, and dyspnea reported in up to 66% of patients [25–30]. In a study of patients implanted to treat heart failure, desired heart rate responses were achieved in only 13 of 106 measurements taken at the 6 and 12 month end points, with stimulation thresholds predominantly limited by side effects attributable to activation of the neck muscles [25].
The vagus nerve has distinct functional organization at specific points along its path connecting the brainstem to visceral organs [31, 32]. Motor efferents responsible for activation of deep neck muscles originate in the nucleus ambiguus of the medulla oblongata and eventually coalesce into the pharyngeal, superior laryngeal, and recurrent laryngeal branches, which innervate the pharyngeal, cricothyroid muscle, and cricoarytenoid muscles, respectively. Parasympathetic efferents originate in the dorsal motor nucleus of the vagus of the medulla oblongata; their axons course in the cVN and eventually join vagal branches leading to visceral organs. Similarly, sensory afferents from visceral organs follow these same branches back to the main trunk that eventually becomes the cervical vagus, which targets the nucleus of the solitary tract of the medulla oblongata.
While much is known about the proximal/distal connectivity of the vagus nerve, it is unknown whether the human cVN has well-maintained functional organization; a lack thereof may account for the high degree of heterogeneous results across patients [25–30]. Seminal studies by Sunderland previously demonstrated that fascicles of somatic peripheral nerves divide and merge to form fascicular plexuses, but there is substantial uniformity of fascicular arrangement more distally [33, 34]. For example, the palmar cutaneous and motor fascicles of the median nerve can be microdissected proximally for several centimeters without significant merging or splitting [33, 34]. Prior studies of human cVN morphology collected sparse nerve samples and imaged the nerve with a single two-dimensional cross section per nerve; these data yielded highly variable results with respect to the number of fascicles between studies with little information about the underlying functional somatotopy relevant to VNS [35–38].
In this study, we collected eight cVNs from five human cadavers (figure 3(A)); each nerve was 5 cm long, and we focused our splitting/merging quantitative analyses on the middle 1 cm where the clinical VNS cuff would be implanted [39]. Morphological parameters were summarized from the entire 5 cm 'surgical window'. We stained the nerves with osmium tetroxide, and we imaged the morphology of the nerves in three dimensions using microCT.
2. Methods
2.1. Tissue acquisition and dissection
We collected eight mid-cVN specimens from five formaldehyde fixed cadavers (three left nerves, five right nerves), secondary to use in medical school cadaver lab training (supplementary table 1). Since all the specimens were harvested from de-identified donor sources, and no protected personal health information was collected, a letter of IRB exemption (non-human-subjects determination) was sought and approved by the Case Western Reserve University Institutional Review Board.
Cadavers were already disarticulated prior to our dissection; we performed gross and fine dissection with standard tools to isolate the vagus nerve from surrounding tissues. We made a rostral/cranial cut directly beneath the skull (jugular foramen) approximately at the nodose ganglion. The caudal/distal cut was made at the level of clavicle. The harvested nerves were stored in 4% formalin solution until ready for staining. The VNS cuff electrode is clinically placed midway between the clavicle and the mastoid process, and the surgical incision is 3–4 cm long [39]; therefore, we collected 5 cm of length for each nerve, centered around the approximate location of VNS cuff placement, which we refer to as the 'surgical window' throughout the paper. With respect to the directionality of median vs lateral- one of the limitations with dissecting out the sample and doing micro-CT is that the in-body orientation cannot be preserved. There would be alternative modalities that can be used- like MRI- to fulfill this gap. The main scope of this paper was to study the fascicular anatomy and its reorganization.
2.2. Sample preparation: osmium staining & paraffin embedding
The vagus nerves were washed three times with 1X phosphate buffered saline, letting the sample shake on an orbital shaker for five minutes after each wash. Osmium tetroxide (1% v/v) was prepared with deionized water, and the nerves were left fully submerged in this solution for three days. The samples were then dehydrated with 70% and 95% ethanol with a deionized water solvent. The dehydration included two quick rinses of the samples with 70% ethanol followed by a full wash and 30 min on the orbital shaker. This process was repeated twice with 70% ethanol, then three additional times with 95% ethanol. The nerves were stored in 70% ethanol for up to one week prior to embedding in paraffin.
The nerve samples were embedded in paraffin, mounted on a 3D printed plastic mold that fit the nerve. At the base of the mold, there were grooves every 5 mm, and these grooves were painted with a marking solution doped with barium sulfate to enhance sample navigation under x-ray.
2.3. MicroCT and image sub-volume reconstruction
For the imaging studies, we used a Quantum GX2 microCT Imaging System (Perkin Elmer, Waltham, MA, USA). The embedded nerve was placed in a 36 mm bed. The microCT scanner was warmed up as recommended by the manufacturer. We imaged a cross-sectional field of view that was 36 mm × 36 mm. Each scan spanned 1.8 cm of nerve length, with 0.3 cm overlap (i.e. 16.67%) between adjacent scans to serve image reconstruction. The barium-marked grooves were used for x-ray navigation to the appropriate markings. The resultant images had 72 μm isotropic voxel resolution.
Post-hoc sub-block reconstruction was performed with Rigaku software provided by Perkin Elmer. Each sub-block reconstruction was a 5.12×5.12 × 5.12 mm3 cube and adjacent sub-blocks overlapped by 0.1 mm (20% overlap); the resolution of final reconstruction was 10 µm voxel size (isotropic). Images were exported as DICOM files for further processing. After down-sampling frames along the longitudinal axis by ten-fold, blocks were co-registered and stitched using ImageJ (FIJI, Version 2.1.0/1.53c) [40]. The final image dataset consisted of a stack of TIFF images of the nerve cross section every 100 µm along the nerve. 3D visualizations were generated by Simpleware™ ScanIP software (Synopsys, Mountain View, CA).
2.4. Fascicle morphometric analysis
cVN samples were analyzed using ImageJ (FIJI, Version 2.1.0/1.53c) to select, outline, and measure individual fascicles, using the elliptical selection tool. Fascicle boundaries were manually traced based on visual inspection. For morphometric analysis, the operators evaluated fascicle parameters at 0.5 cm intervals along the length of the 5 cm cervical window for each nerve. While manual outlining potentially introduces subjective differences between operators, the magnitude of these differences was deemed negligible based on prior inter-operator analyses. Image scaling was set according to the microCT manufacturer provided calibration factor: 1 pixel = 10 µm, 1.0-pixel aspect ratio. Area, minimum and maximum gray intensity values, shape descriptors, mean intensity value, centroid coordinates, and ellipse-fit measurements (including major and minor axes, and effective circular diameter) were calculated.
2.5. Merging and splitting analysis
The splitting and merging analyses were conducted for the central 1 cm of the cVN, within the 5 cm of the surgical window. The frames in this region were isolated and loaded as an image sequence on ImageJ and analyzed from the cranial end to caudal end. All split/merge analyses were conducted manually.
2.5.1. Defining an event
During our analysis, we defined the start and completion of a split or merge event based on the fascicle boundaries. We characterized an event as a start of a split when a parent fascicle ('ab') created a bud or partition within the otherwise consistently shaded fascicle (e.g. figure 1(B)). The event was marked as complete when parent fascicle 'ab' completely formed independent circular/ellipsoidal children fascicles 'a' and 'b' with their own perineurium sheaths. In most cases, the perineurium sheath was well-defined and visible, although in some cases, the perineurium was inferred when there was separation of two ellipsoidal geometries. Similarly, we characterized an event as a merge when fascicle 'a' merged into another fascicle 'b', resulting in a combined fascicle 'ab', following the same processes as described above. When multiple events occurred simultaneously (e.g. one fascicle splitting into three fascicles), we considered it as two different splitting events. We did not observe any event where three fascicles merged to become one fascicle in the exact same frame.

Figure 1. Splitting and merging of fascicles in the human cVN imaged with microCT. Data in panels (A)–(C) are for specimen 2 R. The directionality is 1-rostral and 12-caudal. (A) The initiation of merging 'M' and splitting 'S' events are annotated with arrows: four merges (M1–M4) and 1 split (S1). Frames are read from left-to-right, top-to-bottom, as if reading text. Frame-to-frame spacing is 100 µm (12 frames = 1.1 mm total longitudinal span). Transverse-plane scale bar shown in bottom right of the figure is 500 µm. (B) Example merging event 'M2', spanning 6 frames (500 µm), where the fascicle on the right of the frame merges with the large fascicle on the left. (C) Line graph depicting split (positive stems) and merge (negative stems) events along the middle 1 cm length of nerve 2 R. (D) Table of mean distances (mean ± SD) over which split (n = 72) and merge (n = 70) events occurred for all eight cVNs along the middle 1 cm, sampled from the right (n = 5 nerves) or left (n = 3 nerves) side of the neck.
Download figure:
Standard image High-resolution image2.5.2. Measurements and analysis
To measure the distance over which the split or merge event occurred, we recorded the starting and the ending frames. With the total number of frames, we calculated the distance over which the event took place. Using ImageJ, the size of the parent and children fascicles were measured at the starting and the ending frames.
We recorded the number of splitting and merging events across the central 1 cm of each sample and calculated the average number of events across n = 8 samples. We counted the number of fascicles in the first, middle, and last frames of the 1 cm window and calculated the mean fascicle count in the specimen. We then determined the number of events per fascicle per cm for each specimen.
2.6. Statistics
Our primary quantitative metric was focused on fascicle splitting and merging events across our human cadaver nerve specimens (n = 8). Our descriptive statistics are means and standard deviations unless otherwise noted. Box plots in figure 2 display individual data points (colored according to the associated legends), median values (horizontal center line), mean values (small black square marker), interquartile range (upper and lower box edge), and outliers (whiskers). Bar plots presented in figure 3 display mean values (bar height) and standard deviation (error bars), with horizontal lines in the background representing the mean and standard deviation across all samples.
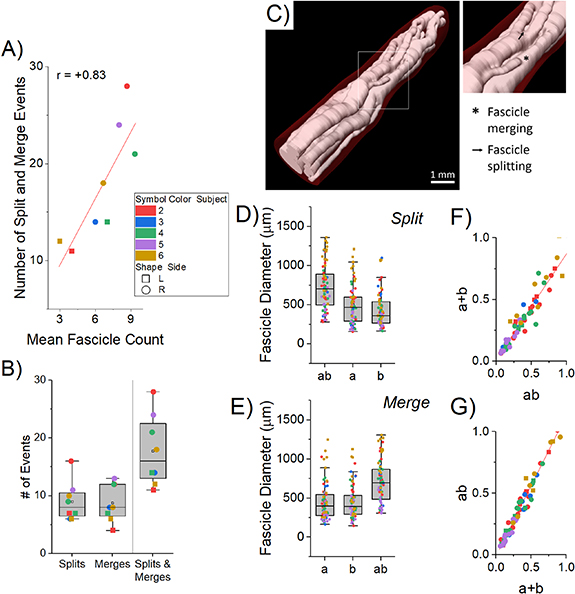
Figure 2. Metrics of fascicular reorganization along the central 1 cm of the human cVN (n = 8), corresponding to the standard clinical placement of implanted VNS electrodes. (A) Correlation between the number of split/merge events and the average number of fascicles for each of the eight nerve specimens. (B) Box plot of the number of split/merge events across all specimens. (C) 3D visualization of the fascicles of specimen 4 R. (D), (E) Box plots of the diameters of parent (ab) and children (a, b) fascicles for all split (D) and merge (E) events. (F) For fascicle split events, plot of the sum of the cross-sectional area of the children fascicles (a + b, y-axis) versus the area of the parent fascicle (ab, x-axis), with a mixed model slope β = 0.87, p < 0.001. (G) For fascicle merge events, plot of the cross-sectional area of the parent fascicle (ab, x-axis) versus the sum of the cross-sectional area of the children fascicles (a + b, y-axis), with a mixed model slope β = 1.14, p < 0.001. The summed areas of the children were consistently less than the area of the parent fascicle.
Download figure:
Standard image High-resolution imageFor all statistical tests described below, we used a two-sided Type I error of 0.05. Analysis was performed using R v4.0.2.
We evaluated the relationship between the mean number of fascicles and the total number of splitting or merging events in each specimen (figure 2(A)) with a two-level linear mixed model with subject-level and (left or right) side-level random intercepts.
We also evaluated the conservation of fascicular area before-and-after splitting and merging events (figures 2(F) and (G)). To study the association between fascicular area of the parent (ab) and summed areas of the children (a + b), we used a three-level hierarchical linear mixed model with subject-level and (left or right) side-level random intercepts with exponential spatial correlation structure for same-side samples.
Similar three-level models, as described above, were used to analyze the change in fascicular area, diameter, and count along the surgical window (cranial-to-caudal).
2.7. Methodological limitations
As with standard histological processes, the staining and fixative reagents can cause dehydration and shrinkage to tissues. Per prior publications, we anticipate shrinkage could contribute up to 20% reduction in apparent diameters [41–44]. However, we did not directly estimate this in our study, and therefore did not apply any correction factors in our dataset. Further, we sampled nerves from five cadavers, but due to the source of cadaver donation, we were unable to acquire any demographics. This study can be expanded in the future to greater population sample size to estimate population variability drive by demographic differences.
2.8. Methods and data availability
All the raw and analyzed data will be made available through the NIH SPARC — Stimulating Peripheral Activity to Relieve Conditions (SPARC), science portal (https://sparc.science/). Methods will be available through the open-access protocols.io server (www.protocols.io/).
3. Results
We visualized and quantified the merging and splitting of fascicles along the 1 cm window (figures 1 and 2). Merging and splitting events were detected manually by an impartial observer (figures 1(A) and (C)), noting delineation by perineurium boundaries (figure 1(B)). We measured the distance over which the events occurred, from the start of a bud of a new fascicle to a completely separated new fascicle (from cranial-to-caudal perspective; see Methods): merges spanned 430 ± 117 μm (mean ± SD, n = 70) and splits spanned 461 ± 108 μm (n = 72) (figure 1(D)). While we did not quantify their frequency, we observed multiple events where the fascicle split away and remerged with the same fascicle longitudinally.
Over the middle 1 cm of all eight nerves, there were 17.8 ± 6.1 merging and splitting events (figures 2(B) and (C)); thus, on average, at least one fascicle split or merged every ∼560 μm. This number of events is much larger than expected from prior studies using histological techniques [35, 36, 38]. On average, our nerves each had 6.6 fascicles; therefore, for the standard clinical VNS cuff electrode (LivaNova, London, UK), ∼14.2 split or merge events would be expected over the 8 mm between the centers of the bipolar contact pair. These rapid shifts in fascicular organization would be challenging to observe using standard histological or electron microscopy methods because they typically image a single transverse cross section per nerve; thus, prior studies on vagal morphology did not quantify this phenomenon of extensive fascicular reorganization [36, 38].
Merging and splitting events increased proportionally with the number of fascicles: more fascicles provided more opportunity for split/merge events (figure 2(A), β = 1.76, p = 0.032, where β is the slope of the mixed model). This fascicular reorganization has substantial implications for VNS thresholds and selectivity due to (a) the changing perineurium boundaries and their dramatic influence the electric field given the high resistivity of the perineurium [45, 46], and (b) the changing locations of fibers and therefore the proximity of fibers to the electrode contacts.
Fascicles of a wide range of effective circular diameters (147–1360 μm) had split and merge events; reorganization was not limited to a sub-population of small- or large-diameter fascicles (figures 2(D) and (E)). We calculated the cross-sectional areas of parent ('ab') and summed children ('a + b') fascicles before and after merging or splitting events (figures 2(F) and (G)). The parent areas were consistently larger than the sum of the children areas (β = 0.87, p < 0.001 and β = 1.14, p < 0.001, for splitting and merging, respectively, where β is the slope of the mixed model).
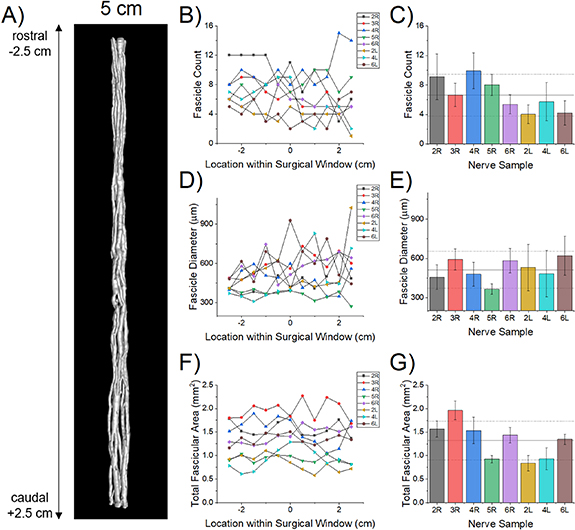
We quantified the fascicular morphology over the full 5 cm length of the eight specimens (figure 3(A)): number of fascicles, effective circular diameters, and cross-sectional areas (figures 3(B)–(G)). The large subject-to-subject variability is the most prominent feature of the morphology (figure 3). The mean fascicle diameter increased in the cranial to caudal direction (figures 3(D) and (E); p = 0.0139) with negligible change in overall fascicular area (figures 3(F) and (G); p = 0.8399), suggesting a consolidation of the fascicles toward the caudal end of the cervical region. While there was a trend toward a concomitant decrease in fascicle count with longitudinal distance (figures 3(B) and (C)), the result was statistically insignificant using a mixed-effects regression model (p = 0.1672, data not shown), likely due to low sample number and the large inter-subject variation between subjects. We did not observe any branches, although branches may occur in this region in some individuals [35].
Figure 3. Fascicle morphometry for the central 5 cm of the human cVN. (A) Representative 3D visualization of the microCT in which we segmented the fascicles (specimen 4 R). (B), (D), (F) Fascicle count, effective circular diameter, and cross-sectional area at 0.5 cm increments along the 5 cm surgical window for each specimen, where x = −2.5 cm is the cranial end and x = +2.5 cm is the caudal end. We averaged the data across the surgical window for each specimen ((C), (E), (G); mean ± SD for each bar) and across all seven nerves (black horizontal lines, mean ± SD).
Download figure:
Standard image High-resolution image
We performed various statistical analyses on the measurements made by the three authors who performed fascicular morphological measurements (supplementary figures 2–7, supplementary tables 2–4). The intra-class correlation coefficients for fascicle area, count and diameter were 0.83, 0.94 and 0.86, respectively, showing a good to excellent interrater reliability.
4. Discussion
MicroCT enables unique three-dimensional visualization and quantification of vagal fascicular morphology over long lengths of nerve, enabling new insights into the spatial organization of the nerve that are essential for the design and analysis of effective and selective electrical stimulation therapies to treat diseases. MicroCT has been used extensively in orthopedic studies and other fields, but the imaging technique has only recently been applied to neural tissues. For example, one study reported a protocol for staining rat sciatic and pig vagus nerves, optimization of computational methods for high-resolution three-dimensional images of nerve fascicles, and development of image analysis techniques to facilitate segmentation and tracing of the fascicles [47]. It is clear from these bodies of work that the nerve and fascicle morphology between mice, rats, pigs are substantially different from human anatomy [38, 47–49]. The fascicle morphology measurements obtained from our microCT data were similar to our prior data that used 2D histological sections [38]. Here, we demonstrated the unique value of microCT to quantify fascicular splitting and merging of the human cVN.
Given the magnitude of fascicular reorganization demonstrated by our data, current VNS cuff designs are likely not optimized to provide spatial selectivity. The current clinical standard involves surgical implantation of a cuff electrode that wraps helically around the entire nerve trunk, with bipolar contacts spanning ∼340°, separated by 8 mm center-to-center. For a representative nerve from our study, this 8 mm span would traverse over a dozen fascicle splitting and merging events (9.6–22.4 events from our dataset). Further, the fascicular reorganization varies substantially between individuals. Given this intra- and inter-individual morphological heterogeneity of fascicles, these electrode designs are unlikely to allow selective activation of spatially localized target fibers within the cVN.
There are many electrode designs that have been developed and tested to achieve fascicle-selective neuromodulation [23, 50–54]. Some considerations include the multi-polarity of electrodes [50], reshaping or flattening of the nerve to force fascicles into a more separated configuration [51–53], and the use of various transverse and penetrating intra- and inter-fascicular electrode arrays [23, 54, 55]. While our data does not directly support the use of one electrode design versus another, our work helps to define the morphological features of the vagus nerve from which design-evaluation studies can build.
For example, computational modeling of the vagus nerve can guide the engineering and design of neural stimulating devices [56]; the basis for these models requires anatomically accurate features that reflect the diversity observed across multiple human subjects. Currently, computational modeling of VNS relies on longitudinal extrusion of segmented histological cross sections, which neglect the longitudinal changes in morphology (figure 3(A)), or simplified synthetic morphologies, which do not represent precise fascicle boundaries. [54, 57–61] Autonomic stimulation therapies will be advanced by a priori personalized surgical planning, device design, and device programming for autonomic stimulation therapies informed by computational models as used in other neural stimulation treatments [62]. However, to make personalized decisions and improve the accuracy of the computational predictions, better in vivo imaging modalities are needed to visualize and map the fascicular morphology with higher precision and resolution in three dimensions [63].
While our results focus on fascicle organization, the endoneurium is also visible in both microCT and histological sections (supplementary figure 1). Qualitatively from our images it appears as though the endoneurial bundles merge and split with one another, forming a tertiary level of longitudinally-dynamic nerve fiber organization (supplementary video 1 and 2). Future studies could focus on determining how well the fiber bundles defined by unique endoneurium are conserved along the longitudinal distances of the nerve.
The fascicular anatomy of vagus nerve is highly complex and dynamic. Mapping nerves using microCT is an effective technique to visualize and quantify fascicle reorganization. We measured a mean of 17.8 split-or-merge events along 1 cm of the cVN (n = 8 specimens); thus, there would be ∼14.2 events along the bipolar electrode of current clinical VNS devices. The analysis of fascicle dynamics within the human cVN provides a unique perspective into the morphology of the cVN and its implications on VNS efficacy. Specifically, this analysis provides the foundation for building computational models to analyze and design therapies with improved selectivity to reduce off-target effects which can greatly improve patients' quality of life; thus, these therapies would provide an overall improvement in clinical outcomes.
Acknowledgments
The authors thank Rebecca Enterline and Andrew Crofton for their contributions in sample acquisition and handling. We thank Matt Schiefer for his role in the acquisition of equipment necessary for the execution of our studies. We would also like to recognize William Woodfint for his contributions to data review. At the time of publication, our dataset is currently under curation review from the sparc data resource center. We anticipate that it will be available for download from sparc.science.
This work was supported by NIH SPARC Program OT2 OD025340, US Dept. of Veterans Affairs 1IS1BX004384, the Cleveland VA APT Center, and Case Western Reserve University. The opinions expressed in this article are the author's own and do not reflect the view of the National Institutes of Health, the Department of Health and Human Services, or the United States government.
Data availability statement
The data that support the findings of this study are available upon reasonable request from the authors. Data will be available from 06 July 2023.
Conflict of interest
K A L is a scientific board member and has stock interests in NeuroOne Medical Inc. a company developing next generation epilepsy monitoring devices. K A L is also paid member of the scientific advisory board of Cala Health, Blackfynn, Abbott and Battelle. K A L also is a paid consultant for Galvani and Boston Scientific. K A L and A J S are consultants to and co-founders of Neuronoff Inc. None of these associations are directly relevant to the work presented in this manuscript.