

Abstract
Objective. Brain–computer interfaces (BCIs) show promise as a direct line of communication between the brain and the outside world that could benefit those with impaired motor function. But the commands available for BCI operation are often limited by the ability of the decoder to differentiate between the many distinct motor or cognitive tasks that can be visualized or attempted. Simple binary command signals (e.g. right hand at rest versus movement) are therefore used due to their ability to produce large observable differences in neural recordings. At the same time, frequent command switching can impose greater demands on the subject's focus and takes time to learn. Here, we attempt to decode the degree of effort in a specific movement task to produce a graded and more flexible command signal. Approach. Fourteen healthy human subjects (nine male, five female) responded to visual cues by squeezing a hand dynamometer to different levels of predetermined force, guided by continuous visual feedback, while the electroencephalogram (EEG) and grip force were monitored. Movement-related EEG features were extracted and modeled to predict exerted force. Main results. We found that event-related desynchronization (ERD) of the 8–30 Hz mu-beta sensorimotor rhythm of the EEG is separable for different degrees of motor effort. Upon four-fold cross-validation, linear classifiers were found to predict grip force from an ERD vector with mean accuracies across subjects of 53% and 55% for the dominant and non-dominant hand, respectively. ERD amplitude increased with target force but appeared to pass through a trough that hinted at non-monotonic behavior. Significance. Our results suggest that modeling and interactive feedback based on the intended level of motor effort is feasible. The observed ERD trends suggest that different mechanisms may govern intermediate versus low and high degrees of motor effort. This may have utility in rehabilitative protocols for motor impairments.
Export citation and abstract BibTeX RIS
1. Introduction
Brain–computer interfaces (BCIs) are systems designed to translate brain signals into commands for external devices. This technology offers a communication and control pathway that circumvents the peripheral nervous system and holds considerable potential for helping individuals disabled as a result of neuromuscular injury or neurodegenerative disease. A BCI takes on the challenge of discriminating changes in the user's brain signals associated with the task at hand [1]. Pre-processing and feature extraction transform neural signals from the brain into measurable quantities. These features are then translated into command signals that directly control a device such as a neuroprosthesis or computer cursor, which in turn provide feedback to the user for continued operation.
Today, BCIs are primarily limited to research environments due to usability challenges. The limited ability of classifiers to reliably discriminate between the EEG signatures associated with different tasks is a tremendous hurdle in BCI development; the need to juggle multiple distinct commands in real time requires great skill on the part of the subject, which can take longer to acquire [2]. BCIs often rely on volitional brain activity as control signals. But such activity is usually modeled on simple binary tasks, for instance hand movement versus rest; gradations in effort or fine control related to the task are not explicitly modeled, but are instead left to the controller to handle in a goal-directed task [3, 4]. It is interesting to speculate whether graded—as opposed to binary—responses will lead to improved BCI control. Here, we propose to model graded changes in the electroencephalogram (EEG) that convey the level of effort associated with movement. Measurable changes in brain activity can serve as commands that bridge the gap between intent and fine control and thereby play a vital role in therapeutic protocols aimed at recovery of function.
Such a signal may be found within the brain's sensorimotor rhythm (SMR). The SMR generally refers to characteristic EEG rhythms associated with sensation and movement [5]. At rest—i.e. the idling state—they reflect the dynamics of EEG potentials over the sensorimotor cortices [5–8], and are modulated or attenuated by movement intent, execution, or imagery [5], a phenomenon known as event-related desynchronization (ERD). Two components of the SMR—mu (8–13 Hz) and beta (13–30 Hz) [9]—have been widely used in BCI work with healthy and clinical populations [10, 11]. Prior studies using positron emission tomography [12] and functional magnetic resonance imaging [13, 14] have shown graded activation in a hand-force task within the sensorimotor cortex. Therefore, it is hypothesized that graded ERD signals associated with motor effort could be discerned in the EEG. If this is indeed feasible, it would offer a more information-rich signal for use in BCI applications.
Several studies have investigated neural markers of graded movement. Movement-related cortical potentials (MRCPs) have been used as markers of exerted or intended force [3, 15, 16]. Jochumsen et al demonstrated that MRCPs can be used to discriminate between two levels of force [17]. The peak amplitude of an MRCP may also encode generated force in the EEG [18]. The primary limitation with MRCPs is their considerable trial-to-trial variability [15]. MRCPs are typically averaged over many repetitions before their morphology becomes distinctive; therefore, an MRCP-based BCI may underperform with limited training [19]. Further, in cued paradigms, the MRCP can be conflated with evoked responses to visual stimuli [20]. An advantage of the MRCP is that it marks a specific phase of activity: i.e. movement onset. However, phase is less consequential in a sustained activity such as continuous force exertion, which is of interest here.
Cao et al [21] examined four different EEG frequency bands within the 8–45 Hz range and found reduced power at low compared to high handgrip force. Attenuation of the SMR during force exertion in a movement task hints at the possibility that the level of attenuation may correlate with force. Characterizing and quantifying the spatiotemporal profile of cortical SMR activity during different levels of a specific movement might pave the way for the use of graded ERDs as BCI command signals. We hypothesize that features of the SMR observed during controlled isometric force exertion are separable for different levels of force and can therefore be used to predict applied force. While an impaired individual may be unable to generate any force, let alone the desired value, the same SMR features may convey their intended effort in the motor task and serve as the basis for a control signal in an assistive or rehabilitative BCI therapy, for instance, one that involves functional electrical stimulation. We set various target force levels that the subject must reach and maintain while performing a handgrip contraction in response to a cue. Subjects were given continuous visual feedback based on their applied force. Features of the EEG during force exertion were extracted offline, and classification and regression models trained to predict the target force class and value, respectively, in out-of-sample data. The ability to predict graded motor effort from the EEG during isometric force production could help further our basic understanding of the dynamics of SMR modulation with possible implications for BCI development.
2. Methods
2.1. Subjects
Fourteen healthy human subjects (nine male, five female) participated in this study after providing informed consent. Procedures were approved by the University of Kentucky Institutional Review Board in compliance with the Declaration of Helsinki. Visual or neuromuscular impairment as well as recent injuries to the hand or forearm were specified as exclusion criteria. All subjects but two were right-hand dominant.
2.2. Experimental design
A visual display presented intermittent cues to the subject for three phases of activity in sequence: (a) Preparation, (b) Task, and (c) Rest (figure 1). This sequence was repeated 21 times to make a run, during which EEG was recorded. In total, 12 runs were performed in a session and each subject participated in exactly one session. During the experiment, subjects were seated approximately 1 m in front of a computer display. Instructions were given to minimize any movement during Preparation and Rest but to perform a controlled handgrip contraction on a hand dynamometer during the Task phase. Immediate feedback was given to the subject in the form of a blue ring, whose diameter varied dynamically in proportion to the measured handgrip force (figure 1). The goal was to apply just enough force for the blue ring to match a preset target force represented by a concentric dotted black ring and maintain that force level for the duration of the Task phase. In a subset of cues representing a control 'No-Go' condition, subjects were directed not to perform the handgrip contraction during the Task phase. Five of the 21 cues in every run were No-Go cues, interspersed at random.
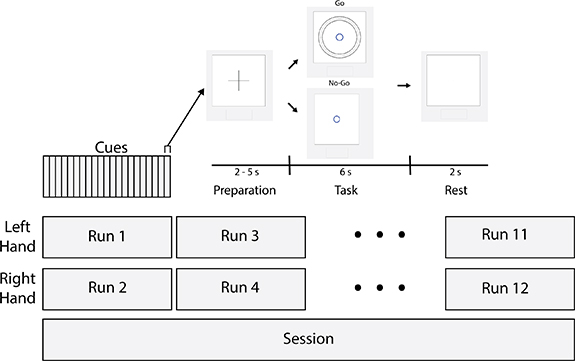
Figure 1. Schematic of testing protocol. Runs were composed of 21 cues consisting of Preparation, Task, and Rest phases. In five of the 21 cues, the subject was instructed not to squeeze (No-Go); this serves as a statistical control. The diameter of the black rings is set proportional to the target force and the innermost blue ring grows or shrinks based on force measured by the hand dynamometer. Runs alternated between the left and right hands. The first eight runs featured fixed force targets (20%, 35%, 50%, or 65% maximum voluntary contraction (MVC)), whereas the target forces varied from 10% to 80% MVC at random in each of the last four runs.
Download figure:
Standard image High-resolution imageTarget forces were set to specific percentages of each subject's MVC force measured for each hand at the beginning of the session. In the first eight runs, the target force was set to the same discrete value for every cue within that run. This was done to help the subject create and maintain a mental strategy for an expected target and perform the task consistently across cues. The target forces were set to 20%, 35%, 50%, and 65% of the subject's MVC. In the last four runs, the target force for each cue was randomly selected from a uniform distribution on a continuous interval between 10% and 80% of the subject's MVC. Hence, the subject would not be able to anticipate the target force in each cue before starting to perform the task. Fatigue is an important factor to consider in a movement-based protocol. As depicted in figure 1, runs alternated between the left and right hands, which gave subjects at least a 5 min break between runs on a particular hand. In the first eight runs, the target force alternated between a low-effort value (20% and 35% MVC) and a high-effort value (50% and 65% MVC) for every other run on the same hand (and was held constant for all cues within each run). The order in which the subject encountered each low-effort value (or high-effort value) was randomized: for instance, one subject may encounter runs with target forces in the sequence 20%, 65%, 35%, 50% MVC, while another might see the sequence 35%, 50%, 20%, 65% MVC. This was done to avoid introducing progressive changes in the target force as a confounding variable. Subjects were allowed to rest between runs if needed.
2.3. Data acquisition
Grip force was measured as an analog voltage signal by a hand dynamometer (HD-BTA, Vernier Software and Technology, Beaverton, OR). The EEG was simultaneously acquired using active electrodes (g.SCARABEO, g.tec medical engineering, GmbH, Graz, Austria) at 18 locations on the scalp defined by the International 10–20 positioning system [22] (figure 2). The electrodes were embedded in a cap strapped to the subject's head and a conductive gel was injected into an aperture on each electrode to reduce impedance and improve signal quality. The EEG was sampled at 256 Hz synchronously with the hand dynamometer using a biosignal amplifier (g.HIamp, g.tec medical engineering, Graz, Austria) and pre-processed with 4th order Butterworth bandpass (0.1–100 Hz) and notch (58–62 Hz) filters. Some channels were used only to detect ocular artifacts (F4) or evaluate signal quality during setup (PO7, POz, PO8), and were excluded from further analysis. Electromyography was performed to measure flexor carpi radialis muscle activity in both forearms to confirm grip onset time.

Figure 2. Scalp montage. 18 total active electrodes recorded EEG (gray) with an ear clip reference (A1) and ground (AFz). Electrodes at F4, PO7, POz, and PO8 were excluded from feature extraction.
Download figure:
Standard image High-resolution image2.4. Signal processing
Offline, all data were processed in MATLAB (release 2017a, Mathworks, Natick, MA) using the Signal Processing toolbox and custom-written scripts as needed. After applying a common average reference, the EEG signals were sent through a 4th order Butterworth filter with a pass band of 8–30 Hz, the EEG frequency range corresponding to the SMR. This signal was then squared to obtain an estimate of SMR band power. Using data from the cue state and hand dynamometer, EEG signals were segmented into their different phases: Preparation, Task, and Rest. For each cue, the mean-squared SMR power in each EEG channel was computed over the last 5 s of the Task period. We focused on this time interval, highlighted in figure 3, to allow time for the subject to meet the target force and stabilize muscle contraction. The first cue in each run allowed the subject to adapt to the particular target force and was omitted from analysis. On each channel, EEG power estimates X at time j were then normalized by a baseline value R (see equation (1)) to obtain a measure of the ERD [23]:

Figure 3. Temporal location of EEG data used for feature extraction. Top row: the timing of visual cues given to the subject. Middle row: the corresponding measured force is displayed. Bottom row: EEG signals were segmented into five 1 s windows (blue) at the end of the Task phase.
Download figure:
Standard image High-resolution imageR was computed as the mean band power over the final one second of the Preparation phase for each cue of a given run. ERD is expressed as the percent change in X relative to R and takes on values in the interval (−1, +∞). To eliminate occasionally observed high amplitude spike-like artifacts in the EEG, a Hampel filter (hampel function in MATLAB) was applied to replace outliers in the ERD traces greater than six standard deviations from the median by the value of the median in a quarter-second moving window [24]. Then, the mean of the ERD vector over 1 s intervals was used as the input feature for force prediction. A label corresponding to the target force was assigned to each ERD value for use in classifier training and testing.
2.5. Graded ERD feature analysis
In order to verify that the ERD feature of the EEG was steady over the period of each cue selected for analysis, during which hand contraction is performed to match the stipulated target force, we computed the coefficient of variation (CV)—i.e. the standard deviation over the mean—over the five 1 s windows of the analysis period of the Task phase. This was repeated using the force signal from the hand dynamometer. The ERD values computed in each window form a vector with n = 14 spatial components, one for each EEG channel used in the analysis. Rather than study ERD at each location in isolation, the Euclidean norm (L2) of the ERD vector was computed after shifting each component by +1, or +100%, so that it is contained in (0,+∞). This was then normalized by  , the L2 norm of the unity vector, which is equal to
  for this vector space, and then the natural logarithm taken to give a scalar measure, gamma (γ) of ERD strength over the scalp (equation (2)). This method avoids averaging out focal contributions from specific locations that may be stronger or weaker than others. That is:
γ is negative, positive, or zero depending on whether mu-beta EEG activity is suppressed, elevated, or unchanged relative to the baseline period of each cue. The standard deviation and mean of γ over the five windows of each cue were used to compute the CV to estimate ERD variability in the force exertion period. Since identical or similar values of γ can arise from different spatial ERD maps—for instance, focal ERD troughs at C3 versus C4 for right-handed versus left-handed tasks, respectively—we propose an additional metric to assess spatial differences from one analysis window to another within a cue. For any pair of 1 s windows k and l, we use the cosine of the angle between their ERD vectors—estimated through their scalar product—as a measure of difference in spatial orientation:
Positive values close to 1 suggest strong agreement between spatial ERD maps of the windows in question, while zero or negative values indicate spatial differences. With five windows per cue, there are  unique pairs of ERD vectors. cos θ was computed and averaged over all unique pairs for each cue and independently for each subject-hand combination. Together, CV(γ) and < cos θ > tell us how variable the intensity and pattern of spatial ERD maps are during the motor control task performed in response to each cue.
2.6. Graded target force prediction from the EEG
Movement-based BCIs typically make predictions about user intent and behavior using classification and regression modeling techniques [25]. Therefore, both types of supervised machine learning approaches were tested to fully evaluate the potential of graded ERD for force prediction. A k-fold cross-validation scheme was employed for training the predictor and testing it out of sample. The ERD values for each subject were randomly divided into k = 4 folds. Data to train the model came from k-1 folds and predictions were made for the remaining kth fold and compared with the true target forces. By repeating this exercise with each of the k folds as the test sample in turn, all of the data were tested out-of-sample. To reduce classification bias, the training and testing sets were generated using a block-based design within each fold such that all 1 s windows in a particular cue were assigned together to either the training or test set. This method allows us to better assess the generalizability of the model. Data were analyzed separately for each subject-hand combination and presented according to hand dominance. Data from the left-handed (non-dominant) runs in subject 4 were corrupt and therefore excluded from analysis.
Three commonly used machine learning algorithms were used to classify the ERD values into target forces: linear discriminant analysis (LDA), the support vector machine (linear kernel) (SVM), and the multilayer perceptron (MLP). All three are computationally inexpensive, which makes them good candidates for use in future studies involving online classification [26].
To determine the feasibility of predicting grip force over a continuous interval rather than just the nominal force class, a linear regression model was fitted to the ERD-target force data (fitlm function in MATLAB). Two models were built to adequately test the value of a continuous predictor. In the first (see section 3.3.1), features from runs 1 to 8 were tested using four-fold cross-validation identical to what was performed in the classification tests. And in the second (see section 3.3.2), the model was trained on ERD values from the first eight runs and tested by using ERD values to predict target force in the last four runs (continuous-valued target force). To prevent the model from predicting forces outside the physically realistic interval of 0%–100% MVC, a sigmoidal link function was used to scale predicted grip force values so that they asymptotically approach either limit of this interval, and the inverse of this function was applied to target force values to stretch them over the interval (−∞, +∞) before estimating the linear regression model.
2.7. Statistical analysis
Several different statistical tests were used in this study. All tests were performed separately for each hand, under the premise that control of grip may be asymmetric for dominant and non-dominant hands. CV was calculated as the standard deviation across all five windows of a given cue divided by their mean (see section 3.1). The effect of target force on γ was assessed separately for dominant and non-dominant hands by fitting linear and quadratic models to the pooled data and comparing their goodness of fit (see section 3.1). Classification accuracy is presented as a confusion matrix and to examine where errors occurred, cumulative distribution functions (CDFs) were used (MATLAB function ecdf). A two-sample Kolmogorov–Smirnov (K–S) test compared the CDFs of pooled results, stratified by hand dominance, with chance level (see section 3.2). The effect of hand dominance on classification accuracy was tested using two-sample t-tests (see section 3.2). For the regression analysis (see section 3.3), the coefficient of determination (R2) between true and predicted force labels was computed to determine the percentage of variance explained by the model. This value was obtained from the total number of predictions separately for each subject-hand combination. As the number of independent variables increases (channels in this case), the value of R2 will increase. To penalize R2 for inclusion of non-informative EEG channels, we report the adjusted R2, which will lead to lower values than the conventional R2. Another benefit of reporting the adjusted R2 is that it allows for comparison of results with other studies using different electrode montages [27].
3. Results
3.1. Evidence for gradation in the ERD with handgrip force
Prior to modeling and analysis, the ERD feature vector was extracted from the EEG in five 1 s windows during isometric force exertion in response to each cue; each sample was assigned the same label as the target force for the cue. To determine if the assumption of stable force and ERD measurements during the force exertion period was indeed valid, we quantified the variability across the five sample windows of applied force (figure 4, top), ERD strength (figure 4, middle) and the spatial ERD pattern (figure 4, bottom) using constant target force data (runs 1–8).

Figure 4. Measures of variability between sample windows, pooled for all subjects, from the first eight runs. Top row: CV of handgrip force, computed from the five 1 s windows of each cue and for each of the four target forces. Middle row: CV of γ, computed likewise over sample windows and for each target force as well as for the No-Go condition. Bottom row: CDFs of < cos θ >, which represents the average 'difference' in orientation between the ERD vectors of unique pairs of the five sample windows.
Download figure:
Standard image High-resolution imageThe CV of force, pooling cues for all subjects, had mean values of 8.5%, 9.1%, 9.9%, and 11.1% for the dominant hand and 9.0%, 9.5%, 10.8%, and 13.8% for the non-dominant hand corresponding to target forces of 20%, 35%, 50%, and 65% MVC, respectively (Note: No-Go is excluded since no grip force is exerted). A one-way repeated measures ANOVA comparing the CV of force for the four target forces, and performed separately for each hand, showed that only seven of the 27 possible subject-hand combinations (14 dominant, 13 non-dominant) had statistically significant differences (p < 0.01), five of which were for the non-dominant hand.
Similarly, the distributions of CV of γ showed no significant differences between the four target forces. The CV was greatest for the No-Go condition with a mean of 34.9% and 32.6% for the dominant and non-dominant hand, respectively. Altogether, only six of the 27 possible showed statistically significant differences between target forces with three combinations each from the dominant and non-dominant hands, respectively.
The CDF of < cos θ > (figure 4, bottom) showed strong separation between the No-Go and four target force conditions, with a two-sample K–S test showing statistically significant differences in the distributions for No-Go and each of the four target forces, with the exception of 20% MVC for the non-dominant hand (p = 0.024). Between target forces, the only significant post hoc pairwise differences were for 20% versus 35% and 20% versus 50% in both the dominant and non-dominant hand. No-Go traces in both plots are skewed to the left and therefore more variable in the ERD pattern than any of the 'Go' conditions.
The CDF of γ, a measure of ERD vector strength, is presented in figure 5 separately for each sample window and each target force, stratified by handedness. Negative values for γ indicate suppression of the 8–30 Hz EEG rhythm. The No-Go condition has grand medians (cumulative probability = 0.5) of 0.051 and −0.0459 for dominant and non-dominant hand groups, which indicates slight but negligible suppression or elevation of the SMR due to random effects, whereas median γ for the four movement classes, in each of the five 1 s windows, is well below zero and indicative of clear suppression of the SMR. Figure 6 (top panels) presents a box-and-whiskers distribution of γ, averaged for each subject-hand-target force combination over all cues and windows at that target force from runs 1–8. Each subject's γ values were scaled by the (max–min) range over all five target forces, which made their distributions approximately normal (Shapiro–Wilk test; p < 0.05); the lone exception was the No-Go group from the dominant hand. As expected, No-Go is mostly at or above zero while all active force classes show SMR suppression (negative values of γ) to varying degrees. The median values appear similar to each other for the dominant hand; however, for the non-dominant hand it appears to be lower for 35% and 50%, the middle target forces, than for 20% and 65%, the low and high limits employed in this study. This trend suggests that γ drops from zero as the target force increases but passes through a trough at which it may reverse course.
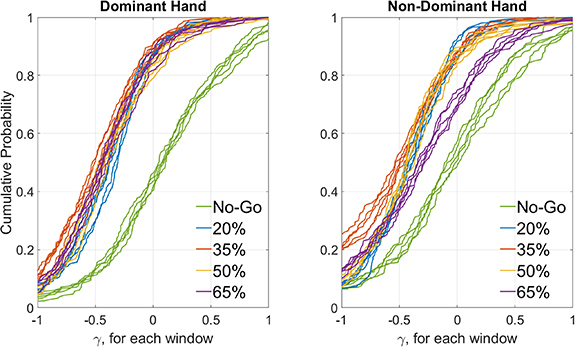
Figure 5. Distribution of ERD strength by sample window and target force. CDFs for the γ metric, pooled across subjects for each of the five sample windows during grip force exertion and for each target force class from the first eight runs, stratified by hand dominance. In both plots, a greater percentage of γ values are positive, or elevated, for No-Go compared to the four target forces. There is greater separation between various target forces in the non-dominant hand, particularly for 65% MVC, and at lower percentiles of γ for the other target forces.
Download figure:
Standard image High-resolution image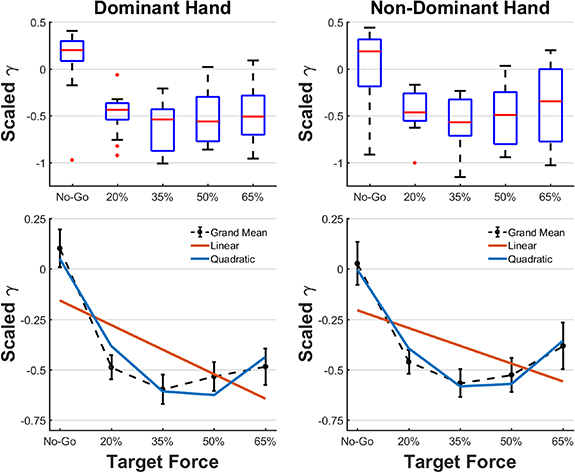
Figure 6. Effect of target force on ERD strength. Top row: the distribution of γ, normalized for each subject and averaged over all cues for each subject separately. Across target force classes in the dominant (n = 14) and non-dominant (n = 13) hands, the trend in ERD amplitude suggests a non-monotonic dependence on effort. In general, the middle target forces (35% and 50%) show greater suppression of the SMR than the low (20%) and high (65%) target forces. Bottom row: to test these observations, the data were fitted to linear and quadratic models and their goodness-of-fit compared. The rSS was lower for the quadratic fit (5.99, 6.79) than the linear fit (8.09, 8.64) for the dominant (df = 69) and non-dominant (df = 64) hands, respectively. These indicate that the non-monotonic model better approximates the effect of exerted grip force on ERD strength.
Download figure:
Standard image High-resolution imageTo test for significant trends in γ with exerted grip force, linear and quadratic functions were fitted to the data (figure 6, lower panels). The residual sum of squares (rSS) was computed for each fit separately for dominant and non-dominant hands. The rSS was lower in the quadratic fit (5.99, 6.79) than the linear fit (8.09, 8.64) for the dominant and non-dominant hands, respectively. To compare the linear and quadratic fits, a non-parametric Wilcoxon signed-rank test was carried out on the sample of differences in their squared prediction errors. The quadratic model explained the trend in the data significantly better than the linear model for both the dominant (p = 0.0088) and non-dominant hands (p = 0.0431). To further test these results, the outliers in the box-and-whiskers plot (red points in figure 6, upper panels), which are by definition more than one inter-quartile range away from the nearest quartile, were excluded and the signed-rank test repeated. This further improved the fit of the quadratic model relative to the linear one for both dominant (p = 0.0031) and non-dominant hands (p = 0.0292). The data corresponding to these outliers were included in subsequent analyses since there was no evidence of poor signal quality or other artifacts to explain their occurrence and warrant exclusion. These findings support the ERD reversal trend observed in figure 6 but further experimentation is needed to prove it beyond doubt.
3.2. Prediction of target force label using statistical classifier models
Performance was evaluated by comparing the predicted force labels with the true target force labels of the testing data using various models. The analysis was performed for both hands and the results stratified by hand dominance under the assumption that the ability to control grip force may be asymmetric. Models were created and tested separately for each subject-hand combination.
Classifiers were trained and tested on separate data from each subject. Only the first eight runs, which included four distinct target forces (20%, 35%, 50%, and 65% MVC) and the No-Go condition, were analyzed. Classification accuracy is reported by target force and handedness across subjects in table 1. The SVM was best at discriminating between movement and rest, with the highest mean No-Go classification accuracy of 76%. However, it did worse than the other classifiers for higher target forces, with mean accuracy ranging from 25% to 45%.
Table 1. Classification accuracy by classifier. Results are stratified by hand dominance and presented as mean (S.D.) in percent across subjects.
| Hand | |||
|---|---|---|---|
| Classifier | Target force | Dominant | Non-dominant |
| LDA | No-Go | 54 (10) | 49 (12) |
| 20% | 42 (18) | 42 (17) | |
| 35% | 47 (19) | 60 (22) | |
| 50% | 61 (21) | 55 (18) | |
| 65% | 63 (22) | 67 (20) | |
| SVM | No-Go | 74 (10) | 76 (10) |
| 20% | 62 (19) | 56 (20) | |
| 35% | 37 (19) | 33 (25) | |
| 50% | 25 (19) | 28 (22) | |
| 65% | 27 (22) | 45 (30) | |
| MLP | No-Go | 59 (16) | 57 (13) |
| 20% | 43 (16) | 43 (18) | |
| 35% | 45 (13) | 54 (21) | |
| 50% | 62 (19) | 66 (19) | |
| 65% | 64 (22) | 69 (22) | |
Due to space limitations, only analysis of LDA predictions is presented here, though trends were similar for all three classifiers. Classifier performance is expressed as a confusion matrix of results, pooled over all subjects (figure 7). True and predicted classes are organized along rows and columns, respectively. The grand mean prediction accuracies over all five target force classes were 53% and 55% for dominant and non-dominant hands, respectively. Two-sample t-tests showed no statistically significant differences in classification accuracy between dominant and non-dominant hands for any of the five classes. Below each confusion matrix is the CDF over all cues of the absolute error between true and predicted values of target force. For reference, the pairing of true and predicted labels was scrambled, in a block-based manner according to cue, and the CDF of the corresponding absolute error computed (see traces in figure 7 labeled 'Random'). Comparing the true and randomized sample CDFs, the model's prediction error was consistently and significantly lower (to the left) according to a two-sample K–S test for both the dominant and non-dominant hands.
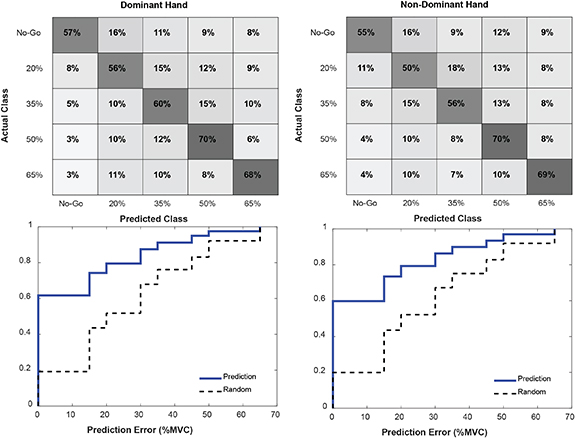
Figure 7. Classifications using LDA, pooled across all subjects and separated by handedness. Top: confusion matrices of true versus predicted target force labels. Bottom: empirical CDFs for the pooled prediction error (blue) and randomized prediction error (dashed black). A two-sample K–S test confirmed that the model's prediction error was significantly lower (p < 0.01) for both dominant and non-dominant hand predictions.
Download figure:
Standard image High-resolution image3.3. Prediction of target force label using linear regression models
Relating exerted force to EEG variables using a regression model allows force to be predicted on a continuous-valued ordinal scale rather than in terms of discrete nominal class labels that may have no relationship with each other. Discrimination between a relaxed, non-movement state and simple hand movement has been well documented for decades. Therefore, No-Go data were excluded from this analysis to avoid misinterpreting differences in ERD between No-Go and 'Go' as evidence for a graded correlation between ERD and target force. For instance, if no differences in ERD between the four target forces existed, but they were all different and greater in magnitude than the ERD of No-Go cues, there would be an artificial correlation.
3.3.1. Prediction of discrete-valued target forces
To first test the feasibility of using linear regression to predict grip force from the ERD, the discrete-valued target force data (runs 1–8) were used to train such a model and test it using a four-fold cross-validation scheme. This was performed separately for each subject-hand combination. From figure 8, the mean ± standard deviation of the adjusted R2 values across subjects is 0.22 ± 0.15 and 0.21 ± 0.12 for the dominant and non-dominant hand, respectively, indicating only slight agreement. A two-sample t-test between the adjusted R2 values for the dominant and non-dominant hands showed no significant difference (p ≫ 0.01). As expected, scrambling the association between true and predicted values brought the adjusted R2 down close to zero. The distribution of predicted target force for each of the four classes, per subject, is shown using box plots in figure 9. In many subjects, the predicted value of target force appears to increase monotonically with true target force.
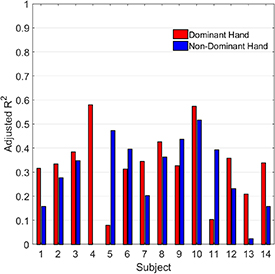
Figure 8. Correlation of predicted and true force targets for each subject. The adjusted R2 was computed separately for runs performed with the subject's dominant and non-dominant hand. The grand average R2 was 0.22 ± 0.13.
Download figure:
Standard image High-resolution image
Figure 9. Model predictions for each discrete target force class obtained from a linear regression model estimated from dominant hand data for each subject and pooled across all subjects (bottom right). Each box plot represents the distribution of out-of-sample predictions for one of the constant-valued MVC targets.
Download figure:
Standard image High-resolution image3.3.2. Prediction of continuous-valued target forces
To assess the feasibility of predicting target force on a continuous-valued interval from ERD measurements with linear regression, a model was constructed using data from all the constant target force runs (runs 1–8) and tested on data from the variable target force runs (runs 9–12). Predicted values are concentrated around 45% MVC, which is equidistant from the end points of the 10%–80% MVC interval (not shown). Adjusted R2 values were found to be near zero for all subject-hand combinations except for the dominant (left) hand of subject 7 (adjusted R2 = 0.159). The R2 values for the case of an equivalent test set range (only target forces between 20% and 65% MVC) were then set aside as a separate testing set. The adjusted R2 in this set was not meaningfully different from inclusion of 10%–20% MVC and 65%–80% MVC targets, with adjusted R2 values near zero.
4. Discussion
4.1. Spatial ERD changes with grip force
In this study, we set out to model and characterize graded changes in the EEG SMR associated with motor effort. We measured grip force and ERD features during isometric handgrip contraction to different percentages of the MVC in healthy human subjects (n = 14). Not only did we find that different levels of constant grip force could be classified and their values predicted from the ERD vector, but also that attenuation of power in the SMR mu-beta band may vary with exerted grip force. The topographical distribution of the ERD suggests that its amplitude and spread across the scalp vary with target force (figure 10, generated with code adapted from [28]). There is some inherent variability across subjects in the ERD pattern—as may be expected from individual differences in the extent of mu-beta modulation, electrode placement, measurement noise, etc. But, in general, γ—a crude summary measure of ERD strength derived from the spatial ERD vector—seems to follow a parabolic trend, with greater SMR attenuation for targets of 35% and 50% than for 20% and 65% of the MVC (figure 6). These differences clearly exceeded the variation in the ERD over the 5 s of each cue in which subjects maintained their grip force at the target value (figures 4 and 5). Although every effort was made to monitor and regulate the subject's behavior during the task to avoid strain, the possibility of muscle artifact contributing to the attenuation of the ERD at 65% MVC cannot be ruled out altogether.
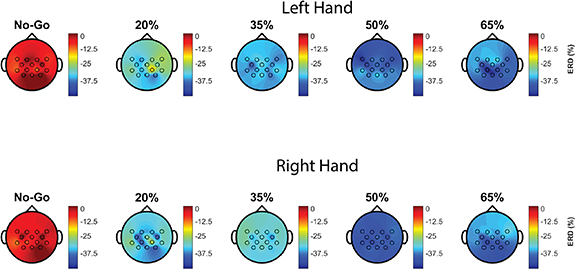
Figure 10. Topographical distribution of the ERD in a handgrip task. A colormap is presented of ERD variation with scalp location and target force averaged across subjects separately for left-handed runs (top row, n = 14) and right-handed runs (bottom row, n = 13) with the color axis in units of percent. The No-Go condition, in which the subject does not perform a handgrip contraction, shows minimal ERD, which confirms that confounding effects attributable to the visual display or cue dynamics are unlikely. The ERD appears to get broader and deeper as the target force increases but hits a trough at 50% and reverses course thereafter.
Download figure:
Standard image High-resolution imageWe also examined whether the ERD is lateralized: i.e. contralateral suppression of mu-beta power is greater than in areas ipsilateral to the hand performing the task, which is to be expected in normal movement. We formulated a lateralization index (L) that measures contralateral suppression during the handgrip task averaged over the task performed on both hands. That is, taking symmetric channel pairs—for instance consider C3 and C4—we compute the average over both hands of the ERD ratio for the channel contralateral to hand movement (C3 for right hand, C4 for left) relative to the corresponding ipsilateral channel (C4 for right hand, C3 for left). That is:
where ERD(C3,RH) is the ERD measured at C3 for right hand movement, ERD(C4,LH) is the ERD at C4 for left hand movement, and so on; The ERD is averaged over all cues for the subject, hand, and target force in question. This is similar in form to measures of lateralization seen in the literature [29] where positive and negative values indicate contralateral and ipsilateral ERD respectively. L was computed in a moving 1/8 s window at each time point relative to cue onset, averaged over all cues for that target force, and then scaled by L similarly computed for the same symmetric channel pair, but for the No-Go condition. That is:

This normalization was done to control for baseline lateralization associated not with movement but with visual recognition of the cue, continued engagement in the task over multiple cues, and other extraneous factors.
 traces relative to cue onset were computed separately for each subject (except subject 4, whose right hand data were corrupted) and target force. To correct for individual differences in scale,
  was further normalized separately for each subject by the difference between the 95th and 5th percentile values of
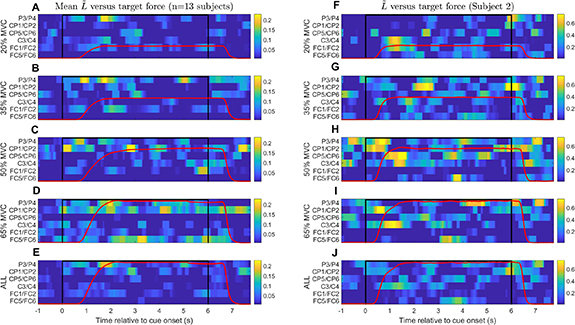
  over all target forces. Average trends over all subjects (n = 13) are shown in figure 11 (panels A–E) along with the cue state and mean grip force trace: from the top, panels A–D are for 20%, 35%, 50% and 65% MVC, respectively, while panel E is for all target forces pooled. Although there is general evidence of lateralization the timing and presentation of these phenomena are variable. However, some common features are noted:
- (a)In figure 11, (panel E), P3/P4 is strongly lateralized just before movement onset (0–1 s) and peaks as the force trace reaches a plateau (1–2 s), soon followed by CP1/CP2 (2.5–3 s).
- (b)Fronto-central lateralization (C3/C4, FC1/FC2) is most visible at movement onset and termination but dissipates during sustained force exertion (2–5 s), indicating bilateral ERD symmetry. This is consistent with prior knowledge that mu-beta ERD becomes bilaterally symmetric as movement proceeds [30]. That the effect is not particularly strong may be explained by the repetitive nature of the task, a known phenomenon dubbed 'repetition suppression' [31]; moreover, the amplitude of mu-beta ERD lateralization during motor imagery appears inversely correlated with task duration [29].
- (c)Lateralization in the hand area (C3/C4) may vary with target force:
 is stronger at 20% and 65% than at the intermediate values (35% and 50%) at movement onset (0.5–1.5 s). This is further illustrated using subject 2 as an example (figure 11, panels F–J). The trend is reversed at movement offset (t = 6–7 s) in the same channel pairs: is stronger at 35% and 50% than at 20% and 65%. During constant force exertion (t = 2–5 s) the patterns are variable but across locations seems stronger at 35% and 50% than at 20% and 65%. Though anecdotal, these patterns bring to mind the trend in γ with target force noted in figure 6.


Figure 11. ERD lateralization versus target force. ERD values for pairs of electrodes symmetric about the midline (e.g. C3/C4, P3/P4) were used to compute a lateralization index  to highlight locations and time periods in which the contralateral ERD was greater than the ipsilateral ERD. This is plotted against time relative to cue onset and the Task period is indicated (black line). Mean force traces (red) are overlaid as a guide to when force was exerted by the subject. Left column (A)–(E): cue-triggered averages of
  over 13 subjects (subject 4 excluded) separated by target force (A)–(D) and for all target forces pooled (E). Right column (F)–(J): Similar plots for subject 2 alone. There is strong lateralization for P3/P4 just before movement onset (0–1 s) followed by CP1/CP2 once force becomes stable (2.5–3 s). Lateralization in fronto-central channels is most evident at movement onset and offset but less so during continued force exertion. C3/C4 lateralization may vary with applied force.
  is stronger at 20% and 65% than at intermediate values (35% and 50%) at movement onset (0.5–1.5 s).
Download figure:
Standard image High-resolution image
These observations fit the general picture of voluntary motor control: movement is planned and initiated in the premotor/motor areas of the frontal lobe related to the hand performing the task, whereas sustained movement and feedback control may require broader bilateral engagement. Coordinated hand-eye movement to reach the target engages association cortex in the parietal lobe. A more formal analysis of spatiotemporal dynamics and the effect of target force using dense EEG and source localization is required to verify these crude observations; this is beyond the scope of the present study. However, the observations are consistent with previous studies, which note that lateralization of beta power in the pre-movement period is associated with motor selection [32] and may be weaker for sustained movement—as is the case in our study—compared to brief movement [29]. Our analysis also confirms that lateralization at movement onset gives way to bilateral mu-beta suppression with a possible dependence on the force being exerted, which needs to be investigated.
4.2. Prediction of discrete and continuous-valued target force
Three different classification techniques as well as linear regression models were used to assess the ability to predict graded grip force from movement-based ERD.
A linear discriminant classifier predicted the target force level with an average accuracy of about 54% for five distinct classes—much greater than the theoretical chance level of 20% (see section 3.2). Classification using SVMs was 46% accurate (table 1). This contrasts slightly with the results of the study by Yong et al in which SVMs narrowly outperformed LDA in a similar task [33]. MLPs were also tested due to their flexibility and growing popularity in BCI studies [34]. Mean classification accuracy of MLPs was 56%, comparable to LDA. However, the greater computational cost of training MLPs as opposed to LDA may increase the latency of prediction in a real-time BCI.
When a regression model was applied, performance was dependent on the data used for training and testing. Specifically, using data from runs in which the target force was constant from cue to cue within the run (section 3.3.1) a regression model trained and tested with a four-fold cross-validation scheme gave an average adjusted R2 value of 0.22 between predicted and true target force values—an indication of low-to-moderate correlation.
Despite the promise of the regression model when used to model and predict discrete values of grip force at four different levels (runs 1–8), performance was poor when these discrete-value-based models were tested on data from the continuous-valued target runs (runs 9–12), when the target force value for each cue is selected at random from 10% to 80% MVC and cannot be anticipated (see section 3.3.2). In this case, the adjusted R2 did not show any meaningful correlation between true and predicted target forces. It is possible that not being able to anticipate the target value led to greater oscillation and settling time in the grip force as the target value is approached, and that the variability in the EEG features of the test set is greater as a consequence. In hindsight, including continuous-valued target runs in which information about the force required in the upcoming cue is available prior to movement onset would have allowed this hypothesis to be tested. Further, the regression model attempts to model force as linear in ERD, although the presence of multiple ERD components may confer some flexibility. It is possible that the true dependence is nonlinear and thus not amenable to linear regression, which would explain the modest fit.
4.3. Comparison with previous work on EEG-based force prediction
Several studies in the past have examined the feasibility of using features of the EEG to distinguish between levels of exerted motor effort. In a side arm lateral raise task, one study found that when subjects lifted three different loads (0, 1, and 3 kg), 8–12 Hz power was not significantly different between the 1 and 3 kg conditions [35]. However, both the 1 and 3 kg conditions had significantly lower power than the 0 kg condition. That is, lifting an external load affects the EEG, but differences between loads are not discernible. They hypothesized that neuronal recruitment was only minimally elevated when lifting 1 kg versus 3 kg. Paek et al [36] reconstructed force trajectories in an isometric force production task offline, and found the strongest correlation in the mu (8–13 Hz) and beta (13–30 Hz) bands. However, they were unable to distinguish between grip forces of 5%, 10%, and 15% MVC applied by the subject. It could be that this is too narrow a range of motor effort to distinguish using the EEG. In this study, we tested over a fairly large range, up to 65% of the subject's MVC (in the discrete-valued target task, runs 1–8), where substantial recruitment of motor units and thus significant changes in the SMR may be expected. In an online paradigm where subjects imagined high effort (30% MVC) and low effort (10% MVC) hand clenching, Wang et al found that the ERD of the mu and beta bands during motor imagery was lowest for 30%, moderate for 10%, and highest for the relaxed state, with an average classification accuracy of 70.9% [37]. This was well above chance for a three-class predictor. However, only two levels of effort above the resting state were investigated. Our work includes four levels above rest over a wider range of MVC and demonstrates graded modulation of the SMR with effort. On the other hand, Wang et al [37] investigated ERD associated with motor imagery, performed immediately after the actual movement to help the subject better visualize the target force, whereas we modeled ERD during actual force exertion. Imagery may be more directly relevant to BCI use in an impaired population. However, there is no way to verify that the subject has imagined 'correctly'; this is why we chose to analyze movement as a first step, which allows us to confirm that the target force was reached and maintained. Subsequent efforts could involve protocols that emphasize imagery, motor planning, or constrained/impaired movement.
One consequence of investigating a broader range of effort may have been the finding that the vector ERD amplitude may not increase monotonically with target force but reverses course somewhere in the middle. This was unexpected, since we initiated the study assuming that any cortical predictor of effort in this simple motor task would vary in proportion to it and saturate at some point. We speculate that in this specific motor task, which involves continuous control of exerted force at different levels, the cognitive loading and attention required for the low and high effort targets are distinct—and perhaps lower—compared to those in the middle, which are harder to differentiate. This is consistent with studies that point to different spatial patterns of alpha reactivity corresponding to motor activation and visual attention [38]. Furthermore, the parabolic trend seen in our data is much more significant on the non-dominant hand compared to the dominant one; which may again reflect on the greater engagement required when performing the task with the non-dominant hand.
4.4. Limitations and future work
One factor that may have obscured ERD trends related to motor effort is the target force itself, which was used as a measure of effort. The MVC can vary greatly across subjects and even with repeated measurement; besides, the same % MVC can reflect very different actual forces across subjects. On the other hand, the same absolute target force can evoke different perceptions of effort in different individuals. The choice of which to use is therefore not trivial.
Another aspect of the design was the use of repeated cues at the same target force within a run. This was done to limit 'noise' in the ERD due to subject uncertainty associated with each target. The fact that force prediction using models of variable target force runs did not perform as well as those trained on constant force runs suggests that this is true. However, there is evidence that repetitive motor tasks require less engagement than random practice [39]. Hence our use of constant target force runs could have diminished the ERD contrast over the range of MVC investigated.
In figure 10, the ERD appears to get broader and deeper, at least up to a point, before saturating or reversing course. The ability to predict target force from the ERD vector with accuracy well above chance using conventional classifiers (see figure 7 and table 1) is evidence in support of these graded changes. While the classifiers assign a relative weight to each channel, no further analysis was performed to highlight topographical variability. In future work, operations such as common spatial patterns could be utilized to improve classification [40]. Regression modeling of the effect of target force on the γ metric of ERD strength suggested a non-monotonic trend. However, the trend is not pronounced, and warrants further investigation. This may point to the need to factor in spatial distributions—which γ does not capture—when considering task differences.
Further, this study examined only the particular phase of the motor task in which grip force was controlled at a static level (figure 3). There may exist a distinct neural signature prior to this phase associated with motor planning that is predictive of the force to be exerted. In a related study, Rearick et al examined cortical dynamics of isometric force control with varying degrees of precision in visual feedback [41]. The two target force levels were 7.5% and 30% of the MVC. The authors found significant differences in the ERD of the 8–12 Hz frequency band between the two force levels during the ramp (force generation) phase but not the static phase. We did not find predictive potential in signals from the ramp phase. However, there was no explicit control for rate of force generation in our study design, which may well be the key to finding differences in graded force production. Future work will seek to combine kinematics during hand contraction to produce a continuous force predictor.
This work did not seek to model the dynamics of the EEG within a cue. Additional efforts will focus on statistical modeling of state transitions, such as with hidden Markov models, to better describe the temporal evolution of graded effort in a motor task. This would also call for modifying the protocol to randomly ordered discrete targets within a run.
Evidence of graded ERD in an isometric force production task provides the framework for a multi-class BCI modeled on a single motor task. This is advantageous for several reasons. It does not require any external stimuli, manifests during execution of an essential function of the hand and does not require training to be able to perform the task. The variable modulation of the SMR during the generation of different hand grip forces offers an intuitive means for a BCI user to generate a large number of distinct command signals. In this study, the modeling of ERD is performed entirely offline. The natural progression of this study would be to build an online BCI capable of delivering near-instantaneous, EEG-based feedback to the user. Implementation of a BCI that can accurately decode distinct signals associated with fine motor control has greater potential to harness neuroplasticity and produce better rehabilitative outcomes than passive movements alone [42].
5. Conclusion
This work demonstrates the feasibility of predicting motor effort in a simple handgrip task from the EEG and uncovers an interesting trend in which medium effort may produce a more pronounced ERD than low or high effort. The accuracy of prediction of five levels of effort was well above chance. By highlighting graded ERD signatures associated with isometric hand contraction, the number of command signals associated with this simple task could be expanded. Future work will assess the potential to predict multiple levels of force with a real-time BCI.
Acknowledgments
This material is based on work supported by National Science Foundation Grants numbered 1539068 and 1849213. All authors approved the final version of the manuscript. The authors declare that they have no conflict of interest.
Data availability statement
The data that support the findings of this study are available upon reasonable request from the authors.