
Abstract
Objective. Retinal prostheses strive to restore vison to patients that are blind from retinal degeneration by electrically stimulating surviving retinal ganglion cells (RGCs). The quality of elicited percepts remains limited however and it is desirable to develop improved stimulation strategies. Here, we examine how the anatomical and biophysical properties of RGCs influence activation thresholds, including the effects of variations found naturally. Approach. Detailed reconstructions were made of a large number of mouse α RGCs and were used to create an array of model cells; the models were used to study the effects of individual anatomical features on activation threshold to electric stimulation. Stimulation was delivered epiretinally from a point-source or disk electrode and consisted of monophasic or biphasic rectangular pulses. Main results. Modeling results show that the region of minimum threshold always is within the axon initial segment (AIS). The properties of this region as well as the absolute value of the minimum threshold are dependent on the length of the AIS as well as on the relative composition of sodium channels within the AIS. Other morphological features, including cell size, dendritic field size and the distance between the AIS and the soma had only a minimal influence on thresholds. Introducing even a small number of low-threshold Nav1.6 channels into the AIS was sufficient to lower minimum thresholds substantially although further increases in Nav1.6 had diminishing effects. The distance between the AIS and the electrode affects threshold levels while alignment of the electrode with the axon or dendritic parts of the RGC can result in lower thresholds, even if the distance to the cell remains the same. Significance. Intrinsic morphological features can influence activation thresholds with the AIS having the strongest influence. However, the combined influence remains limited and may not be large enough to allow for selective activation between different RGC types.
Export citation and abstract BibTeX RIS

Original content from this work may be used under the terms of the Creative Commons Attribution 4.0 license. Any further distribution of this work must maintain attribution to the author(s) and the title of the work, journal citation and DOI.
1. Introduction
Retinal implants aim to restore basic vision to blind patients suffering from degeneration of their photoreceptors, which in turn, prevents the conversion of light input into neuronal output (Zrenner et al 2011, Humayun et al 2012, Ayton et al 2014, Palanker et al 2020). The field of retinal prostheses has made substantial progress over the last two decades, but the quality of vision provided by these devices remains limited. One of the factors thought to limit quality is the simultaneous activation of multiple types of retinal neurons that typically are not active at the same time during normal vision. For example, ON and OFF retinal ganglion cells (RGCs) have similar thresholds and are in close proximity to one another and thus are likely to be activated concurrently; the simultaneous delivery of both ON and OFF signals to the brain is nonphysiological and likely difficult for the brain to interpret. Many additional retinal circuits rely on the generation of precise patterns of spiking and therefore, the generation of higher quality artificial vision will require stimulating strategies that can better control neuronal output.
One approach to developing improved control over neuronal activation is to learn how the intrinsic anatomical and biophysical properties of individual cells influence the sensitivity to stimulation. Understanding the factors that underlie activation can then be correlated to anatomical studies that characterize the variability of key properties across different RGC populations, i.e. so as to develop stimulation strategies for more selective targeting. The axon initial segment (AIS) within the proximal axon of RGCs and other CNS neurons has been shown to be the site of spike initiation in response to physiological inputs (Stuart et al 1997) as well as the region most sensitive to electric stimulation (Fried et al 2009, Jeng et al 2011, Werginz et al 2014). Recently, our group has shown that both the length of the AIS as well as its distance from the soma vary systematically in ON- and OFF-alpha sustained (α S) RGCs of the mouse retina (Raghuram et al 2019). For example, both AIS length and distance from the soma were correlated to the size of the soma as well as the size of the dendritic field. Further, at any given location in the retina, ON cells were slightly larger than adjacent OFF cells. AIS properties of OFF-α transient (α T) RGCs were also found to vary systematically: both AIS length and distance along the ventral to dorsal axis (Werginz et al 2019), consistent with an increase in the size of these cells along the same axis. The systematic variability in RGC properties, coupled with the importance of many of these properties in shaping the response to stimulation, raises the possibility that the sensitivity to electric stimulation may also vary across the retina. An improved understanding of how variations in anatomical properties translate into sensitivity differences would be useful for optimizing stimulation strategies, e.g. ones that preferentially activate certain RGC typesover others.
This study examines how the anatomical properties of RGCs influence thresholds in response to electric stimulation. We used immunohistochemistry and confocal imaging to capture precise anatomical details in a large number of mouse α RGCs. We then used these measurements to develop a library of realistic α RGC models. This allowed us to simulate epiretinal stimulation on these model neurons and we were able to determine the morphological elements within RGCs that have the strongest influence on sensitivity.
2. Methods
2.1. Immunohistochemistry
To recover the morphology of RGCs we used either GFP line M (Thy-1 promoter) or wild-type (C57BL/6J) mice (all purchased from Jackson Laboratory). GFP line M mice were chosen for anatomical experiments due to the sparse fluorescent labeling of individual RGC cell bodies, axons as well as their complete dendritic trees (Feng et al 2000), which enabled us to perform detailed morphological analyses. RGCs in wild-type mice were filled during whole-cell patch clamp recordings (see below). Sixty six out of 109 cells were recovered using GFP mice whereas 43 cells were recovered using filled RGC in wild-type mice. Previous results from our group (Raghuram et al 2019) have found that the morphological properties within Thy-1 GFP labeled RGCs are largely identical to those in the patch clamp filled and recovered RGCs in the wild-type retina. As a result, we were able to employ both approaches to develop a large library of reconstructed RGCs.
Retinal whole-mounts were fixed in 4% paraformaldehyde (w/v) solution for 30 min, washed in PBS, pH 7.4, for 1 h, and subsequently placed into 12-well clear multiwell plates (Corning Falcon) for processing through free-floating immunochemistry. Retinas were then blocked with 5% normal donkey serum (NDS) in 0.3% PBTX (10× PBS + Triton X) solution for 2 h, and then incubated with Alexa Fluor 488-conjugated streptavidin (1/200; Invitrogen), mouse anti-AnkyrinG (1/200; NeuroMab), rabbit anti-Nav1.6 (1/200; Millipore Sigma), and goat anti-ChAT (1/200; Millipore Sigma) in 1% NDS with 0.3% PBTX solution for five overnights. Following incubation in primaries, samples were washed in PBS for 2 h (4 × 30 minutes), and placed in Alexa Fluor 488-conjugated streptavidin (1:200; Invitrogen), Cy5-conjugated donkey anti-mouse (1:200; Jackson ImmunoResearch), Alexa Fluor 405-conjugated donkey anti-rabbit (1:200; Abcam), and Alexa Fluor 594-conjugated donkey anti-goat (1:200; Invitrogen) secondary antibodies in 0.3% PBTX solution for 1 overnight. Finally, samples were washed in PBS for 1 h (2 × 30 minutes), mounted with Prolong gold anti-fade mounting medium (Invitrogen), cover-slipped, and placed in 4 °C refrigeration until further confocal imaging.
2.2. Image acquisition and analysis
Fluorescence imaging was performed with a laser scanning confocal microscope (Zeiss LSM 880 with Airyscan) using Zeiss Efficient Navigation (ZEN Pro) software to acquire and export images. Images of the full RGC dendritic field morphology were acquired with 20× magnification at a x/y/z resolution of 0.15 × 0.15 × 0.31 μm, while images of the soma, as well as proximal axon with AIS labeling were acquired with a 63× oil immersion objective (NA = 1.4) at a x/y/z resolution of 0.09 × 0.09 × 0.31 μm. The use of a higher magnification (63×) allowed for the ability to perform precise tracing around the cell body and thin axonal processes. Anatomical measurements and image post-processing of confocal scans were performed in NIH Image J/FIJI package (Schindelin et al 2012).
During patch clamp experiments, cell type was initially confirmed by characteristic light responses to circular spots centered onto the RGC soma (see below). In all cells, final confirmation of cell type was performed using choline acetyl-transferase (ChAT), an immunochemical marker which labels the processes of ON and OFF starburst amacrine cells (Baughman and Bader 1977). These are otherwise referred to as (ON- and OFF-) ChAT bands and can be used to delineate the specific sublamina in which the terminal dendrites of tentatively identified RGCs stratify (Jeon et al 1998, Krieger et al 2017). The spatial extent of the dendritic field was quantified by drawing a polygon around the edges of the cell's terminal dendrites (figure 1(A)) and then calculating the diameter of the circle whose area matched that of the drawn polygon; a similar approach was also used to calculate the diameter of the soma. The anatomical properties of the AIS were measured by manually identifying the regions of AnkyrinG and Nav1.6 colocalization along the axon.
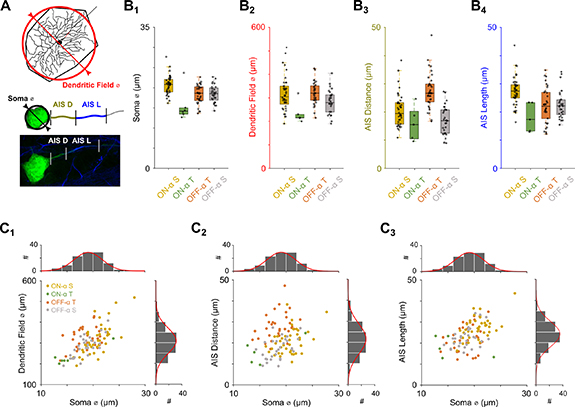
Figure 1. Comparison of anatomical properties between α RGC types—(A) Schematic of the approach used to obtain anatomical measurements from mouse RGCs (n = 109, Methods). Bottom panel shows a typical confocal scan with filled soma (green) and stained AIS (blue). (B) Comparison of soma diameter (B1), dendritic field diameter (B2), AIS distance from the soma (B3) and AIS length (B4) across the populations of ON-α S (n = 40, yellow), ON-α T (n = 6, green), OFF-α T (n = 34, orange) and OFF-α S (n = 29, gray) RGCs. (C) Scatter plots of dendritic field diameter vs. soma diameter (C1, ρ = 0.60), AIS distance vs. soma diameter (C2, ρ = 0.25) and AIS length vs. soma diameter (C3, ρ = 0.50) for all four α RGC types. Histograms on top and at right show distribution of soma diameter, dendritic field diameter, AIS distance and AIS length, respectively. Solid red lines indicate best-fit Gaussians.
Download figure:
Standard image High-resolution imageSimple 3D tracing of dendritic architecture and Sholl analysis was performed in ImageJ/FIJI toolbox 'Simple Neurite Tracer' (Longair et al 2011). Full tracing, including compartment diameters of dendritic arbors, was performed in NeuronStudio (20× magnification) (Wearne et al 2005). Tracing of the proximal axon was performed at higher magnification (63×).
2.3. Electrophysiology
The care and use of animals followed all federal and institutional guidelines and all protocols were approved by the Institutional Animal Care and Use Committee (IACUC) of the Massachusetts General Hospital. Adult (>P35) wild-type mice (C57BL/6J, Jackson Laboratory) were anaesthetized with isofluorane (Henry Schein) and subsequently euthanized by cervical dislocation. Eyeballs were harvested, retinas were dissected from the eyecup and mounted, photoreceptor side down, onto a recording chamber. The retina was subsequently perfused with oxygenated Ames medium buffered to pH 7.4 (Sigma-Aldrich) at a flow rate of 2–3 ml min−1 for the duration of the experiment. Temperature was maintained at ∼34 °C. Small holes were made in the inner limiting membrane in order to obtain access to RGC somata. Spiking responses were obtained using whole cell patch recordings. Intracellular solution consisted of (in mM, all Sigma-Aldrich): 125 K-gluconate, 10 KCl, 10 Hepes, 10 EGTA, 4 Mg-ATP, 1 Na-GTP. Morphological analysis was allowed by adding Neurobiotin (0.25 mM, Vector Laboratories) and Alexa 488 (0.5%, Invitrogen) to the intracellular solution. After break-in the pipette series resistance was compensated with the bridge balance circuit of the amplifier (<15 MΩ). Recorded membrane potential was corrected for the change in liquid junction potential (−8 mV, (Neher 1992)).
Visual stimulation used for initial cell type classification consisted of dark and bright spots on neutral (grey) background with diameters ranging from 100–1500 μm and presented for 1 s. Stimulus control and data acquisition were performed with custom software written in LabView (National Instruments) and Matlab (Mathworks). Data were recorded using an Axopatch 700B amplifier (Molecular Devices) and digitized by a data acquisition card (PCI-MIO-16E-4, National Instruments).
2.4. Computational modeling
To analyze the response of model RGCs to extracellular electric stimulation we used the approach of compartment modeling (Rall 1964, Rattay 1999). Thereby, current flow along the stimulated fiber as well as current flow across the neuronal membrane is simulated by a network of compartments with given electrical properties. We used membrane dynamics from Fohlmeister et al (2010) and slightly modified their sodium channel properties in order to better approximate the properties of Nav1.6 channels. Previous studies reported Nav1.6 activation curves which were shifted between 8 and 14 mV more hyperpolarized than those of Nav1.1/1.2 channels (Rush et al 2005, Kole et al 2008, Hu et al 2009) however, in order to avoid model malfunction, our model modifications were limited to a 6 mV shift in the activation curves. Potassium channels were modified accordingly. Ion channel densities for the six different sections along the neuron (dendrites, soma, soma to AIS, proximal AIS, distal AIS, axon) can be found in table 1. The levels of voltage-gated sodium and potassium ion channels in the AIS were 5× greater than those in the soma. Intracellular resistivity was set to 143.2 Ω cm, specific membrane capacitance 1 μF cm−2 and model temperature was set to 33 °C. The model was solved in Matlab (Mathworks) using a custom written implicit (backward) Euler solver. Time step was set to 0.005 ms. Cell morphologies of traced cells consisted of 1225–2251 compartments depending on cell size; compartment length ranged from 2.5 (axon) to 5 (dendrite) μm. Single-spike threshold was determined as the stimulus current amplitude necessary to elicit an action potential that propagates as far as the distal axon (∼950 μm from soma) within 2 ms after the pulse offset. Pulse duration was set to 0.1 ms and monophasic, cathodic pulses were applied in all experiments except otherwise noted.
Table 1. Ion channel densities along the neural membrane—Values are based on Fohlmeister et al (2010) with minor modifications. All values are given in mS cm-2.
| Dendrites | Soma | Soma-AIS | Prox AIS | Distal AIS | Axon | |
|---|---|---|---|---|---|---|
| gNav1.1 | 65 | 65 | 130 | 325 | 0 | 70 |
| gKv1.1 | 35 | 35 | 70 | 175 | 0 | 70 |
| gNav1.6 | 0 | 0 | 0 | 0 | 325 | 0 |
| gKv1.6 | 0 | 0 | 0 | 0 | 175 | 0 |
| gCa | 1.5 | 1.5 | 1.5 | 1.5 | 1.5 | 1.5 |
| gK,Ca | 0.15 | 0.15 | 0.15 | 0.15 | 0.15 | 0.2 |
| gL | 0.1 | 0.1 | 0.1 | 0.1 | 0.1 | 0.1 |
The extracellular potential distribution (Ve) generated by an ideal point source electrode in homogenous medium was modeled as  with Istim being the applied current, ρext (1000 Ω cm) being the resistivity of the retina (Werginz and Rattay 2016), and r being the Euclidean distance from the electrode to each cellular compartment. For the experiments of figure 6, the potentials generated by this equation were doubled to allow for comparison with disk electrodes (Wang et al 2018) (the equation above is for use in an infinite space but the equation for disk electrodes (below) is for a semi-infinite space).
Ve for disk electrodes was computed as  (Newman 1966, Wiley and Webster 1982), with Istim being the applied current, ρext (1000 Ω cm) being the resistivity of the retina (Werginz and Rattay 2016), a being the electrode radius, and r and z being the radial and axial distance from the electrode to each cellular compartment, respectively.
2.5. Statistical analysis
We measured linear correlation between two variables using Pearson's correlation coefficient. For comparison of means, we used a two-sample t-test. Significance levels were set as follows: n.s. p ≥ 0.05, * p < 0.05, ** p < 0.01, *** p < 0.001. Numerical values are presented as mean ±1 standard deviation (STD) except otherwise noted. Boxplots use standard notation (1st Quartile, Median, 3rd Quartile). One-way ANOVA used Tukey's honestly significant difference post hoc test. All statistical analysis was performed in Matlab (Mathworks).
3. Results
In this study, we explored the effectiveness of computational models to predict the response of RGCs to electric stimulation. This was done by capturing detailed anatomical measurements of cell morphology to generate a library of accurate RGC models. These models were used to study the influence of a variety of anatomical components on the threshold for activation in response to extracellular stimulation.
3.1. Detailed anatomy of mouse α RGCs
In order to generate biophysically-accurate models of RGCs we performed detailed anatomical measurements within 109 mouse α RGCs (ON-α S: n = 40; ON-α T: n = 6; OFF-α T: n = 34; OFF-α S: n = 29). α RGCs are a well characterized population of cells which has been studied widespread (Pang et al 2003, Margolis and Detwiler 2007, Bleckert et al 2014, Krieger et al 2017, Raghuram et al 2019). Furthermore, prior studies of mouse RGCs (Raghuram et al 2019, Werginz et al 2019) have found a great deal of morphological variability within and across the α sustained and transient populations; this provides the ability to test the influence of a number of different anatomical parameters on modulating electrical stimulation threshold.
Our anatomical measurements focused on cell size (soma diameter and dendritic field diameter) as well as AIS properties (AIS distance from the soma as well as AIS length, figure 1(A)) as these have been previously shown to regulate intracellular activation threshold (Raghuram et al 2019) as well as to influence threshold in response to extracellular stimulation (Fried et al 2009, Jeng et al 2011). We started by plotting cell size and AIS properties across different RGC types (figure 1(B)) in order to get a sense of the scope of variability within and across types. Soma diameters were mostly in the range of 15–25 μm across the population of cells measured. ON-α S RGCs had the largest soma diameter amongst the four α RGC types while ON-α T RGCs had the smallest (figure 1(B1)). ON-α T RGCs also had the smallest dendritic fields (figure 1(B2)). There was a strong correlation between soma size and dendritic field diameter across the combined populations (figure 1(C1)). In terms of AIS properties, the distance from the soma to the start of the AIS (hereafter referred to as 'AIS distance') was largest in OFF-α T RGCs (figure 1(B3)) and largely similar in the other three cell types. The length of the AIS (hereafter referred to as 'AIS length') was longest in ON-α S RGCs (figure 1(B4)). Plots of soma diameter vs. dendritic field diameter, AIS distance and AIS length are shown in figures 1(C1)–(C3), respectively. All three parameters scaled linearly with soma diameter although the correlation coefficient for AIS distance was smaller than that of the other two parameters (ρ = 0.25 vs. ρ = 0.60 and 0.50). The low correlation coefficient for AIS distance was mainly due to measurements from the OFF-α T population (figure 1(C2)); when the other three RGC types were considered alone, ρ increased to 0.51. Thus, AIS distances are longer in OFF-α T RGCs and less correlated to cell size. Comparisons between RGC types for all extracted parameters are shown in figure S1 (available online at http://stacks.iop.org/JNE/17/045015/mmedia). To gain additional insight into the relationship between individual parameters we also computed correlation coefficients and significance levels between ON-α S, OFF-α T and OFF-α S cells (figures S2–S5). Due to the small number of recovered cells (n = 6), we did not compute correlations for ON-α T RGCs.
3.2. The AIS is the site of lowest threshold in α RGCs
In order to study the response of RGCs to electric stimulation we used the measurements from figure 1 to construct an array of anatomically-accurate models of mouse α RGCs. Each model cell had an anatomically realistic soma, dendrites, axon hillock (region between the soma and the AIS), proximal AIS, distal AIS and axon (table 1). Channel kinetics and densities in each section were based on a previously published model (Fohlmeister et al 2010); the proportion of the proximal axon for which channel density was increased was based on the anatomical measurements of figure 1. The quality of staining was sufficient to reconstruct the dendritic trees in 40 out of the 109 RGCs processed as part of this study. Analysis of the measurements allowed us to also determine the total dendritic length, the mean segment length, the maximum Euclidean distance from the soma and the maximum stratification level in each of these cells. The results of these measurements along with a comparison across types is detailed in figures S1−S5.
The quality of immunochemical staining and confocal imaging was sufficient in a subset of traced cells (n = 19) to allow dendritic segments (length as well as diameter) to be accurately reconstructed; we refer to this subset as 'fully traced'. In the remaining cells (n = 21), dendritic lengths were captured but the diameters of individual compartments could not be accurately ascertained and thus were set to 1 μm (the approximate average diameter of the processes that we were able to measure). There were no significant differences in thresholds between fully traced cells and cells with constant diameters (figure S6) and so the two groups were pooled together in subsequent analyses. In summary, 40 model neurons (ON-α S: n = 12; ON-α T: n = 3; OFF-α T: n = 19; OFF-α S: n = 6) were constructed and used to study the response of RGCs to extracellular electric stimulation.
Our first goal with the RGC models was to map the sensitivity (i.e. activation threshold) of individual neurons as a function of the position of the stimulating electrode. The electrode was systematically shifted across an x−y grid (5 μm spacing) while the height was fixed 30 μm above the soma (figure 2(A)). Consistent with previous studies (Fried et al 2009, Jeng et al 2011), the region of peak sensitivity was found to be directly over the AIS in all model cells (figure 2(A), inset). Although there were slight differences in the value of the minimum threshold between the four α RGC types (figure 2(C)), the differences were not statistically significant. Thresholds gradually decreased as the electrode was moved from the soma towards the AIS but then increased as the electrode was shifted beyond the AIS towards the distal axon (figure 2(B)). Thresholds eventually stabilized at for locations >150 μm from the soma as long as the electrode remained above the axon although there was a small overshoot of threshold, i.e. a local maximum, at distances of 100–150 μm from the soma (figure 2(B)). Thresholds were highest in regions distant from both the AIS and the distal axon, e.g. over distal dendrites on the top, bottom and left sides of figure 2(A). Note that thresholds in the far distal axon were identical in all model cells since they all had the same biophysical and morphological features (only the initial 70–120 μm of the axon were traced from confocal scans). The incidental activation of passing axons, e.g. those from RGCs with their somata located distant to the targeted cell, is likely to occur especially when stimulation parameters that effectively activate RGCs directly are used (e.g. short duration pulses). Incidental activation of passing axons will expand the region responding to stimulation and thus distort the spatial extent of the intended percept (Beyeler et al 2019). To determine if the anatomical variations that exist across RGCs might influence the relative sensitivity of axonal activation, we explored the relative selectivity between AIS and axonal activation across all cells. The ratio of axonal threshold to the minimum threshold found over the AIS ranged from 2.4 to 4.9 with an average of 3.4. This is consistent with previous studies that suggest that RGCs can be selectively targeted without the co-activation of passing axons (Fried et al 2009, Jeng et al 2011) but the relatively small ratios suggest it will be difficult to avoid axons unless electrodes are precisely positioned. There was no difference in the ratios across the four α RGC types (not shown).

Figure 2. Spiking threshold of α RGCs in response to extracellular electric stimulation—(A) 2D threshold map for a typical OFF-α T RGC. The stimulating electrode was shifted in increments of 5 μm (x−y) at a constant z-distance of 30 μm from the soma. Thresholds were further interpolated to a 1 × 1 μm grid. The AIS is indicated in white. The inset at the right shows an expanded view of the soma and AIS region. (B) Threshold is calculated as a function of electrode position along the initial 200 μm of the axon; averages for ON-α S (yellow), ON-α T (green), OFF-α T (orange) and OFF-α S (gray) RGCs. Electrode location (red filled circle) and approximate AIS location (blue) are shown in schematic on top. Error bars indicate 1 STD. (C) Minimum thresholds across the population of ON-α S (yellow), ON-α T (green), OFF-α T (orange) and OFF-α S (gray) RGCs (One-way ANOVA: F(3,36) = 2.86, p ≥ 0.05). (D) The location at which threshold is minimum is plotted vs. the distance between the distal edge of the AIS and the soma for ON-α S (yellow), ON-α T (green), OFF-α T (orange) and OFF-α S (gray) RGCs. The black line indicates the best-fit linear regression (p < 0.001). (E) The location within the AIS at which minimum threshold occurs is plotted vs. AIS length. Data pooled for all α RGC types. Horizontal and vertical error bars indicate 1 STD.
Download figure:
Standard image High-resolution imageA closer study of the maps revealed that even though the pattern of thresholds along the proximal axon (i.e. threshold decrease from soma to AIS, increase from AIS to distal axon, overshoot, stabilization) were consistent across all four types, the location at which threshold was lowest was slightly closer to the soma in ON-α T RGCs than in the other three types (figure 2(B)). Further analysis revealed that the location at which threshold was lowest was strongly correlated to the distal edge of the AIS (figure 2(D)). For example, in cells that had relatively short AISs, i.e. positioned closer to the soma, the point of lowest threshold was located closer to the soma while in cells with longer and more distal AISs, the point of lowest threshold occurred at more distal locations. Thus, the difference in the location of minimum threshold between ON-α T and the three other types of α RGCs arises from the shorter and more proximal AIS in ON-α T RGCs (see figure 1). We also analyzed the position within the AIS at which minimum threshold occurred and found that it too was a function of AIS length (figure 2(E)). For example, in cells with short AISs (10–15 μm), the point of lowest threshold was within the distal 20% of the AIS whereas in cells with longer AISs (30–35 μm) the point of lowest threshold typically occurred closer to the midpoint of the AIS.
Taken together, our results indicate that both the distance between the AIS and the soma as well as the length of the AIS influence the location at which threshold is lowest in response to electric stimulation. Although the site of lowest threshold is always within the AIS, increases to AIS length shift the site of lowest threshold from distal to more central portions of the AIS. These findings extend previous work from our group (Jeng et al 2011, Werginz et al 2014) by identifying the specific location within the AIS that is the most sensitive to electric stimulation and further, showing how it changes with AIS size and location.
3.3. Do properties other than AIS length influence threshold?
We questioned whether morphological features in addition to AIS length also influenced the response to electric stimulation and reasoned that properties that influence intracellular thresholds, e.g. AIS distance, soma diameter and dendritic field size (Raghuram et al 2019) might similarly influence extracellular thresholds. Each property was systematically varied to evaluate its influence on threshold. We started by examining the effect of dendritic field diameter while holding all other parameters constant and determined threshold for each value of diameter (figure 3(A)). There was no correlation between the two parameters, suggesting that dendritic field diameter has little or no influence on threshold. In subsequent experiments, we evaluated threshold as a function of soma diameter (figure 3(B)) and location of the AIS (figure 3(C)) and found little or no influence from either parameter. In contrast to all other parameters, the length of the AIS had a strong influence on threshold (figure 3(D)).

Figure 3. Influence of anatomical properties on threshold—(A) Minimum threshold is plotted vs. dendritic field diameter (p ≥ 0.05); soma diameter, AIS distance and AIS length were fixed to 20 μm. (B) Minimum threshold is plotted vs. soma diameter (p ≥ 0.05); AIS length and AIS distance from soma were fixed to 20 μm. (C) Minimum threshold is plotted vs. AIS distance (p ≥ 0.05); AIS length was fixed at 20 μm. (D) Minimum threshold is plotted vs. AIS length (p < 0.001). (E) Minimum threshold is plotted vs. soma diameter (with AIS length varying as well) (p < 0.01). (F) Soma threshold is plotted vs. soma diameter (p < 0.05). Solid black lines indicate the best-fit linear regressions. Arrows in (E) and (F) indicate an outlier.
Download figure:
Standard image High-resolution imageThe lack of correlation between soma size and threshold differs from a previous study (Cho et al 2016) which reported a slightly negative correlation between the two in wild-type RGCs (but not in degenerate RGCs). The earlier study targeted cells with large somata, suggesting both studies worked with α RGCs, although cell types were not unequivocally identified in the Cho study. However, the Cho study applied stimulation via a 75 μm disk electrode while we used a point source electrode. Further, the electrode in the earlier study was fixed at a location 50 μm from the target cell and threshold reported from that location only while here the electrode was systematically positioned across many different locations and threshold reported as the lowest value from all measurements (i.e. figure 2(A)). Given that the soma is not the location where thresholds are lowest (e.g. figure 2(A)), it is not entirely surprising that the 'thresholds' reported in the two studies have different sensitivities. To better understand the effect of the fixed location, we compared thresholds derived from systematic mapping (referred to as 'minimum threshold') to the threshold when the electrode is located directly above the soma (referred to as 'soma threshold'). Interestingly, the value of minimum threshold was reduced as the soma diameter was increased (figure 3(E)), while in contrast, soma threshold increased with increasing soma size (figure 3(F)). Almost certainly, the differences arise because of the correlation between soma diameter and AIS length (figure 1), i.e. cells with larger somata also tend to have longer AISs (figure 3(D)) that result in the lower thresholds that underlie the negative trend in figure 3(E). In contrast however, the capacitive effects of a larger somatic surface led to increased thresholds when the electrode remained fixed directly above the soma; the longer AISs in these cells were not sufficient to compensate for this increase which resulted in the observed positive trend.
Because the influence of soma diameter depended on the location of the stimulating electrode, we questioned whether the influence of AIS length on minimum threshold was also different for different locations of the stimulating electrode, i.e. when it was not positioned directly over the AIS. To explore this, we computed thresholds for 350 locations of the stimulating electrode, each location distributed randomly around the cell but within 100 μm of the center of the AIS for that cell (figure 4(A)). Consistent with the results of figure 3(D), thresholds were strongly correlated to AIS length for stimulating electrode locations close to the AIS, i.e. confined within 10 μm (figure 4(B)). The correlation between AIS length and threshold persisted when the region of interest was expanded to 50 or to 100 μm although the spread of threshold levels along with the STDs of the measurements increased for the larger regions. We compared the sensitivity of threshold to AIS length for these different zones and found that for small distances (≤10 μm), threshold decreased with a rate of 0.02 μA μm−1 AIS length while for the largest distances (0–100 μm), the rate of increase was actually higher at 0.14 μA μm−1 AIS length (figure 4(B), bottom right). Thus, our results suggest that AIS length has a stronger influence on threshold at larger distances from the AIS, at least up to distances of 100 μm away. Further, cells with larger AISs, e.g. ON-α S cells are less sensitive to distance between the stimulating electrode and the AIS than cells with small AISs, e.g. ON-α Ts (compare the left and right edges of the three lines in figure 4(B), bottom right).
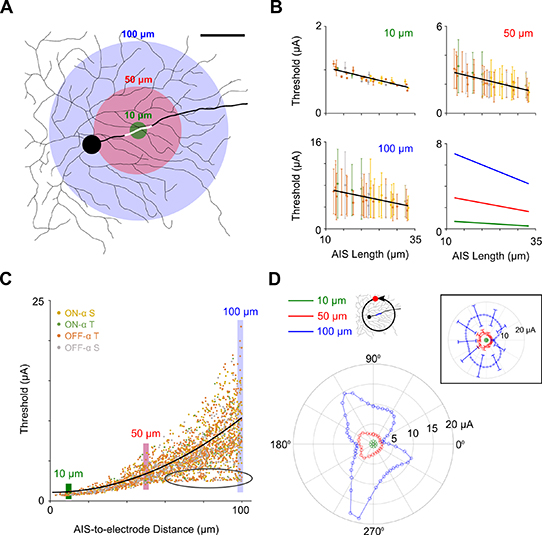
Figure 4. Spatial threshold profiles in α RGCs are asymmetric—(A) The stimulating electrode was positioned randomly (350 locations for each cell) within 100 μm of the center of each cell's AIS (white). Three regions of interest (green: 0–10 μm, red: 0–50 μm and blue: 0–100 μm) are indicated by circular colored shadings centered over the AIS. Scale bar: 50 μm. (B) Average threshold vs. AIS length for the three regions of interest in (A) for ON-α S (yellow), ON-α T (green), OFF-α T (orange) and OFF-α S (gray) RGCs. Error bars indicate 1 STD, the black lines indicate best-fit linear regressions (r = −0.88, −0.84 and − 0.73, respectively; p < 0.001 in all three cases). The bottom right panel shows the three linear regressions on the same scale. (C) Scatter plot of threshold vs. AIS-to-electrode distance; to enhance visibility, every 5th data point is plotted (n = 2800). The black line indicates the best-fit quadratic. Colored vertical stripes correspond to distances of 10, 50 and 100 μm. The black oval indicates electrode locations close to the distal axon (see text). (D) Polar plot of threshold for the cell in (A) when the electrode is moved along a circle with a radius of 10 (green), 50 (red) or 100 μm (blue) from the AIS center. Polar plot on top right shows population result for all 40 model neurons at the same distances (same color scheme). Axons were aligned to the right (0°) in all cells. Error bars indicate 1 STD.
Download figure:
Standard image High-resolution imagePrevious electrophysiology studies have reported a quadratic relationship between electrode-to-cell distance and threshold (Jensen et al 2003, Sekirnjak et al 2008). This is consistent with biophysical theory which predicts that the potentials generated by a point source electrode decay with the square of the distance between the stimulating electrode and the measuring site (Methods). We confirmed a similar relationship here by plotting threshold vs. AIS-to-electrode distance. However, we also found large variability in thresholds, even for cases where the electrode was the same distance from the AIS (figure 4(C)). To illustrate the underlying variability, we plotted threshold for electrode locations at a fixed distance to the center of the AIS but displayed in polar coordinates (figure 4(D)). Thresholds were computed for 50 evenly-spaced locations (7.2°/step) around the AIS for radial distances of 10, 50 and 100 μm (same cell as shown in figure 4(A)). Radial distances of 10 and 50 μm led to approximately circular threshold profiles with only slight distortions (reduced thresholds) when the stimulating electrode was closer to the axon. The profile became even more irregular when the distance was increased to 100 μm (figure 4(D), blue). Thresholds were highest for electrode locations i) far away from both the AIS and the axon; and ii) when dendritic density was low, i.e. few dendritic processes were below the stimulating electrode (not shown). Repeating the experiment for all 40 model neurons confirmed the results from single cell analysis (figure 4(D), inset).
3.4. Relative sodium channel composition of the AIS affects minimum threshold
The AIS is composed of multiple subtypes of sodium channels. For example, Nav1.6 channels typically comprise the distal end of the AIS and activate at lower thresholds than either the Nav1.1 or Nav1.2 subtypes typically found at the proximal end (Rush et al 2005, Hu et al 2009). The combination of lower threshold and distal location makes the Nav1.6 portion of the AIS the site at which spikes are initiated (reviewed in (Bender and Trussell 2012)). In α sustained RGCs of the mouse, the AIS is generally dominated by Nav1.6 channels with averages of 88% in α S RGCs and 81% in α Ts (figure 5(A), (Raghuram et al 2019)), although the ranges can be rather broad, e.g. ∼50% in some OFF-α T RGCs and ∼90% in α S RGCs (figure 5(A)). Nav1.6 channels are also thought to comprise the majority of the AIS of rat RGCs as well (Van Wart et al 2007) although the level of 66% reported in unspecified RGC types was significantly lower than that found in mouse cells. Given the difference in kinetics between the two types of sodium channels, along with the variability with which they are found within the AIS, we questioned here whether AIS composition also influences activation thresholds during electric stimulation. In order to incorporate the different kinetics of the two sodium channel subtypes into the model, we modified the standard (Nav1.1) sodium channel dynamics in a way so that activation was initiated at more hyperpolarized levels (6 mV) vs. that of Nav1.6 channels (Methods).

Figure 5. The proportion of Nav1.6 channels influences threshold—(A) Comparison of the portion of the AIS occupied by Nav1.6 channels for ON-α S (yellow), OFF-α T (orange) and OFF-α S (gray) RGCs (One-way ANOVA: F(2,36) = 7.08, p < 0.01). Nav1.6 measurements were not obtained in ON-α T RGCs. (B) Threshold for a typical model cell was calculated as the electrode was shifted along the initial 150 μm of the axon while Nav1.6 ratio was varied (0%, 20%, 60% and 100% of the overall AIS length). (C) Mean thresholds for electrode placement at the location which resulted in minimum threshold for ON-α S (yellow), ON-α T (green), OFF-α T (orange) and OFF-α S (gray) RGCs when Nav1.6 ratio was increased from 0%–100% of the AIS. Error bars indicate 1 STD.
Download figure:
Standard image High-resolution image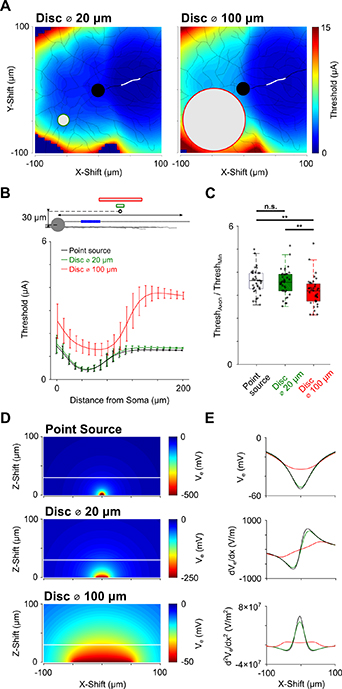
Figure 6. Electrode size affects selective targeting of RGCs vs. passing axons—(A) 2D threshold maps for stimulation with disk electrodes with diameters of 20 μm (left, green circle) and a 100 μm (right, red circle). The stimulating electrode was stepped in increments of 5 μm (x−y) at a constant z-distance of 30 μm above the plane of the soma. Thresholds were further interpolated to a 1 × 1 μm grid. The AIS is highlighted in white. (B) Threshold is calculated as a function of electrode position along the initial 200 μm of the axon for three different electrodes: a point source (black), a 20 μm disk electrode (green) or a 100 μm disk electrode (red). Averages across the whole population of α RGCs (n = 39). Electrode size and location and approximate AIS location (blue) are shown in schematic on top. Error bars indicate 1 STD. (C) Comparison of the ratio between axonal and minimum threshold reveals significant differences between the three different electrodes (One-way ANOVA: F(2115) = 7.06, p < 0.01). (D) The distribution of extracellular potentials (Ve) generated by the point source (top), 20 μm disk (middle) and 100 μm disk electrodes (bottom). The white horizontal lines indicate the 30 μm distance to the electrode surface (constant for all electrodes). (E) Extracellular potential (top), first derivative of potential (middle) and second derivative of potential (bottom) for the three electrodes along the white lines shown in (D); color codes are the same as in (B) and (C).
Download figure:
Standard image High-resolution image
We calculated threshold in a typical model cell while varying the proportion of Nav1.6 within the AIS from 0% to 100% (figure 5(B)). Threshold at the soma as well as the minimum overall threshold decreased as the proportion of Nav1.6 was increased although the rate of decrease was much greater for the initial insertion of Nav1.6 channels into the AIS than for subsequent increases. For example, increasing the percentage of Nav1.6 channels in the AIS from 0% to 20%, decreased threshold by approximately 43% (0.45 μA) while a similar change in threshold of ∼45% (0.32 μA) was found when the proportion of Nav1.6 was increased from 20 all the way up to 100%. This suggests that only a small amount of densely packed Nav1.6 channels is sufficient to substantially lower minimum threshold and thus the anatomical variations that exist across mouse RGCs measured to date are unlikely to have a strong influence on thresholds. Thresholds in the distal axon (150 μm from the soma) were unaffected by the proportion of Nav1.6 in the AIS (figure 5(B)). We computed minimum threshold for varying proportions of Nav1.6 in all 40 model neurons (figure 5(C)) and observed similar results to that from the single cell. Average minimum threshold dropped to about 50% (1.46 vs. 0.72 μA) of its baseline value (0% Nav1.6) when the AIS was 100% comprised of Nav1.6 channels (figure 5(C)).
3.5. Electrode size affects threshold profiles
Previous studies have shown that variations in the properties of the stimulating electrode and/or the stimulus waveform can influence responses of RGCs to electric stimulation (Jensen et al 2003, 2005, Schiefer and Grill 2006, Chang et al 2019). In the final set of experiments, we therefore probed the effect when the point source electrode was replaced by disk electrodes and the monophasic stimulus pulses were replaced by other waveforms. The fields arising from disk electrodes have been described previously (Newman 1966, Wiley and Webster 1982) (Methods). Note however that the equations used previously are within a semi-infinite volume, i.e. the region in back of the electrode was electrically shielded (Newman 1966). Such a configuration approximates the situation in epiretinal implants as electrodes are placed on a carrier which acts as an electrical insulator. Because the equations used here (and previously) for the point source electrode were developed in an infinite space, it was necessary to increase the induced voltages by a factor of two (to convert to the same semi-infinite volume used for disks) when comparing responses (Wang et al 2018). Using this approach, results from the point source electrode were highly similar to those elicited by a very small (1 μm diameter) disk electrode (not shown).
We repeated the threshold map experiments of figure 2 using electric fields arising from disk electrodes of 20 and 100 μm (diameters) (figure 6). The maps from the 20 μm disk electrode was qualitatively and quantitatively similar to those from the point source electrode, i.e. a region of high sensitivity occurred when the electrode was positioned close to the AIS (figure 6(A)). The similarity to the point source responses is not surprising given the distance to targeted neurons was larger than the size of the disk (see below); different distances would result in differences between the two maps. The maps with the 100 μm disk were qualitatively and quantitatively different (figure 6(B)). For example, the rate at which threshold increased when the electrode was moved from the AIS towards the soma was not as sharp for the large disk electrode (100 μm) as it was for the two smaller electrodes. Also, the point of minimum threshold was shifted out towards the distal axon for the larger electrode.
We again compared the ratio between thresholds obtained over the distal axon to the minimum thresholds found in the map to see if changes to electrode size influenced the likelihood with which passing axons could be avoided (figure 6(C)). The ratio was significantly lower for the large disk electrode (average of ∼3.4 for both the point source and 20 μm disk electrodes vs ∼3.0 for the 100 μm disk electrode), suggesting that smaller sizes may help to avoid the activation of passing axons. The strong similarity of the threshold profiles between point source and 20 μm disk electrodes led us to examine the distribution of the electric field in more detail (figures 6(D) and (E)). The extracellular potential as well as its first and second derivatives were highly similar for the point source and 20 μm (figure 6(E)). The second derivative of the extracellular potential (bottom panel) is referred to as the activating function (Rattay 1999) and is thought to be the driving force for activation; the similarity in activating functions for the two small electrodes explains the similarity in thresholds while the broader profile for the 100 μm electrode underlie its higher thresholds (figure 6(E), bottom red).
We also compared the responses between the standard monophasic cathodic pulse used earlier to charge balanced biphasic pulses (cathodal-anodal and anodal-cathodal), i.e. waveforms that are more typical of those used clinically (figure S7). As expected, threshold levels varied between the different waveform configurations however, the axonal threshold to minimum threshold ratios remained fairly constant across the three groups.
4. Discussion
The healthy retina transforms light signals from the visual world into carefully orchestrated patterns of spiking output that vary in space and time as well as across the different types of RGCs. While some elements of these natural patterns can be replicated by electric stimulation, e.g. trains of short duration pulses can precisely replicate the temporal properties of light-elicited spike trains (Fried et al 2006, Jepson et al 2014a), it has proven challenging to replicate other elements, e.g. the spatial resolution of the response to short duration pulse trains can be quite extensive. This occurs, in part, because the high density of RGCs, especially within the fovea in humans, hampers activation of individual RGCs without simultaneous co-activation of neighboring cells. Individual RGC types are thought to have characteristic responses to certain forms of electric stimulation (Twyford and Fried 2016, Werginz et al 2018), and so methods to identify cell type and then selectively activate individual cells with an appropriate spiking signal have been proposed (Jepson et al 2013), but these require high levels of computational power and signaling bandwidth, and so far, are limited to only portions of the retina where RGCs form a monolayer (i.e. outside of the fovea). Methods to better re-create physiological signaling with retinal implants, especially in more central portions of the retina, remain a significant obstacle towards improving the quality of artificial vision. Here, we studied how individual anatomical properties in mouse α RGCs each influence the response to electric stimulation. We found that the length of the AIS has the strongest influence on threshold. We also found that the relative positioning between the stimulating electrode and the target cell has a strong influence, but can vary substantially depending on the exact location of the electrode. Many other anatomical properties of RGCs, including soma size, dendritic field size and even the distance between the AIS and the soma had only a small influence. Importantly, the threshold differences imparted from differences in AIS properties limited to those observed anatomically, may not be large enough to achieve selective activation across multiple types of RGCs.
4.1. Anatomical variations across mouse α RGCs
The RGC model cells that were used in this study were developed by precisely replicating the morphological features of ganglion cells; four different types of mouse α RGCs were studied (figure 1). Similar to previous reports (Krieger et al 2017), we found the soma diameters of ON-α S RGCs were largest of the four α cell types while ON-α T RGCs had both the smallest somata and the smallest dendritic fields. We observed a positive correlation between soma size and dendritic field diameters across all four RGC types, consistent with a previous report that was limited to α S cells (Raghuram et al 2019). AIS length was also correlated to soma size in all cell types while the correlation of AIS distance to soma size was weaker, but still significant, across the combined population. The distance between the soma and the proximal edge of the AIS was largest in OFF-α T RGCs. This latter finding is consistent with an earlier modeling study outside the retina (Gulledge and Bravo 2016) that suggested that optimal AIS distance is dependent on the size of the somatodendritc compartment. Analysis of these anatomical features within and across cell types enabled the generation of a larger number of morphologically-realistic cell type specific RGC models that provided a realistic distribution of cell sizes and AIS properties, thus improving the accuracy of the subsequent modeling investigations.
4.2. AIS length and composition underlie minimum thresholds
Previous studies have reported systematic variations of RGC anatomy with retinal eccentricity (Watanabe and Rodieck 1989, Dacey and Petersen 1992, Bleckert et al 2014, Warwick et al 2018). For example, cells in the central retina of human and primate are smallest while RGCs in the periphery are larger (Watanabe and Rodieck 1989, Dacey and Petersen 1992). Analogous results have been reported in mouse retina (which lacks an area of high acuity vision) with size gradients along the nasal-temporal axis for α S RGCs (Bleckert et al 2014, Raghuram et al 2019) and for OFF-α T RGCs along the ventral-dorsal axis (Warwick et al 2018, Werginz et al 2019). Our results here (figure 1) extend earlier results from our group (Raghuram et al 2019, Werginz et al 2019) to show that the length of the AIS also varies systematically along these axes, i.e. it is correlated to cell size in all cell types. Thus, combined with the finding that AIS length has the strongest influence on activation threshold (figures 2, 3 and 5), the correlation between cell size and AIS length suggests larger cells will have lower thresholds, i.e. cells at some locations in the retina will have lower thresholds than cells of the same type at other locations. In addition, because ON-α RGCs are larger than OFF-α RGCs (Raghuram et al 2019) at any given location along the nasal-temporal axis, it is likely that ON-α RGCs have lower thresholds than neighboring OFF-α RGCs. Interestingly, ON midget cells have also been shown to be larger at any given eccentricity in primate as well as human retina (than OFF midget cells) (Dacey and Petersen 1992, Chichilnisky and Kalmar 2002), raising the possibility that these cells will also have longer AISs and therefore lower thresholds than neighboring OFF cells. If so, ON cells could be selectively targeted by carefully designed clinical devices, e.g. ones in which stimulating electrodes are positioned close to the AIS of targeted neurons (Jepson et al 2014b). While this level of selectivity may be useful, it does not preclude the possibility of simultaneous co-activation of additional RGC types. It will be interesting in future in-vitro and in-vivo studies to explore whether the anatomical differences observed here can indeed be translated into selective activation of these individual types.
The relative amount of Nav1.6 channels within the AIS was also shown to influence activation thresholds (figure 5). The insertion of even a small number of Nav1.6 channels into the AIS of modeled neurons lowered threshold significantly over AISs that were comprised of only Nav1.1 channels; increases to the percentage of Nav1.6 channels within a given AIS reduced threshold but the rate of decrease was lessened as Nav1.6 composition increased. For the range of Nav1.6 percentages that were found anatomically (∼50%–90%), we found an average reduction in threshold of ∼18% (figure 5), i.e. cells with an AIS composed of 90% Nav1.6 channels had a threshold that was 18% lower than cells with a 50% composition. For the large majority of cells however, the composition of the AIS ranged within 80%–90%. Across this range, threshold varied by less than 5%, suggesting that variability in AIS composition is unlikely to allow for any meaningful selective targeting of specific RGCs.
The implementation of Nav1.6 voltage-gated sodium channels into the model necessitated slight variations in channel properties to that reported in the literature (Fohlmeister et al 2010). Specifically, the opening of Nav1.6 sodium channels is thought to start at more hyperpolarized membrane potentials than that of Nav1.1/1.2 channels; the difference is in the range of 8–14 mV (Rush et al 2005, Kole et al 2008, Hu et al 2009). To replicate this in the model, it was necessary to shift the activation curve in the RGC membrane model (Fohlmeister et al 2010) to more hyperpolarized levels. However, the models used in these types of studies are precisely balanced, so that even small changes can have unanticipated effects on model output. As a result, we were only able to shift the offset in Nav1.6 channels by 6 mV before the overall model kinetics began to fall out of balance. It is likely that a shift closer to the actual measured values would have resulted in even lower thresholds for a given percentage of Nav1.6 channels in the AIS and thus the influence of Nav1.6 proportion on threshold levels found here is likely to be smaller than the actual influence. Nevertheless, the range of Nav1.6 variability found here is small enough that even a doubling of the effect would not lead to significantly enhanced changes in sensitivity.
The AISs of CNS neurons can be altered during the progression of certain diseases (reviewed in (Grubb and Burrone 2010)). For example, in animal models of Alzheimer's disease, the accumulation of Amyloid-β (Aβ) plaques near the AIS leads to shortening of the AIS (Marin et al 2016) while the distance between the AIS and the soma was reduced in animal models of epilepsy (Harty et al 2013). Studies investigating AIS properties in the degenerate retina have reported conflicting. Damiani et al (2012) found no differences in AIS length but a slight reduction of AIS distance between wild-type and 1 yr old rd1 mice (an animal model of retinal degeneration). In contrast, Walston et al (2013) found a significant difference in AIS length but no change in AIS distance when heterozygous S334ter-line-3 rats (a well-used rat model of retinal degeneration) and Long Evans rats (wild-type) were compared. Our results do not help to reconcile these differences, but we note that the accelerated degeneration in rd1 mice begins before development is complete; therefore, because AIS properties change over the course of development, it is possible that the lack of AIS differences in the Damiani study reflect multiple competing effects. More recently, work by Schluter et al (2019), found that visual deprivation led to a significant increase in the AIS length of wild-type mouse RGCs. It will be important to better understand the sensitivity of AIS length in RGCs to different disease states since such changes can influence activation thresholds.
Similar to anatomical studies, previous in-vitro studies that measured RGC thresholds in healthy vs. degenerate retina show conflicting results, e.g. some reported higher thresholds in degenerate retina (Chan et al 2011, Cho et al 2016) whereas others did not find significant differences (Sekirnjak et al 2009, Cho et al 2016). Cho et al (2016) analyzed thresholds in degenerate retina and classified cells into different categories based on physiological parameters such as spontaneous activity and resting membrane potential. They reported that one group of RGCs in the degenerate retina had comparable thresholds to healthy cells while others had significantly elevated thresholds. It is possible that such differences reflect cell type specifically and it will be interesting to learn whether different physiological cell types (i.e. ON, OFF, transient, sustained) have different sensitivities to degeneration.
Our results indicate that small disk electrodes with diameters in the range of 20 μm can improve the selectivity of focal (AIS-induced) responses (figure 6) although the size effect depends on the proximity of the stimulating electrode(s) to the retina. The co-activation of passing axons is one of the factors thought to limit the quality of vision in blind subjects; by increasing the difference in thresholds for stimulation close to the soma vs. stimulation over the distal axon, smaller electrodes may help to improve the quality of elicited percepts.
4.3. Electrode positioning affects thresholds
While it would be desirable to stimulate each individual RGC with a separate electrode, several biological and technical constraints limit this possibility. For example, the architecture of the retina, with multiple layers of RGCs in the fovea region, makes it extremely difficult to design a device in which each RGC can be targeted by a separate electrode. In addition, the size, density and charge injection limit of individual electrodes places further constraints on the array design. Given these limitations, we focused on RGC activation within specific regions of interest (circles ranging in diameter from 10 to 100 μm) (figure 4). Our analysis showed that even at the upper end of these distances, cells with long AISs had lower thresholds than cells with short AISs. We also observed additional threshold variations which were not related to AIS-to-electrode distance but instead were linked to the distinct anatomical properties of each RGC, especially the trajectory of the axon and its proximity to the stimulating electrode. Consistent with earlier work (Fried et al 2009, Jeng et al 2011), low thresholds occurred when the stimulating electrode was close to the axon, even if the AIS was much further away (figure 4). The highest thresholds occurred when the electrode was positioned in regions distant to the axon and sparsely occupied by the dendritic tree.
Our results here suggest that minimum threshold, i.e. threshold when the electrode is located above the most sensitive part of the AIS, is negatively correlated to soma size (figure 3(F)). This is in line with findings from Cho et al (2016) who found a similar relationship in an in-vitro study. While the Cho study used a 75 μm disk electrode positioned approximately 50 μm distant from the soma, our study used a point source electrode which was systematically positioned at multiple locations around the target neuron. Interestingly, our results show that thresholds are positively correlated to soma size when the electrode is directly above the soma (figure 3(G)). Thus, it is necessary to carefully specify the recording configuration and cell-to-electrode positioning when comparing thresholds between cells and across studies.
Acknowledgments
We would like to thank James Weiland (U. Michigan) and Boshuo Wang (Duke) for helpful discussions about field potentials from different types of electrodes, Frank Rattay (Vienna Univ. of Technology) for helpful discussions during preparation of the manuscript and Molly McGoldrick (Boston College) for assistance with the immunohistochemistry experiments. Research was supported by the Boston VA Healthcare System, by the National Institute for Neurological Disease and Stroke (U01-NS099700 and R01-NS110575) and by the Austrian Science Fund (FWF J3947).