

Abstract
Objective. We used EEG to investigate cortical oscillatory activities during the tactile discrimination task and characterize the correlation between the EEG features and subjects' discrimination performance. Approach. Transcutaneous electrical nerve stimulation (TENS) was applied on two finger areas (thumb and index for healthy hands, thumb and index-projected areas for disabled hands) to evoke two kinds of tactile sensations (vibration and pressure) with three levels of intensities (low, medium and high). Four forearm amputees and thirteen able-bodied subjects were recruited to discriminate the specific intensity and area of the applied stimulation. We assessed the discrimination performance [discrimination accuracy rate (AR) and response time (RT)] to quantify the tactile acuity. During the stimulation, EEG signals were recorded and the evoked cortical oscillatory activities were analyzed. Linear regression analyses were performed between EEG features and tactile discrimination performance. Main results. Spectral analysis revealed that alpha ERD over somatosensory regions persisted the whole task period and was related to the sensory information processing. Alpha ERD over prefrontal regions was only found during the stimulation judgement period and might reflect advanced cognitive process. There was no linear correlation between prefrontal alpha ERD and tactile discrimination performance. While contralateral somatosensory alpha ERDs exhibited significantly negative correlations with ARs ( ) and positive correlations with RTs (
 ). Specifically, the fitting results of higher alpha band (10–13 Hz) were superior to lower alpha band (8–10 Hz). Significance. Alpha ERD over contralateral somatosensory cortex could be used as an objective index for the evaluation of tactile acuity and might have the potential to be applied in sensory rehabilitation for amputees.
Export citation and abstract BibTeX RIS
1. Introduction
Tactile acuity is deemed as an intuitive reflection of sensory ability in the tactile domain [1]. It is widely used as a clinical indicator for the evaluation of somatosensory functionalities [2, 3]. Tactile acuity generally refers to the tactile discrimination performance. Various approaches have been proposed to characterize the tactile discrimination performance and quantify the tactile acuity. For example, two-point discrimination (TPD) has been extensively used in clinical practice to evaluate the tactile sensitivity for amputees [4]. Quantitative sensory testing (QST) including the discrimination of the stimulus properties (modality, intensity, spatial and temporal characteristics) was an alternative method to assess the functionality of somatosensory systems [5]. Additionally, the development of bidirectional neural-prosthesis also involved the evaluation of tactile discrimination performance for amputees [6, 7]. An example was represented by the long-term implanted peripheral neural interface to restore motor control and sensations to amputees, in which a two-alternative forced-choice paradigm was conducted to investigate the discriminability of tactile sensations evoked with different intensities [8]. In the paradigm, two stimuli were successively presented on each trial, and subjects' task was to determine which of the two was more intense. The just-noticeable difference (JND) was defined as the change in a stimulation parameter that yields 75% correct discrimination. However, these methods for tactile acuity evaluation are highly dependent on subjective judgements, in which the physiological sensations are only characterized by subjects' self-reports. How tactile information is transmitted in the human brain and which cortical areas are activated during a tactile discrimination task has not been completely understood. Few studies have investigated the correlation between the tactile discrimination performance and the evoked brain response [9, 10]. As yet, there is still no electrophysiology method to evaluate the tactile acuity.
Electroencephalography (EEG) has been attracted extensive interests as an electrophysiological imaging tool, which offers a superior opportunity to study the whole-brain activity with excellent temporal resolution [9]. EEG is particularly suitable for amputees due to its non-invasiveness, portability and safety [11]. Their uses in studying the cortical responses to tactile stimulation [12] and investigating the functionality of ascending sensory pathways [13, 14] have been reported. EEG studies of neural oscillations accompanying tactile stimulation revealed the functional role of different oscillating rhythms such as alpha [15] and beta [9] rhythms. For example, the alpha oscillation was suggested to be closely associated to sensory processing [16]. The decrease of oscillatory alpha power relative to the baseline is often named as alpha event related desynchronization (ERD), whereas an increase of oscillatory alpha power is referred as alpha event related synchronization (ERS) [17]. The alpha ERD/ERS can be modulated by tactile stimulation [18, 19] and attention [20, 21]. Some simultaneous EEG-functional magnetic resonance imaging (fMRI) studies have reported the significantly negative correlation between alpha ERD and blood-oxygen-level dependent (BOLD) responses in primary sensorimotor cortex under mirror visual feedback (MVF) [22, 23]. It was illustrated that sensorimotor alpha ERD might reflect the downstream modulatory activity of the sensorimotor cortex [24]. Furthermore, experimental data confirmed the idea that alpha ERDs are a correlate of activated cortical networks related to tactile information processing [25]. And a diminished power of alpha rhythms for patients with somatosensory disorders have been reported [26]. Therefore, electrical stimulation-evoked alpha ERD might be correlated with the residual sensory functionality of amputees for whom sensory information processing is affected due to amputation.
In our previous study, we have revealed the linear correlations between the difference of steady-state somatosensory evoked potential (SSSEP) amplitude and the difference of discrimination performance for the left and right hand stimulation. It was implicated that SSSEP amplitude could be used as an objective index to evaluate the difference of tactile acuity between the left and right hand [27]. As a development of previous work, objectives of the current study were (i) investigating which oscillatory activity and cortical regions would be dominant and play a functional role in the tactile discrimination task, (ii) analyzing the correlations between electrophysiology features and tactile discrimination performance, and proposing an objective index for the evaluation of tactile acuity. Two kinds of tactile sensations (vibration and pressure) with three levels of intensities were evoked on two finger areas (thumb and index for healthy hands, thumb and index-projected areas for disabled hands) via TENS. Subjects were asked to discriminate the specific intensity and area of the applied stimulation. To assess the neuronal correlates of tactile discrimination, the whole-head EEG was recorded and cortical oscillatory activities were analyzed. We assessed the discrimination performance (discrimination accuracy rates and response time) to quantify the tactile acuity. Then the correlations between EEG features and discrimination performance were investigated. The research ideas were illustrated in figure 1. We intended to evaluate the following hypotheses: (i) We expected distinct task-related alpha ERD over contralateral somatosensory and other task-related cortices. (ii) The involvement of activated cortical areas during different periods of the task should be different. If it is true, the recruiting of different cortical areas during different periods might be attributed to the distinct functional roles of the activated cortices and the information flow among cortices. (iii) Task-related alpha ERD was expected to be linearly correlated with the discrimination performance. The study of EEG oscillatory activities would thus yield insights into the temporal, frequency and topographical signature of tactile discrimination process. It is likely to reveal more physiological mechanisms underlying the cortical response to electrotactile stimulation. And tactile acuity evaluation derived from EEG may play an important role in neurorehabilitation clinical practice.
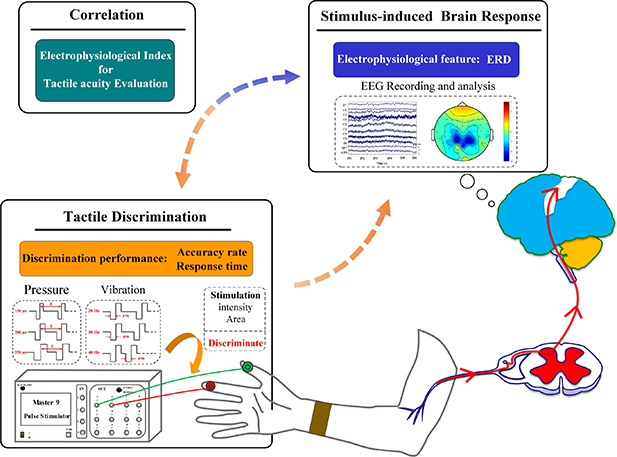
Figure 1. The research ideas of the current study. Alpha ERD over contralateral somatosensory and other cortical areas was expected to be evoked by the electrotactile stimulation. Each activated cortical area corresponded specific functional role during different time periods of the task. Task-related alpha ERD was expected to be linearly correlated with the discrimination performance.
Download figure:
Standard image High-resolution image2. Methods
2.1. Participants
Four unilateral forearm amputees (denoted as A1 to A4) and thirteen able-bodied subjects (10 males and 3 females, mean age ± SD = 24 ± 2, denoted as H1 to H13) participated in this study. All the amputees were right-handed before the amputation. None of the amputees had a history of neurological or psychiatric disease. All the subjects were paid for their participation and full written informed consents were obtained from them in accordance with the Declaration of Helsinki.
Before the experiment, finger-projected areas were identified on the stump for each amputee through palpation (touch the forearm stump using a test stylus with a globular head of 2 mm in diameter) [28]. Detailed characteristics for each amputee were shown in table 1.
Table 1. Clinical and phantom limb characteristics of each amputee.
| Gender, | Amputated side/ | Time since | Phantom pain | PFMs and the | ||
|---|---|---|---|---|---|---|
| age | dominant side, | amputation, | Prothesis usage, | intensity | finger-projected | |
| Subject | (years) | stump lengtha(cm) | (Years) | type | (VAS: 0-10)c | areasb |
| A1 | F,64 | L/R,19 | 35 | All day, cosmetic | Yes (2) | PFM (5) |
| A2 | M,65 | L/R,20 | 11 | All day, cosmetic | Yes (5) | PFM (5) |
| A3 | M,41 | R/R,15 | 14 | All day, cosmetic | Yes (5) | PFM (5) |
| A4 | M,41 | R/R,23 | 11 | All day, cosmetic | Yes (5) | PFM (5) |
aStump length refers to the distance from elbow crease to stump terminal in centimeter. bProjection finger map (PFM) usually consists of partial (from 1 to 4) or all 5 independent finger-projected areas (thumb, index, middle, ring, and little fingers). cVisual analogue scale (VAS) is used to test the subjective strength gradation of the phantom limb pain (from 0 to 10).
2.2. Experimental paradigm and stimuli
The objective of this experiment was to investigate the brain response during tactile discrimination task and characterize the correlation between task-related EEG features and tactile discrimination performance, which could be used to elucidate the feasibility of EEG features as an objective index for tactile acuity evaluation. Subjects were required to complete two sessions (i.e. the vibration session and the pressure session) of tactile discrimination task. As a stimulus, multi-pulse train of biphasic, rectangular current pulses were generated by the Master-9 Pulse Stimulator with isolators (Iso-Flex, A.M.P.I Company, Israel). Sensations of vibration and pressure were generated by grading the frequency and pulse width, respectively. A kind of custom-made surface electrode array (Shanghai Global Biotech Inc. China) with two copper circles (5 mm in diameter) was used in this experiment. Stimulation was applied to the thumb and index for healthy hands, while the thumb and index-projected areas were stimulated for amputated hands. To reduce artifacts induced by electrical stimulation, each subject wore a wrist strap. The wrist strap was made of copper and connected to the ground of the stimulation electrical circuit [29]. Within the tactile discrimination task, subjects had to discriminate three stimulated areas and three levels of intensities (low/medium/high) in each session. In the vibration session, the pulse width was 200 µs. And frequencies were 20, 30 and 40 Hz for three levels of vibration intensities, respectively. In the pressure session, the frequency was set to 30 Hz. And pulse widths were 150 µs, 200 µs and 250 µs for three levels of pressure intensities, respectively. Detailed stimulation parameters were displayed in table 2 and table 3. The selection of frequencies in the vibration and pressure sessions were based on the results of our pilot test [27]. And all stimulation parameters in this experiment were all below the pain threshold which have been quantified in our previous work [28]. The stimulated side, the three stimulation levels as well as the three stimulated areas, were pseudorandomly intermixed for each session. Each session consisted of 14 types, and each type included 15 trials, yielding a total of 210 trials, as illustrated in figure 2(A). The order of session presentation was counterbalanced across subjects. Short breaks were provided to each subject between two sessions to avoid mental fatigue and habituation.
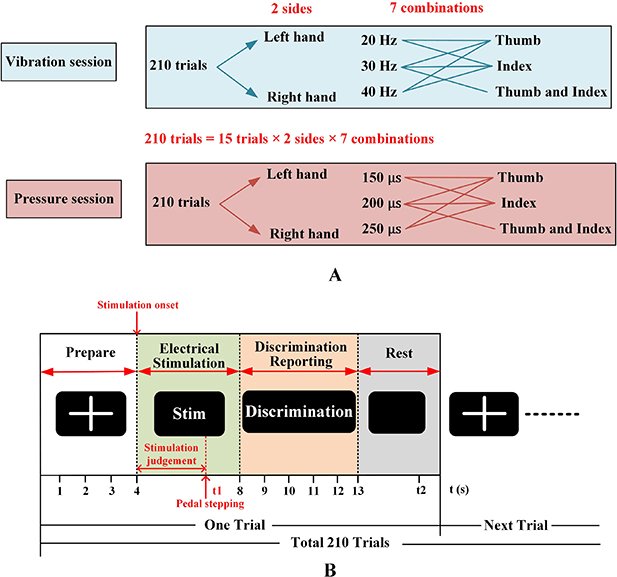
Figure 2. The schematic of the whole experiment. (A) Illustrations of the vibration and pressure session. There were 14 stimulation types for each session. Each type included 15 trials, yielding 210 trials for each session. (B) The procedure of a single trial.
Download figure:
Standard image High-resolution imageTable 2. Detailed stimulation parameters in the vibration session.
| Stimulated area | Frequency | Current amplitude | Pulse width |
|---|---|---|---|
| Index/Index-projected area | 20 Hz | 3 mA | 200 µs |
| 30 Hz | |||
| 40 Hz | |||
| Thumb/Thumb-projected area | 20 Hz | 3 mA | 200 µs |
| 30 Hz | |||
| Thumb and index/Thumb and index-projected area | 40 Hz | 3 mA | 200 µs |
| 30 Hz |
Table 3. Detailed stimulation parameters in the pressure session.
| Stimulated area | Pulse width | Current amplitude | Frequency |
|---|---|---|---|
| Index/Index-projected area | 150 µs | 2 mA | 30 Hz |
| 200 µs | |||
| 250 µs | |||
| Thumb/Thumb-projected area | 150 µs | 2 mA | 30 Hz |
| 200 µs | |||
| Thumb and index/Thumb and index-projected area | 250 µs | 2 mA | 30 Hz |
| 200 us |
EEG signals were simultaneously recorded during the tactile discrimination task. Subjects were seated in a comfortable armchair with both forearms and fingers resting on the armrest. In order to reduce movement-related artifacts, subjects were required to limit their eye blinks, arm and finger movements during stimulation. A liquid crystal display (LCD) was set approximately 60 cm in front of subjects to display visual cues. Prior to EEG recording, all subjects were familiarized with the tactile discrimination task and received about 50 trials with immediate feedback until they reached a stable performance level. The experimental protocol was illustrated in figure 2(B). At the beginning of each trial, a white cross with black background appeared on the LCD to remind the subject to be prepared for the subsequent tasks. At the 4th second, the electrotactile stimulation began and lasted for 4 s. Subjects were required to carefully feel the stimulation and try to judge the current stimulation type. Once they confirmed the specific stimulation type, they were required to step on the pedal and then just pay attention to feel the stimulation rather than re-discriminate the stimulation. The time ranged from stimulation onset to pedal stepping was regarded as stimulation judgement period in this study. When the stimulation stopped, they were asked to report the stimulation type (stimulated side: left or right; stimulated area: thumb, index or both; stimulation level: high, middle or low) that they had confirmed at the point of pedal stepping. Finally, a random time of 3–5 s was appended to the relaxation period to limit subjects' adaption. After the experiment, all amputees reported no stimulus-evoked pain on the stump or adjacent areas of the limb during the stimulation.
2.3. EEG recording
EEG signals were recorded using a SynAmps2 system (NeuroScan, U.S.A.) and a quick-cap with 64 Ag/AgCl electrodes. Electrodes were placed according to the extended 10-20 system. The reference electrode was located on vertex, and the ground electrode was located on forehead. The low-pass filter setting was 0.5–100 Hz with a sampling rate of 1000 Hz, and a 50 Hz notch filter was used to diminish power line interference. Impedances of all electrodes were kept below 5 kΩ.
2.4. Data analysis
The EEG data were segmented into 6 s epochs including [–3.5−0.5] s prior to stimulation onset (baseline) and [0.5 3.5] s post stimulation onset (task state). Trials contaminated by artifacts such as swallowing and movement were excluded (the ratio of rejected trials was 6 %). We defined EEG signals in the baseline and task state as two class labels, respectively. The R2 index (squared Pearson-correlation coefficient between EEG features and class labels) [30] was used to evaluate the contribution of different frequency bands and EEG channels to the task-related response. It was calculated based on the spatial-spectral-temporal structures of EEG signals in the baseline and task state. With topographic R2 value distributions, we can have better understanding for the related channel and frequency band of the brain activation during the tactile discrimination task. Here, the topoplot of R2 values were averaged in the frequency band of alpha band (8–13 Hz).
As a variant of ERD, event-related spectral perturbation (ERSP) was used to visualize the spectral power changes corresponding to tactile discrimination task [31–33]. ERSP was generally formulated as
where n was the number of trials, and Fk(f, t) was the spectral estimation of the kth trial with frequency = f and time = t. Short-time Fourier transform (STFT) was applied in time-frequency analysis of EEG data. ERSP was calculated every 200 ms with a Hanning-tapered window, convoluted with a modified sinusoid basis in which the number of cycles linearly changed with frequencies to achieve proper time and frequency resolution [34]. Note that the ERSP values were log-transformed prior to further analysis.
To visualize the topographical distributions of cortical activations during the task, we divided the task period into two sequential time periods. The first period was chosen from stimulation onset to the pedal stepping, thus including the stimulation presentation and judgement, which was termed as stimulation judgement period. The second period was defined from the pedal stepping to the end of stimulation, in which only stimulation presentation was included. Trials in which the pedal was stepped after the end of stimulation were excluded in this analysis (the ratio of excluded trials was 7 %). In order to obtain an overall topographical distribution of cortical activation for the two sequential time periods, the spectral powers were averaged in the alpha band across subjects and all stimulation types of trials.
Based on topographic R2 value distributions, channels with R2 > 0.03 were chosen for the calculation of alpha ERD/ERS. There were two kinds of alpha ERD/ERS in this study, i.e. prefrontal alpha ERD/ERS and somatosensory alpha ERD/ERS. Here, channels of FP1, FPZ, FP2, AF3 and AF4 over the prefrontal cortex were selected to calculate the prefrontal alpha ERD/ERS. Channels of FC3, C5, C3, C1 and CP3 were selected to calculate left-hemisphere somatosensory alpha ERD evoked by right side stimulation. Similarly, channels of FC4, C2, C4, C6 and CP4 were selected to calculate right-hemisphere somatosensory alpha ERD/ERS evoked by left side stimulation. In the following description, we collectively called them contralateral somatosensory alpha ERD/ERS. ERSP values were normalized by subtracting the baseline of t = [–3.5−0.5] s for each of those channels. Alpha ERD/ERS was obtained by averaging the normalized ERSP values in alpha band (8–13 Hz) over corresponding period and channels.
For additional analysis of performance-related difference, an equal (i.e. the minimum) number of correct and incorrect trials were randomly selected for each subject and each stimulation type. The correct discrimination referred to subjects must report all correct information of the three kinds of evaluation types: intensity, stimulated area and stimulated side. Any trial with one or both two kinds information wrongly reported was considered as incorrect discrimination. The above analyses (topographical distributions of cortical activations and alpha ERD/ERS calculation) were then applied to the equal-numbered subsets of correct and incorrect trials, respectively.
In the stimulation discrimination task, accuracy rate (AR) and response time (RT) served as behavioral measures of tactile acuity. RT was the time from the beginning of the electrotactile stimulation to the onset of pedal stepping, which reflected the duration to discriminate the current stimulation type. AR was generally formulated as
In this study, AR/RT for 'vibration intensity discrimination', 'pressure intensity discrimination' and 'stimulated area discrimination' were represented by ARv/RTv, ARp/RTp and ARa/RTa, respectively.
In our preliminary test, there was no significant difference of the stimulus-evoked alpha ERD between the finger stimulation for able-bodied subjects and the same finger-projected area stimulation for amputees. Therefore, we divided the stimulated areas into four categories for the two groups of subjects (i.e. able-bodied subjects and amputees), left healthy hand (HL), right healthy hand (HR), left finger-projected area (LFP) and right finger-projected area (RFP). For each stimulation level, the size of group LFP/RFP was 4 and the size of group HL/HR was 30. We calculated alpha ERD/ERS (in the prefrontal cortex and somatosensory cortex) and ARs/RTs for each stimulated area under each level of stimulation. Then linear regression analyses were conducted between alpha ERD/ERS (contralateral somatosensory alpha ERD/ERS and prefrontal alpha ERD/ERS) and ARs/RTs. Specially, the correlations between sub-alpha ERD/ERS (lower alpha band of 8–10 Hz and upper alpha band of 10–13 Hz) and discrimination performance were also analyzed to further investigate the functional difference between sub-alpha bands.
2.5. Statistical analysis
In the experiment, the factors (independent variables) were the stimulation level (20 Hz, 30 Hz and 40 Hz in the vibration session, 150 µs, 200 µs and 250 µs in the pressure session) and stimulation area (HL, HR, LFP and RFP). There were three dependent variables, the values of alpha ERD/ERS, AR and RT. As we only focused on the brain response and discrimination performance under each sensation (vibration or pressure) rather than the difference between the two sensations, sensory modality was not considered as a factor. All the data were demonstrated normally distributed through the Kolgomorov-Smirnov test (p > 0.05) before significant analyses. A two-way ANOVA was used to statistically analyze the significant influence of the two factors (stimulation level and stimulation area) on alpha ERDs/ERSs, ARs and RTs in the two sessions, respectively. According to the two-way ANOVA, there was no interaction between the two factors, but there were respective differences in the three dependent variables. Tukey's HSD post hoc test was used to correct for multiple comparisons. For the analysis of performance-related difference, two-tailed, paired-samples t-test was used to compare the difference of alpha ERDs/ERSs between correct and incorrect discrimination.
3. Results
3.1. Task-related brain response
The R2 index was used to localize the discriminative information distribution among the spatial-spectral-temporal space between EEG signals in the baseline and task state. The averaged R2 value distribution of all stimulation types and subjects was shown in figure 3. Discriminative information emerged out in the alpha band (see figure 3(A)) and had a well physiological localization concentrated on the channels over prefrontal and somatosensory cortices (see figure 3(B)). It was indicated that the activations of prefrontal and somatosensory cortices in the alpha frequency band were related to the tactile discrimination task.

Figure 3. The averaged R2 value distribution of all stimulation types and subjects in spatial-spectral space. (A) R2 value distribution across frequency and spatial domain. (B) The topoplot of R2 value averaged in alpha band (8–13 Hz).
Download figure:
Standard image High-resolution imageBased on the activated frequency band, we further analyzed the cortical activation within alpha band during the two sequential time periods in the tactile discrimination task. The grand averaged topographical distribution of cortical activation in alpha band during the two periods were illustrated in figure 4. Alpha ERD appeared over prefrontal and somatosensory cortices during the stimulation judgement period (from stimulation onset to pedal stepping). Whereas during the second period (from pedal stepping to the end of stimulation), alpha ERD was only observed in bilateral somatosensory cortices. Interestingly, the left-hemisphere topography of alpha ERD was more obvious and more posterior when compared to the right hemisphere. Analyses of equal-numbered subsets of correct and incorrect discrimination trials (see figure 5) showed similar activation patterns as figure 4. We found obvious activations of the prefrontal cortex during the stimulation judgement period no matter for the correct or incorrect discrimination. However, very subtle activations of the somatosensory cortex were observed for incorrect discrimination during the whole task. The statistical analysis indicated a significantly stronger somatosensory alpha ERD for correct discrimination (period 1 F = 10.1, p = 2.4 10−4; period 2 F = 9.8, p = 1.6 10−4) during each period when compared to that for incorrect discrimination. While there was no significant difference of prefrontal alpha ERD between the correct and incorrect discrimination during the stimulation judgement period (F = 0.93, p = 0.81).

Figure 4. The grand averaged topographical distribution of cortical activation in alpha band during the two sequential time periods.
Download figure:
Standard image High-resolution image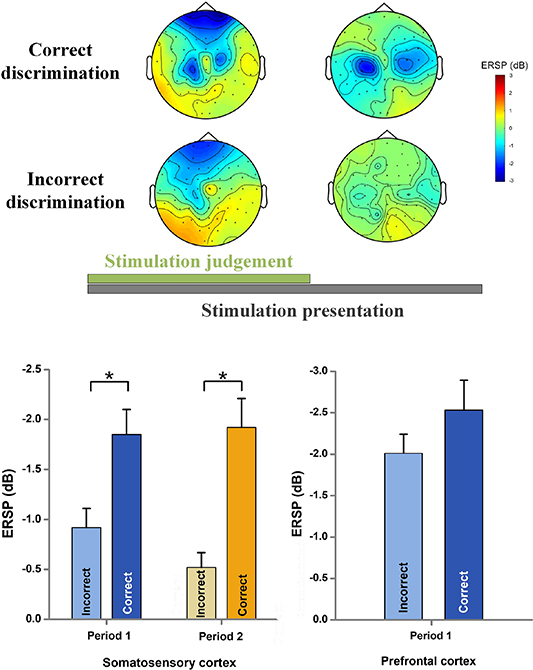
Figure 5. Averaged topographical distribution and alpha ERDs for correct and incorrect discrimination during the two sequential periods. The topographical distributions and alpha ERDs were averaged across all subjects and stimulation types. Symbol '*' indicated a significant difference with a level of  .
.
Download figure:
Standard image High-resolution imageFor correct discrimination trials, ipsilateral somatosensory alpha ERS and contralateral somatosensory alpha ERD was calculated during the whole task state, while prefrontal alpha ERD was calculated only during the stimulation judgement period. Ipsilateral somatosensory alpha ERS was not found under each level of stimulation intensity for each stimulated area. For the contralateral somatosensory alpha ERD in the vibration session (see figure 6(A)), the results showed that the ERSP value at 20 Hz was approximately the same as the value at 30 Hz for each kind of stimulated area, while the value of ERSP was smaller (i.e. stronger alpha ERD) at the frequency of 40 Hz than that at 20/30 Hz. Tukey's HSD post hoc test showed that there was a statistically significant difference of ERSP value for HL between 20 and 40 Hz (F = 3.2, p = 2.1 10−2). When stimulated at 20 Hz and 30 Hz, the ERSP values were both statistically smaller for HR compared to that for LFP (20 Hz F = 5.1, p = 5.3 10−3; 30 Hz F = 5.6, p = 4.9 10−3). The results of contralateral somatosensory ERD in the pressure session were similar to those in the vibration session, which were shown in figure 6(B). Note that the ERSP values for HR and LFP exhibited a significant difference under the pulse width of 200 µs (F = 4.9, p = 6.1 10−3). Figures 6(C) and (D) showed prefrontal alpha ERD in the vibration and pressure session, respectively. We found there was no difference of ERSP values among three levels of stimulation intensities.

Figure 6. Averaged ERSP of four stimulated areas under three levels of stimulation intensities. (A) and (B) represented the averaged ERSP over the contralateral somatosensory cortex in the vibration and pressure session, respectively. (C) and (D) represented the averaged ERSP over the prefrontal cortex in the vibration and pressure session, respectively. Symbol '*' indicated a significant difference with a level of  .
.
Download figure:
Standard image High-resolution imageFigure 7 illustrated the EEG activity over contralateral somatosensory area (channels C3 or C4) during the tactile discrimination task, for an exemplary stimulus condition (3 mA, 30 Hz, 200 µs). It was evident that a power decrease (ERD) in the alpha band (8–13 Hz) was evoked in the contralateral sensorimotor area for each stimulated area. We noticed that the activation patterns between HL and HR, LFP and RFP were similar. The alpha ERDs were stronger for HL/HR when compared to LFP/RFP. Moreover, we observed a steady-state response of power increase (ERS) around the stimulation frequency (30 Hz) throughout the task.
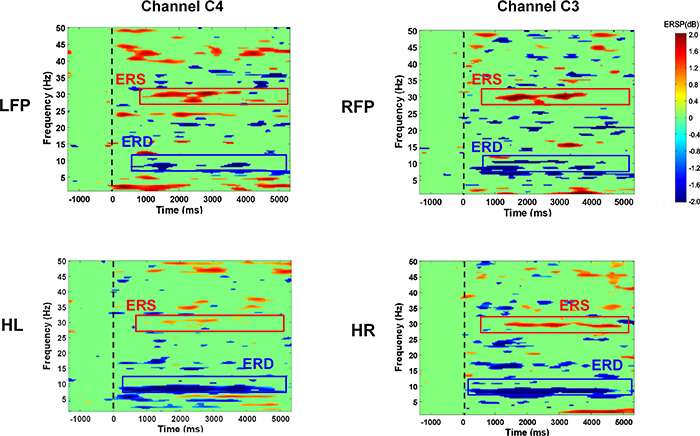
Figure 7. Averaged event-related spectrum perturbation (with bootstrap significance p = 0.01) over the somatosensory channel (channel C3 or C4) which was contralateral to the stimulated area (HL, HR, LFP, RFP), for an exemplary stimulus condition (3 mA, 30 Hz, 200 µs).
Download figure:
Standard image High-resolution image3.2. Discrimination performance
ARvs of four stimulated areas at three levels of stimulation frequencies were shown in figure 8(A). ARvs were higher than 70% on average for both HL and HR at each level of frequency, while the results were different for LFP and RFP. For all the stimulated areas, the discrimination tasks were completed with the highest ARvs when stimulated at 40 Hz. Tukey's HSD post hoc test indicated that ARv for HR was statistically higher than LFP when stimulated at each frequency level (20 Hz F = 3.8, p = 8.2 10−3; 30 Hz F = 5.2, p = 7.4 10−3; 40 Hz F = 3.4, p = 1.1 10−2). And there was a significant difference of ARv between HR and RFP at the frequency of 20 Hz (F = 2.8, p = 3.2 10−2). Figure 8(B) showed ARps of four stimulated areas under three levels of pulse widths. There were significant differences of ARp between HR and LFP under the pulse widths of 150 and 250 µs (150 µs F = 3.1, p = 3 10−2; 250 µs F = 2.1, p = 3.9 10−2). ARp was highest when stimulated with 250 µs for each stimulated area. Note that ARvs and ARps in figure 8 were obviously higher than the chance level (40%). RTv and RTp of four stimulated area under three levels of stimulation intensities were shown in figures 9(A) and (B), respectively. Similar to the results of ARv and ARp, subjects spent least time to discriminate the high level of intensity when compared to the low and middle levels. Tukey's HSD post hoc test indicated that RTv for HR was statistically shorter than LFP at the frequency of 20 Hz (F = 5.1, p = 6.3 10−3). For specific levels of stimulation intensity (e.g. 20, 30, and 40 Hz for ARv, 150 and 250 µs for ARp, 20 Hz for RTv), the discrimination performances of healthy fingers were better than that of finger-projected areas.
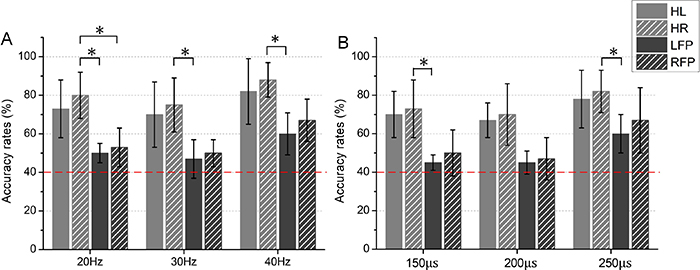
Figure 8. Averaged ARvs/ARps of four stimulated areas under three levels of stimulation intensities. (A) for the vibration intensity discrimination, (B) for the pressure intensity discrimination. The red dashed lines represented the trial-number corrected chance level of 40 % with p = 0.05. Symbol '*' indicated a significant difference with a level of  .
.
Download figure:
Standard image High-resolution image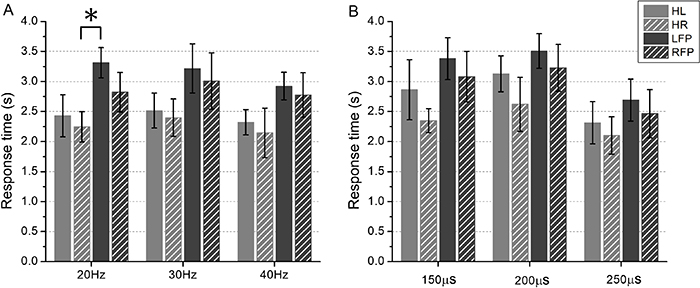
Figure 9. Averaged RTvs/RTps of four stimulated areas under three levels of stimulation intensities. (A) for the vibration intensity discrimination, (B) for the pressure intensity discrimination. Symbol '*' indicated a significant difference with a level of  .
.
Download figure:
Standard image High-resolution image3.3. Correlations between alpha ERDs and discrimination performance
Linear regression analyses were conducted between somatosensory/prefrontal alpha ERD and discrimination performance. The results indicated that there were poor correlations between the prefrontal alpha ERDs and ARs/RTs (p > 0.05), while contralateral somatosensory alpha ERDs were linearly correlated with ARs/RTs ( ). For vibration intensity discrimination, results of linear regression analyses between contralateral somatosensory alpha ERDs and ARvs for the four stimulated areas were shown in figure 10. It was indicated that contralateral somatosensory alpha ERD was negatively correlated with ARv. The correlation coefficient of r was −0.71 for LFP, −0.71 for RFP, −0.74 for HL and -0.73 for HR. The tendency of correlation were similar for the pressure intensity discrimination, as shown in figure 11. For LFP and RFP, r was equal to –0.71 and –0.72, respectively. While the correlation coefficients were a bit higher for HL (r = –0.75) and HR (r = –0.76). The correlation between contralateral somatosensory alpha ERD and ARa was only analyzed for amputees (see figure 12). The ERD was negatively correlated with ARa with r = –0.65 for LFP and r = –0.63 for RFP. Figure 13 showed the results of linear regression analyses between contralateral somatosensory alpha ERD and RTv/RTp for healthy finger stimulation (HL and HR). There were positively linear correlations between contralateral somatosensory alpha ERDs and RTs. For the frequency intensity discrimination, the correlation coefficient r was 0.66 and 0.69 for HL and HR, respectively. For the pressure intensity discrimination, r equaled to 0.68 for HL and 0.70 for HR. When further analyzed the correlations between contralateral somatosensory ERDs of sub-alpha bands (lower alpha band of 8–10 Hz and upper alpha band of 10–13 Hz) and discrimination performance, we found the fitting results were best for 10–13 Hz, followed by 8–13 Hz, and finally for 8–10 Hz.
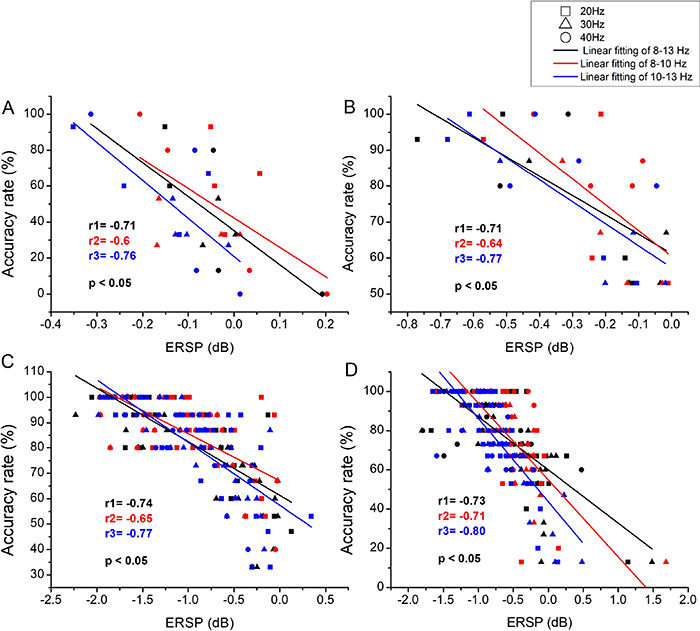
Figure 10. The results of linear regression analyses between contralateral somatosensory alpha/sub-alpha ERDs (including alpha band of 8–13 Hz, lower alpha band of 8–10 Hz and upper alpha band of 10–13 Hz) and ARv for frequency intensity discrimination. (A) and (B) represented the results for LFP and RFP, respectively. (C) and (D) represented the results for HL and HR, respectively.
Download figure:
Standard image High-resolution image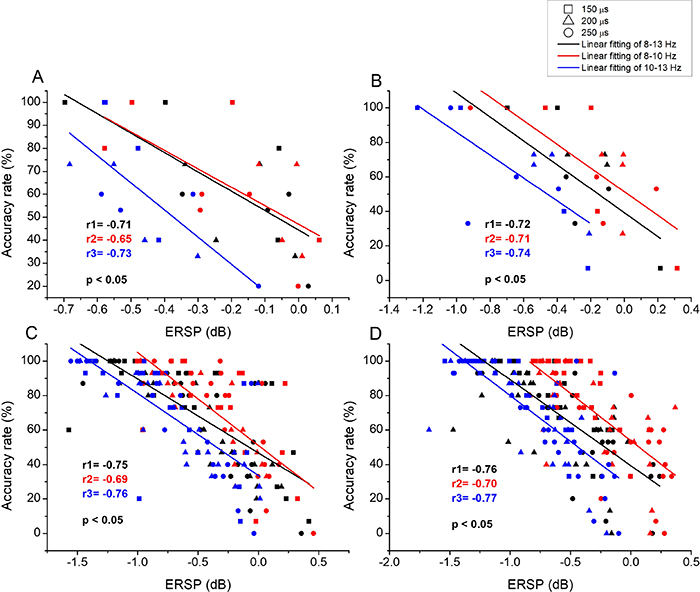
Figure 11. The results of linear regression analyses between contralateral somatosensory alpha/sub-alpha ERDs (including alpha band of 8–13 Hz, lower alpha band of 8–10 Hz and upper alpha band of 10–13 Hz) and ARp for pressure intensity discrimination. (A) and (B) represented the results for LFP and RFP, respectively. (C) and (D) represented the results for HL and HR, respectively.
Download figure:
Standard image High-resolution image
Figure 12. The results of linear regression analyses between contralateral somatosensory alpha/sub-alpha ERDs (including alpha band of 8–13 Hz, lower alpha band of 8–10 Hz and upper alpha band of 10–13 Hz) and ARa for amputees. (A) and (B) represented the results for LFP and RFP, respectively.
Download figure:
Standard image High-resolution image
Figure 13. The results of linear regression analyses between contralateral somatosensory alpha/sub-alpha ERDs (including alpha band of 8–13 Hz, lower alpha band of 8–10 Hz and upper alpha band of 10–13 Hz) and RTv/RTp for able-bodied subjects. (A) and (B) represented the results of HL and HR for vibration intensity discrimination, respectively. (C) and (D) represented the results of HL and HR for pressure intensity discrimination, respectively.
Download figure:
Standard image High-resolution image
4. Discussion
We simultaneously conducted EEG recording and electrotactile stimulation discrimination experiment in this study. The study aimed to elucidate the cortical oscillations underlying tactile discrimination process and characterize the correlations between EEG features and discrimination performance. Subjects had to discriminate the specific intensity and area of the applied stimulation. Analyzing the electrophysiology activities related to tactile discrimination, we found a robust and dominant alpha (8–13 Hz) power decrease (alpha ERD) over the somatosensory and prefrontal cortices. Interestingly, somatosensory alpha ERD was found during the whole task, while prefrontal alpha ERD was only found during the stimulation judgement period (from the stimulus onset to the pedal stepping). Linear regression analyses showed that contralateral somatosensory alpha ERD was negatively correlated with AR and positively linear correlated with RT. Whereas there was no linear correlations between prefrontal alpha ERD and AR/RT. The findings showed the involvement of prefrontal and somatosensory cortices in tactile discrimination, and demonstrated the connection between tactile discrimination performance and quantified measures of physiological brain activity. Contralateral somatosensory alpha ERD might be used as a bio-marker to evaluate the tactile acuity and assess the effects of therapeutic interventions.
4.1. Alpha ERD and cortical activation
EEG studies have demonstrated the oscillatory activities over somatosensory and other task-related cortices during tactile discrimination [35, 36]. In our study, the averaged R2 value distribution showed the discriminative information between baseline and task state was emerged out in the alpha band over prefrontal and somatosensory cortices (see figure 3). Alpha ERD over the somatosensory cortex was found during the whole task period, as shown in figure 4. Consistent with the result of Nikouline et al [18], alpha ERD at the primary somatosensory cortex could be evoked by median-nerve stimulation. Somatosensory alpha ERD seems to reflect the tactile information transmission and processing. Interestingly, alpha ERD over the prefrontal cortex was only observed during the stimulation judgement period in our study. With the explosion in research on prefrontal cortex functions, it has become increasingly clear that they are involved in advanced cognition, such as working memory, attention regulation and judgement [37]. During the stimulation judgement period, subjects sensed the applied stimulation and tried to judge the specific type of the current stimulus. The involvement of prefrontal cortex might contribute to the judgement and decision for the applied stimulation.
To further investigate the different roles of somatosensory and prefrontal cortices during tactile discrimination task, the cortical activation for correct and incorrect discrimination during the two sequential periods were analyzed and compared, as illustrated in figure 5. We found obvious activations of the prefrontal cortex during stimulation judgement period both for correct and incorrect discrimination with no significant difference. In contrast, the somatosensory cortical activation showed different results for correct and incorrect discrimination. As figure 5 showed, strong somatosensory alpha ERD was evoked during the two sequential periods for correct discrimination. As for incorrect discrimination, we observed weak somatosensory cortical activations during the task. The somatosensory alpha ERD during each period was significantly stronger for correct discrimination than that for incorrect discrimination. We thus got that the somatosensory alpha ERD might be related to the discrimination performance while the prefrontal alpha ERD might be not. Based on the weak somatosensory alpha ERD for incorrect discrimination, we speculated that the sensory information was not effectively transmitted along the peripheral nerve pathways to the somatosensory cortex in these incorrect trials. This speculation was consistent with the weaker somatosensory alpha ERD for amputated sides than that for healthy sides (see figure 6), as the peripheral nerve pathways might be affected after amputation. Therefore, we thought the sensory information transmitting and processing mattered the final discrimination performance, which was reflected by the somatosensory alpha ERD. Based on the strong prefrontal alpha ERD during stimulation judgement period for both correct and incorrect discrimination, it was implied to reflect the process of stimulation judgement and decision making during the tactile discrimination task no matter the final judgement was right or not. Interestingly, we observed that the left-hemisphere topography of averaged alpha ERD was more obvious when compared to the right hemisphere (see figures 4 and 5). The hand preference was suggested to be associated with an increased surface of the precentral gyrus and more intra-cortical connections in the dominant hemisphere [38]. As all subjects were right-handed in our study (see table 1), the structure-function correlation might result in a stronger stimulus-evoked activation in the left hemisphere.
For correct discrimination trials, prefrontal alpha ERD during stimulation judgement period and contralateral somatosensory alpha ERD during the whole task were calculated, respectively, as shown in figure 6. Some general conclusions and interesting phenomena were found out. For contralateral somatosensory alpha ERD, a stronger alpha ERD was observed at the frequency of 40 Hz when compared to 20/30 Hz in the vibration session (see figure 6(A)), which was similar in the pressure session (see figure 6(B)). Increasing the stimulation frequency resulted in an increase in the firing rate of activated neurons. While increasing the pulse width leaded to the recruitment of additional neurons [39–41]. The stimulation frequency and pulse width had systematic and cooperative effects on perceived tactile intensity which depended on the total stimulation charge applied per second [8]. We found no significant difference of alpha ERD between 30 Hz and 20 Hz . It might due to the non-linear relationship between the stimulation parameters and stimulus-evoked alpha oscillations, which deserved to be further investigated in the future. In contrast, there was little difference of prefrontal alpha ERD among three levels of stimulation intensities, as shown in figures 6(C) and (D). It was implied that the value of prefrontal alpha ERD was independent of stimulation parameters. We thus speculated that somatosensory alpha ERD was evoked by the tactile stimulation itself, which might be related to the functionality of the upscending sensory pathway and sensory information processing. Prefrontal alpha ERD was suggested to be induced by the stimulation judgement, which might represent the process of advanced information integration and decision making. These were in accordance with the results of different activated cortical areas during the two sequential time periods of the task (see figure 4).
4.2. Correlations between alpha ERDs and discrimination performance
In order to explore the functional role of alpha ERDs (somatosensory alpha ERD and prefrontal alpha ERD) during the tactile discrimination task, we calculated the correlation coefficients between alpha ERDs and subjects' discrimination performance. Only the somatosensory alpha ERD was found to be correlated with subjects' discrimination performance. The contralateral somatosensory alpha ERDs showed negative correlations with ARs and positive correlations with RTs in the linear regression analyses (refer to figures 10, 11, 12 and 13). We found the three shapes of fitting points (representing three levels of stimulation intensities) were uniformly distributed around the regression line, indicating a generalized correlation for different stimulation parameters. The linear correlations between contralateral somatosensory alpha ERD and discrimination performance were consistent with our speculations about the functional role of somatosensory cortex in facilitating tactile information processing. In contrast, the prefrontal cortex was not associated to the discrimination performance. And its functional role of reflecting the process of stimulation judgement and decision making was only recruited during the stimulation judgement period. Furthermore, comparing the correlations between somatosensory ERDs of sub-alpha bands (8–10 Hz and 10–13 Hz) and discrimination performance, we found the fitting results were better for 10–13 Hz than 8–10 Hz. It was suggested that the functional roles of the two sub-alpha bands also differed in the current tactile discrimination task.
4.3. Implication
Alpha rhythm oscillations have been suggested to act as a gateway from sensation to cognition. Particularly, the amplitude and phase of the alpha rhythm entails a cortical mechanism which paces the access of sensory information into the cognitive system [42]. Evidence supporting this idea includes correlations between the amplitude/phase of alpha rhythm oscillations and behavioral performance in perception [43–45], spatial attention [46, 47] and working memory [48, 49]. Top-down mediated modulation of the alpha activity in somatosensory cortices could facilitate the processing of a specific input stream through an increase of excitability of task-relevant regions [50]. For example, Kelly et al found a relationship between alpha-lateralization and visual target discriminability/reaction time [51]. Moreover, recent studies have found that alpha activity appears to play a role in participants' subjective confidence in their visual judgements [52]. In general, the correlations between the alpha rhythm oscillations and behavioural performance were mostly investigated for visual or auditory processing, whereas few studies focused on tactile processing. In fact, bilateral alpha ERD has been observed during somatosensory stimulation, e.g. electrical stimulation of the median nerve [18] or tactile stimulation of the index finger [53, 54]. The current study investigated the correlations between electrotactile stimulation-evoked alpha ERDs and tactile discrimination performance for both amputees and able-bodied subjects, which might reveal more physiological mechanisms underlying the alpha rhythm oscillations for tactile processing.
The connection of EEG oscillations and tactile acuity was shown here by way of significantly linear correlations between contralateral somatosensory alpha ERD and tactile discrimination performance. Given these correlations, assessments of contralateral somatosensory alpha ERD during the sensory rehabilitation of the amputated limb could be used as an objective method for the tactile acuity evaluation. There are several clinical values of having EEG-derived bio-markers. Firstly, EEG is easily applicable in the clinical setting. Specifically, this non-invasive imaging tool is acceptable for amputees. Meanwhile, the EEG-based markers could indicate effects of therapeutic interventions and the course of treatment-induced recovery for amputees. Moreover, in terms of sensory feedback of the myoelectric prosthetic hand, the quality of evoked physiological sensation could be assessed using the index of somatosensory alpha ERD. Based on the correlations between contralateral somatosensory alpha ERD and ARs, the stimulation parameter with superior evoked-ERD could be selected to insure a better tactile discrimination performance, which could contribute to a more accurate transmission of electrotactile stimulation encode.
4.4. Limitations and future work
Several limitations of the current study should be mentioned. In our experiment, we only recruited four amputees, which may be not applicable for the statistical analysis of two-way ANOVA. Meanwhile, the group size of amputees was not sufficient enough for the linear regression analyses. More amputees should be recruited in the future to get a more reliable statistical analyses and a better fitting effectiveness. In addition, the effectiveness of electrical stimulation in producing natural pressure and vibration sensations was not assessed in the current study. A future work is necessary to compare the sensations evoked by TENS with natural sensations evoked by pressure or vibration instrument in order to further advancing this technique in realistic applications. Furthermore, the four recruited amputees all reported phantom limb pain, and this pain might have an effect on the somatosensory alpha ERD. However, the phantom limb pain-induced effect should be equivalent to all stimulation conditions, which is unlikely to be a confounding factor for this study. Separating the effect of phantom limb pain from tactile sensation would be an interesting study and is worthy of future investigation.
5. Conclusion
Current results suggested that in a tactile discrimination task, stimulus-evoked alpha ERD in the somatosensory cortex during the whole task period might relate to the sensory information processing, whereas stimulus-induced alpha oscillatory activity in the prefrontal cortex during the stimulation judgement period could reflect advanced cognitive process. Most importantly, the alpha ERD over the contralateral somatosensory cortex was linearly correlated with subjects' discrimination performance, while there was no linear correlation between prefrontal alpha ERD and discrimination performance. We therefore speculated that contralateral somatosensory alpha ERD could be used as an electrophysiological index for the tactile acuity evaluation and could be applied in clinical sensory rehabilitation.
Author Contributions
Shiyong Su and Guohong Chai conceived and designed the experimental paradigm. Shiyong Su performed the experiments. Shiyong Su analyzed the data and wrote the manuscript. Jianjun Meng discussed the data analysis protocol. Xiangyang Zhu secured the funding for this project and oversee the whole procedure of this project. Guohong Chai, Xinjun Sheng, Jianjun Meng, and Xiangyang Zhu all reviewed and edited the manuscript. All the authors read and approved the manuscript.
Funding
This work is supported in part by the China National Key R&D Program (Grant No. 2018YFB1307 200), the National Natural Science Foundation of China (Grant No. 91 948 302, No. 51 805 320), and the Science and Technology Commission of Shanghai Municipality (Grant No. 18JC1410 400).
Acknowledgment
We thank all the subjects for their participation in the study.