

Abstract
Objective. We report the transcranial functional photoacoustic (fPA) neuroimaging of N-methyl-D-aspartate (NMDA) evoked neural activity in the rat hippocampus. Concurrent quantitative electroencephalography (qEEG) and microdialysis were used to record real-time circuit dynamics and excitatory neurotransmitter concentrations, respectively. Approach. We hypothesized that location-specific fPA voltage-sensitive dye (VSD) contrast would identify neural activity changes in the hippocampus which correlate with NMDA-evoked excitatory neurotransmission. Main results. Transcranial fPA VSD imaging at the contralateral side of the microdialysis probe provided NMDA-evoked VSD responses with positive correlation to extracellular glutamate concentration changes. qEEG validated a wide range of glutamatergic excitation, which culminated in focal seizure activity after a high NMDA dose. We conclude that transcranial fPA VSD imaging can distinguish focal glutamate loads in the rat hippocampus, based on the VSD redistribution mechanism which is sensitive to the electrophysiologic membrane potential. Significance. Our results suggest the future utility of this emerging technology in both laboratory and clinical sciences as an innovative functional neuroimaging modality.
Export citation and abstract BibTeX RIS
1. Introduction
Although electrophysiological and invasive neurochemical techniques have been valuable in assessing activity within specific neuronal circuits in the brain, there is a distinct need for a non-invasive means to image real-time functional activity in deep brain structures in vivo. Previous optical imaging approaches to investigate the local cortical circuits of rodents [1–3] applied invasive procedures to overcome superficial imaging depth, but further extension to deeper brain regions such as the hippocampus was prohibitive. The imaging of electrophysiological or neurochemical dynamics within the hippocampus has been accomplished primarily by optical imaging of freshly-sliced brain tissue [4] or magnetic resonance imaging spectroscopy (MRS) for non-invasive quantification of glutamate at high spatial resolution [5, 6]. However, optical neuroimaging and MRS suffer from shallow imaging depth and from slow imaging speed, respectively. The application of two-photon microscopy to measure calcium ion dynamics in specific deep brain structures, including the hippocampus, has poor temporal resolution [7]. Therefore, a method for non-invasive neuroimaging of electrophysiological activity in deep brain structures, which reflects local excitatory neurotransmission, would be a significant advance.
Photoacoustic (PA) imaging is a hybrid approach combining optics and acoustics where the signal corresponding to neural activity is detected in the form of acoustic transcranial imaging with optical absorbance as an image contrast [8, 9]. PA imaging is based on thermo-elastic perturbation of a target evoked by light absorbance from pulsed laser illumination, which generates radio-frequency (RF) acoustic pressure waves detected by piezoelectric ultrasound transduction or optical interferometry. With this unique imaging technology, several attractive applications have been proposed for preclinical and clinical research with tomographic and microscopic imaging modes, including the detection of the endogenous contrast of cancer indicators, e.g. melanoma [10], breast microcalcifications [11–13], monitoring of cancer angiogenesis [14], oxygen metabolism [15], and quantification of lipid content [16, 17], among others. Recently, we reported that functional PA (fPA) neuroimaging of near-infrared voltage-sensitive dye (VSD) redistribution can detect graded membrane potential changes in a lipid vesicle model and a chemo-convulsant seizure model in the rodent brain in vivo [18].
Here, we validated the transcranial fPA neuroimaging of electrophysiological activity in the rat hippocampus in vivo through an intact scalp, with a direct correlation to focal excitatory neurotransmission. The tri-modal neural sensing approach utilized microdialysis, quantitative electroencephalography (qEEG), and transcranial fPA neuroimaging to simultaneously monitor the electrophysiological changes associated with focal glutamatergic excitation (figure 1). To stimulate the hippocampus, we infused N-methyl-D-aspartate (NMDA) into the rat hippocampus by reverse microdialysis to stimulate NMDA receptors. This approach produces dramatic changes in the extracellular glutamate concentration in the hippocampus, which can be related to fPA neuroimaging over the widest possible range. Dramatic electrophysiological changes were identified, culminating in seizure activity detected by qEEG, implying a disruption of the dentate gyrus (DG) gatekeeping function. It is known that failure of the DG to gate the propagation of excitatory inputs into the hippocampus will result in overexcitation and seizures [19]. In our experiments, the DG in the rat hippocampus was specifically targeted for the NMDA infusion, as its cells hold more hyperpolarized resting membrane potential when compared to other regions. Such baseline hyperpolarization will produce higher contrast in the VSD redistribution mechanism when depolarization occurs. In the presence of NMDA infusion by reverse microdialysis, we quantified the change in extracellular glutamate concentration using forward microdialysis and high-performance liquid chromatography (HPLC). Each of the three modalities thus provided information with different degrees of specificity, including spatiotemporal specificity from fPA imaging, electrophysiologic specificity from qEEG and neurochemical specificity from microdialysis in the rat hippocampus.
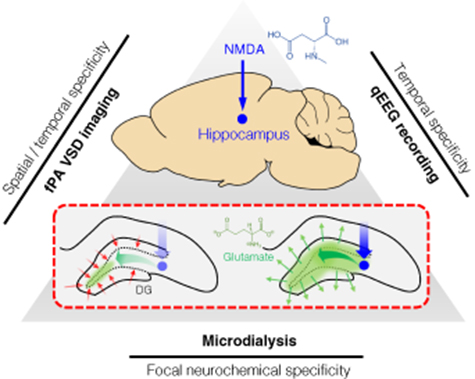
Figure 1. Tri-modal sensing of the rat hippocampus. The red dotted rectangle describes DG gating breakdown at hippocampus to a focal NMDA infusion.
Download figure:
Standard image High-resolution image2. Results
2.1. Transcranial fPA neuroimaging of the rat hippocampus
Transcranial fPA imaging of neural circuit dynamics was performed during NMDA infusion into the rat hippocampus (figure 2). The representative fPA sagittal planes obtained at 790 nm presented a sufficient sensitivity at the depths of interest, i.e. 3.6 mm, at a contralateral position to the microdialysis probe (figure 3(a)). The sagittal PA imaging plane of the hippocampus revealed the cross-sections of the transverse sinus and inferior cerebral vein in the superficial depth range (figure 3(b)). From the temporal dimension, time-averaged VSD responses were reconstructed pixel-by-pixel for the pre-injection phase (−10 to 0 min) followed by the results for time bins in 10 min intervals: 0–10 min, 10–20 min and 20–30 min. The total recording duration (40 min) was limited by the internal memory of the fPA neuroimaging system. Figure 3(c) shows the representative VSD responses in the rat hippocampus collected during 0.3 mm and 3.0 mm NMDA infusion. Note that the fPA VSD responses at the regions-of-interest (ROIs blue circles in figure 3(c)) represent the NMDA-evoked electrophysiological activity within the DG circuit in the rat hippocampus before being filtered by the DG gating function. As a result, the VSD responses averaged in each NMDA acquisition phase (−10 to 0 min, 0–20 min, 20–30 min) demonstrated a positive correlation to the range of extracellular glutamate concentration with distinct doses of focal NMDA infusion, i.e. 0.3 mm (n = 6) and 3 mm (n = 3) (figure 5). In addition, in the 3.0 mm NMDA infusion group, the averaged VSD responses were consistently maximized within the first 20 min of NMDA infusion, and their intensities corresponded well to the extracellular glutamate concentration measured in the forward microdialysis (figure S1 (stacks.iop.org/JNE/17/025001/mmedia)). Further comprehensive and quantitative analysis will be given in section 2.4.

Figure 2. In vivo experimental protocol. Tri-modal monitoring of the rat hippocampus using reverse/forward microdialysis, transcranial PA imaging and qEEG. ACF, artificial cerebrospinal fluid.
Download figure:
Standard image High-resolution image
Figure 3. Transcranial PA neuroimaging of the hippocampal circuit dynamics following focal NMDA infusion. (a) Illustration of stereotaxic coordinates for the microdialysis probe and sagittal cross-sections for real-time PA recording. (b) The sagittal PA imaging plane was selected in the contralateral side of the microdialysis probe infusing NMDA into the brain (3 mm lateral). (c) Time-averaged VSD response maps during −10 to 0 min (baseline phase), 0–10 min, 10–20 min and 20–30 min (NMDA infusion phases). Note that the blue points indicate the microdialysis probe in contra-lateral positions. Maximal glutamate concentration increases for representative fPA images were 34.23% (left), 734.48% (center) and 493.91% (right).
Download figure:
Standard image High-resolution image2.2. NMDA-evoked glutamatergic neurotransmission
Intrahippocampal infusion of NMDA diluted into artificial cerebrospinal fluid at the required concentrations was delivered through the microdialysis probe. Concentrations of glutamate release in the dialysate were calculated from the values of three baseline samples collected at 20 min intervals before NMDA infusion. During infusion into the hippocampus (bregma −3.8 mm, lateral 3.0 mm, depth 3.6 mm; figure 4(a)), samples continued to be collected every 20 min for the remainder of the study. Glutamate release was calculated as a percentage of basal values. Figure 4(b) shows the effect of NMDA infusion on glutamate release in the hippocampus of anesthetized rats. The results demonstrate the dose-related response of NMDA infusion at 0.3 (n = 3), 1.0 (n = 1) and 3.0 mm (n = 6) into the hippocampus, where 0.3 mm NMDA caused a 17.93 ± 19.05% increase in glutamate levels that remained elevated for the duration of the infusion; the 1.0 mm NMDA infusion caused doubling of the glutamate levels in the hippocampus compared to baseline (i.e. 112.42%). The increase observed at the 1.0 mm dose remained elevated to the end of the NMDA infusion. At the 3.0 mm dose, the NMDA infusion raised the glutamate level up to 392.99 ± 250.54% above the baseline level, which peaked during the second 20 min sampling period.
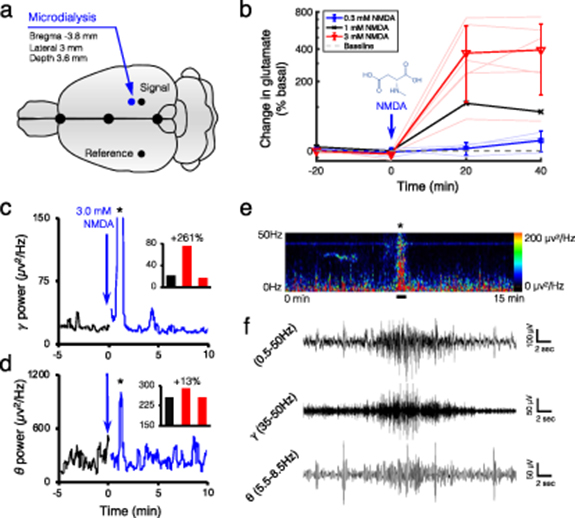
Figure 4. Extracellular glutamate concentration and concomitant electrophysiology during NMDA-evoked activity in the hippocampus. (a) Illustrates stereotaxic coordinates for the microdialysis probe and recording leads. The ground electrode was implanted over the rostrum. (b) 0.3 (n = 3), 1.0 (n = 1) and 3.0 mm (n = 6) NMDA infusion into the hippocampus caused maximal glutamate increases of 17.93 ± 19.05%, 112.42% and 392.99 ± 250.54%, respectively, compared to the baseline. The gray dotted line indicates the baseline. (c) Gamma (35–50 Hz) power shows a 5 min baseline recording (black trace), followed by two consecutive 5 min traces (blue trace) following focal NMDA infusion in the hippocampus. EEG demonstrated a 261% increase in gamma power, compared to the baseline, and an onset of epileptiform discharges after focal NMDA infusion (see the inset bar graph; the asterisk denotes epileptiform activity). (d) The respective theta power after NMDA infusion represents the theta component of the focal seizure. (e) The 15 min spectral power heat map demonstrates the spectral power changes associated with NMDA infusion and subsequent epileptiform activity (denoted by the black asterisk in (e)). (f) The representative raw EEG trace during the occurrence of the epileptiform event (the solid black line in (e)) for full (0.5–50 Hz), gamma (0.5–50 Hz) and theta (5.5–8.5 Hz) power; respectively. For the expanded time scale of the focal hippocampal seizure see figure S13.
Download figure:
Standard image High-resolution image2.3. EEG of electrophysiological activity in the hippocampus
Hippocampal infusion of 3.0 mm NMDA induced a significant increase in extracellular glutamate concentration, which correlated with fPA VSD responses, suggesting a potential break in the DG gate and synchronized DG firing that may lead to acute seizure activity. We therefore utilized qEEG during the same hippocampal 3.0 mm NMDA infusion protocol to identify if the maximal VSD response and extracellular glutamate concentrations were associated with significant electrophysiological activity resulting from the breakdown of the DG gate and synchronous DG firing resulting in seizure onset. The DG is a hippocampal region specifically subjected to a barrage of excitatory inputs. However, the majority of excitatory activity does not propagate through the DG and into the hippocampus as the DG performs a gating function. Otherwise, excessive activation of the DG disrupts its gating function and induces acute seizures in naïve animals [19].
In patients with focal epilepsy, gamma and theta activity from scalp EEG are indicators of seizure onset zone and ictal onset [20, 21]. Here, the temporal specificity of qEEG recorded circuit responses in real-time, before and after focal NMDA infusion. The 3.0 mm NMDA infusion into the hippocampal circuit induced focal seizure activity recorded by qEEG (figure 4(c), black asterisk, and figure S2). When NMDA was delivered to the hippocampal circuit by the microdialysis probe (figure 4(a)) [22], a significant change in qEEG spectral power was detected, particularly in the gamma range (figure 4(c)). In the theta range, spectral power increased during the seizure (figure 4(d)), further supporting the identification of focal seizure activity. The seizure trace measured by EEG demonstrated both a gamma and theta component (figure 4(f)). The dose-related VSD and extracellular glutamate concentration response, along with the qEEG findings, suggest that the 3.0 mm NMDA infusion resulted in a break in the DG gate associated with focal seizure activity that can propagate to other cortical regions.
However, qEEG lacks spatial resolution, and recordings from deep brain structures cannot be isolated without implantation of invasive depth electrodes. Therefore, in order to maintain the tri-modal experimental paradigm, we opted not to place depth electrodes. We made the stimulation focal, according to the previous proof-of-concept results using fPA for detection of the onset of generalized seizures through an intact skull and scalp [18].
2.4. Quantitative multi-modal correlation
The fPA VSD responses at the contralateral side to the microdialysis probe (blue circlesin figure 3(c)) were measured and plotted as a function of the corresponding changes in extracellular glutamate concentration (figure 5). Note that the ROIs to quantify the VSD responses were in 1 × 1 mm2 size in the sagittal cross-sections of rat hippocampus. The reference phase for VSD response quantification was obtained from the baseline phase, 5–10 min. In fPA imaging, 3.0 mm NMDA infusion into the hippocampus yielded significant elevation of VSD response: 0.08 ± 0.35, 2.24 ± 1.06 and 1.17 ± 1.56 for the baseline (−10 to 0 min), NMDA1 (0–20 min) and NMDA2 (20–30 min) phases, respectively (figure S1(a)). The increase in glutamate concentration was correspondingly elevated from −4.67 ± 4.48%, 369.75 ± 254.91%, to 392.99 ± 250.54%. In addition, when re-analyzing the data for −50% to 100%, 100%–500% and 500%–1000% bins of fractional glutamate concentration change, a high positive correlation was obtained with VSD responses: 0.38 ± 0.55 (nsample = 9), 0.97 ± 1.40 (nsample = 5) and 3.17 ± 0.32 (nsample = 4) for 11.04 ± 29.60%, 279.85 ± 141.64% and 666.49 ± 73.63% of glutamate concentration changes (red lines in figure 5). The goodness of fit (R2) among the mean values was 0.95 with the slope and y-intercept at 0.12 and 0.00, respectively. The qEEG revealed increased bursts of gamma power during 3.0 mm NMDA infusion, reaching up to a ∼261% increase with a focal seizure, which indicates a breakdown of the DG gate with the glutamatergic excitation induced (figures 4(c) and S1). In contrast, focal 0.3 mm NMDA infusion into the hippocampus did not produce any statistically significant increase in circuit activity. The VSD responses were −0.11 ± 0.02, −0.15 ± 1.71 and −0.07 ± 0.64 in the baseline, NMDA1 and NMDA2 phases, respectively, while the corresponding glutamate concentration changes in the hippocampus were −1.65 ± 6.90%, 3.90 ± 10.41% and 17.93 ± 19.05% (figure S1(b)). However, even in this case, the VSD responses presented a strong positive correlation with fractional glutamate concentration changes when re-analyzed in −10% to 0%, 0%–10% and 10%–50% bins (blue lines in figure 5): −1.00 ± 1.00, 0.10 ± 0.35 and 0.58 ± 0.48 (nsample = 3 for each) with −6.84 ± 3.38%, 4.43 ± 4.05% and 22.59 ± 11.64% of fractional glutamate concentration changes, respectively. R2 was 0.88 with the slope and y-intercept at 0.05 and −0.46, respectively. Therefore, the fPA VSD neuroimaging revealed a positive correlation with focal glutamatergic excitation in the rat hippocampus.
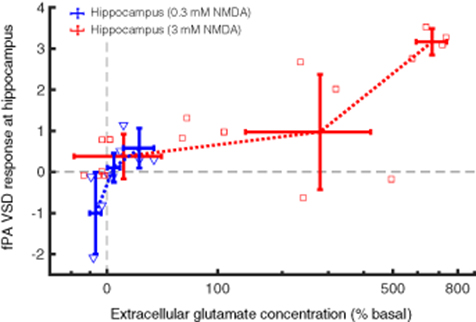
Figure 5. The fPA VSD response at the hippocampus as a function of extracellular glutamate concentration change. Grey dotted lines indicate the basal level in the fPA VSD response and extracellular glutamate concentration.
Download figure:
Standard image High-resolution image2.5. Brain histology
Brains were extracted after all in vivo experimental protocols. The brain was frozen-sectioned into slices of 300 µm thickness and evaluated to confirm probe placement using the scar caused by the microdialysis probe insertion for the NMDA infusion and collections as a marker. Figure 6(a) shows the bright-field images of the coronal plane of the hippocampus at −3.8 mm from the bregma, respectively. White arrows indicate the lesion caused by the microdialysis probe positioned at the following coordinates in the hippocampus: bregma −3.8 mm, lateral 3 mm, and depth 3.6 mm. The VSD staining of the brain tissue was confirmed with near-infrared fluorescence microscopy. Uniform VSD fluorescence was found in the VSD perfusion animal, while the negative control (VSD–) presented negligible fluorescence emission (figure 6(b)), which again confirms the results in our previous publication [23].

Figure 6. Histopathological confirmation. (a) Microdialysis probe at the hippocampus. The white arrow indicates the wound caused by microdialysis probe installation. (b) Frozen-sectioning histopathological confirmation of systematic VSD delivery throughout the brain tissue region.
Download figure:
Standard image High-resolution image
3. Discussion
The application of fPA neuroimaging has expanded into neuroscience [24–26] as label-free transcranial fPA imaging of neurovascular coupling has been proposed as a means to quantify hemodynamic changes in cortical/subcortical structures in either anesthetized or freely-moving rodents [27–31]. However, this approach does not yield quantitative neural activities that directly correspond to electrical activity. Hemoglobin provides an effective contrast signal in fPA neuroimaging, but the neurovascular coupling in the brain is comparatively slow compared to electrophysiological communication between neurons. Instead, there has been extensive investigation into more effective exogenous contrast agents [32–36]. This strategy has enabled several neuroimaging approaches with functional voltage sensors. Deaén-Ben et al showed real-time PA tomography using a genetically encoded calcium indicator, GCaMP5G, in zebrafish in vivo [37]. Roberts et al also proposed a new metallochromic calcium sensor for PA imaging (CaSPA) which has a high extinction coefficient, a low quantum yield, and high photo-bleaching resistance for brain and heart imaging [38]. Ruo et al reported PA imaging of neural activity evoked by electrical stimulation and 4-aminopyridine-induced epileptic seizures using hydrophobic anions such as dipicrylamine (DPA) in the mouse brain [39]. However, these voltage sensors require PA imaging in the visible spectral range (488 nm and 530 nm for GCaMP5G; 550 nm for CaSPA; 500 nm and 570 nm for DPA), which is suboptimal when imaging deep brain structures such as the hippocampus, positioned at a 5–8 mm depth when including the intact scalp and cortex of the rat [22, 40].
Recently, we proposed transcranial fPA recordings of brain activity in vivo with a near-infrared VSD, delivered through the blood–brain barrier via pharmacological modulation, as a promising tool to transcend optical neuroimaging limitations, particularly as it relates to sensing depth [18, 23, 41]. Our previous studies demonstrated that transcranial fPA neuroimaging distinguishes in vivo seizure activity in stimulated rat brains from that of control groups in real time. However, the results were limited by the use of a global chemo-convulsant, causing perturbation across the entire brain, after IP administration of penetylenetetrazole. In this paper, we present follow-up advances in fPA VSD neuroimaging by focal neural stimulation of heterogeneous neural circuits, with concomitant validations from qEEG and glutamate quantification using microdialysis. The set of experiments described here yielded key findings as follows. (1) The microdialysis-dependent low- and high-dose NMDA infusion into the central nervous system led to a wide range of focal extracellular glutamate increases in the hippocampus up to ~800% above baseline values. (2) The neurochemical response (microdialysis) was well-correlated to the changes in electrophysiological activity as measured by qEEG. The glutamatergic excitation evoked by high-dose NMDA was sufficient to cause a focal seizure in the hippocampal circuit, implying the disruption of the DG gating. These results show that a wide range of neural excitation can be obtained from the NMDA infusion scheme. (3) Transcranial fPA neuroimaging data successfully identified hot spots of focal NMDA receptor activation. The hippocampal circuitry provided the proportional excitation of glutamatergic neurotransmission with concomitant NMDA infusion.
Further investigations are required to advance our current understandingwith tri-modal sensing, including fPA, qEEG and microdialysis. Glutamate produces fast-rising brief depolarizations in pyramidal neurons. Therefore, the use of fPA neuroimaging will enable us to more precisely assess glutamate and GABA dynamics in order to formulate a more complete profile of circuit activation. Once homeostasis is disrupted, neuronal activity is sensitive to changes of both excitatory and inhibitory mechanisms. Faster neurochemical recording is another approach that may prove useful in assessing the impact of these measures. Although microdialysis successfully provided quantitative focal neurochemical concentrations, the sampling rate of 1 sample per 20 min was slow. Techniques offering faster temporal resolution may allow more meaningful comparison of the neurochemical changes yielded by microdialysis and the electrophysiological events monitored by qEEG and fPA neuroimaging [42]. One such technique, using custom built hardware and the Amplex Red method, achieved fluorescence-based quantification of glutamate from samples taken every 5 s, although the reliability appeared to be limited when higher glutamate concentrations were measured [43]. Implantable glutamate biosensors allow sub-second readouts of neurochemical concentrations. However, current limitations include sensitivity, selectivity and high cost. Recent developments in materials, effective modeling and sensor design may soon alleviate some of these limitations [44, 45].
From the results, transcranial fPA neuroimaging was able to differentiate the circuit activity defined with qEEG and microdialysis. However, future developments should serve to further advance the efficacy of the fPA neuroimaging in neuroscience. (1) We expect that improved signal processing for extracting neural activity from background vascular interference will enable better characterization of brain function. The present in vivo experiments confirmed the possibility of background suppression, as also presented in our previous study [18]. Enhanced signal processing and/or the use of multi-spectral wavelengths may allow significantly improved spectral differentiation of electrophysiological activities in the brain at higher temporal resolution, leading to the development of novel quantitative metrics for brain activity measures. It will also improve the temporal resolution by reducing the frame averaging that has been needed to secure signal sensitivity. (2) We are also working on the advancement of the VSD technology. The criteria for the chemical improvement would be better absorbance, faster transmembrane redistribution kinetics and contrast resolution to membrane potential variation, which will improve both VSD signal sensitivity and temporal resolution [41]. (3) Having isotropic resolution with 2D PA probes would be another interesting direction to pursue as a follow up to the present work. The use of a 2D PA probe would not only allow real-time volumetric information, but also enable the suppression of off-axis interference. Even though we demonstrated that neural activity can be successfully discerned with our current 1D PA probe, its sensitivity might be affected by off-axis interferences, particularly from the elevation direction because of the limited acoustic lens focusing at a fixed depth. Neuroimaging using a 2D PA probe would limit such interference due to its advanced electrical beam-forming capability in the axial, lateral and elevation directions. (4) Having an improved PA imaging system would provide a significant breakthrough in terms of spatiotemporal resolution in fPA neuroimaging. Even though our current laser system yields both 4 frames-per-second (fps) of temporal resolution and PA signal sensitivity in the rat hippocampus, further optimization of temporal resolution would provide finer spatiotemporal specificity. In addition, we are considering employing larger animal models for this fPA VSD neuroimaging research. Pigs are an ideal subject to pave the way to human translation of neuroengineering technologies, given their analogous brain structure and physiology, and similarity in scalp and skull thicknesses to those in humans [46]. We already validated the transcranial fPA neuroimaging in the pig model, and will continue to pursue this research direction [47].
Overall, the transcranial fPA neuroimaging in the hippocampus in an in vivo rat brain was successfully correlated with electrophysiologic and neurochemical measurements using qEEG and microdialysis. Focal NMDA infusion triggers glutamate release that excites the neural circuit, and at suprathreshold doses it causes runaway excitation in the hippocampus by overcoming DG gating. This is reflected in the lower seizure threshold of the hippocampus. Therefore, the transcranial fPA neuroimaging is a promising technology for the visualization of focal neural events in real time.
4. Materials and methods
4.1. Animal preparation
For theproposed in vivo experiments, 8–9-week-old male Sprague Dawley rats (Charles Rivers Laboratories, Wilmington, MA, USA) weighing 275–390 g were used. The use of animals for the proposed experimental protocol was approved by the Institutional Animal Care and Use Committee of Johns Hopkins Medical Institute (RA16M225). Rats were housed in groups of three per cage with free access to food and water, and maintained on a 12 hr light/12 hr dark cycle.
On the day of the study, rats were weighed and anesthetized with urethane (1.2 mg/kg). Urethane was given incrementally with alternating IP and subcutaneous (SC) dosing. Three (3) ml of isotonic saline was given SC on each side of the body to keep the animal hydrated during the experimental procedure. Body temperature was maintained until the animal was fully anesthetized and ready for surgery. For fPA and qEEG studies, an intravenous (IV) catheter was inserted into a tail vein prior to dye administration during the studies. Once a stable plane of anesthesia was established, hair was shaved from the scalp of each rat to allow acoustic coupling for transcranial fPA recording. The rat was placed into a stereotaxic device (Stoeling Co., Wood Dale, IL, USA). This fixation procedure was required to determine the coordinates of microdialysis probe implantation and for preventing any unpredictable movements during fPA or EEG recording of neural activities. A CMA12 microdialysis probe (Harvard Apparatus, Holliston, MA, USA) was implanted into the CA3 region of the right hippocampus (stereotaxic coordinates: 3 mm lateral and 3.8 mm posterior to the bregma, and 3.6 mm below the surface of the dura, figure 3(a)) [22]. The probe active exchange surface was 2 × 0.5 mm. The probe was secured to the skull using dental acrylic cement. The fPA and qEEG probes were placed on the contralateral side of the microdialysis probe.
4.2. Fluorescence quenching-based near-infrared voltage-sensitive dye
In the present in vivo study, we used the fluorescence quenching-based near-infrared cyanine VSD, IR780 perchlorate (576 409, Sigma-Aldrich Chemicals, St Louis, MO, USA) as used in our previous in vivo study investigating chemo-convulsant seizure activity [18], and it has an analogous chemical structure to PAVSD800-2, our new VSD validated in our previous in vitro study [41]. This VSD yields fluorescence quenching and de-quenching depending on membrane polarization and subsequent changes in the local VSD molecule density, leading to a reciprocal change of PA contrast with non-radiative relaxation of absorbed energy.
4.3. Functional fPA neuroimaging
We used real-time PA data acquisition to record electrophysiological neural activities in vivo as in our previous study [18]. The ultrasound research system consisted of an ultrasound linear array transducer connected to a real-time data acquisition system (SonixDAQ, Ultrasonix Medical Corp., Canada). To induce the PA signals, pulsed laser light generated by a second-harmonic (532 nm) Nd:YAG laser pumping an optical parametric oscillator system (Phocus Inline, Opotek Inc., USA) provided 690–900 nm of tunable wavelength range and 20 Hz of the maximum pulse repetition frequency. A bifurcated fiber optic bundle, each branch 40 mm long and 0.88 mm wide, was used for laser pulse delivery. The PA probe was situated between the outlets of the bifurcated fiber optic bundles using a customized 3D printed shell for evenly distributing laser energy density in the imaging field-of-view. The alignment of outlets was focused specifically at 20 mm depth. The PA probe was positioned in the sagittal plane contralateral to the microdialysis probe (3 mm) to cover the hippocampal cross-section. The distance between the PA probe and the rat skin surface was 20 mm filled with acoustic gel, and the resultant energy density was at ~3.5 mJ cm−2, which is far below the maximum permissible exposure of skin to laser radiation by the ANSI safety standards [48]. A wavelength of 790 nm was used, at which sufficient absorbance can be obtained by the near-infrared VSD, i.e. IR780 perchlorate. Also, excitation at that wavelength prevented the undesired time-variant change of blood oxygen saturation, since the wavelength corresponds to the isosbestic point of the Hb and HbO2 absorption spectra. Detailed information on neural activity reconstruction using normalized time-frequency analysis can be found in our previous publication [18].
4.4. In vivo microdialysis
In vivo microdialysis sampling was carried out as previously described [49, 50]. For infusion experiments, NMDA (Sigma-Aldrich Chemicals) was weighed, solubilized and diluted to the desired concentration in artificial cerebrospinal fluid (NaCl, 147 mmol l−1; KCl, 2.7 mmol l−1; CaCl2, 1.2 mmol l−1; MgCl2, 0.85 mmol l−1) (Harvard Apparatus) on the study day. Once the probe was inserted and secured, it was perfused with artificial cerebrospinal fluid pumped at a flow rate of 2 μl/min. Samples were collected at 20 min intervals, and immediately transferred to a −80 °C freezer until they were assayed. To allow sufficient time for the glutamate levels to equilibrate, three baseline samples were collected an hour after the initiation of infusion. Following collection of these samples, NMDA was infused into the brain directly through the dialysis probe with the same pump parameters as used for the baseline samples. Dialysate samples were assayed for glutamate by a two-step process using HPLC-ECD on an Eicom HTEC-500 system (EICOM, San Diego, CA, USA). After passing the samples through a separation column, they were processed via a column containing immobilized L-glutamate oxidase enzyme, resulting in the release of hydrogen peroxide. The hydrogen peroxide concentration was then determined using a platinum working electrode. Chromatographic data were acquired online and exported to an Envision software system (EICOM) for peak amplification, integration and analysis.
Our method of reverse microdialysis exerts effects that are largely mediated via the DG circuit in the rat hippocampus, since our results agree with those of Ludvig et al [51] who used similar methods to evoke hippocampal seizures. Our microdialysis probes have an active surface of 2.0 × 0.5 mm, and most evidence suggests a 1 mm cylinder of influence around the probe for substances that are reverse dialyzed into the neuropil [52]. It is important to note that the 3 mm concentration of NMDA in the dialysis perfusion solution is not the concentration of NMDA reaching the brain tissue. Perfusion flowrate, probe membrane characteristics and tissue properties serve to limit the penetrance of reverse dialyzed substances into the brain [53]. Ludvig et al addressed this issue previously and showed that the biophase concentration of reverse dialyzed NMDA is about 15% of the source concentration. Thus, the NMDA concentrations reaching the brain tissue in our experiments probably ranged from 0.045–0.45 mm. Another possibility to consider is that infused NMDA is taken up into cells surrounding the probe, thereby keeping biophase concentrations low. Bruhn et al demonstrated that radiolabeled D-aspartate reverse dialyzed into the rat brain is rapidly and effectively extracted from the extracellular fluid by glutamate transport mechanisms [54]. Collectively, this information suggests that the neurochemical, EEG and fPA endpoints that we measured in response to reverse dialyzed NMDA reflect changes localized to the hippocampus.
4.5. Quantitative EEG
All EEG recordings utilized a three-electrode paradigm: one recording, one reference (aligned to the site of activation) and one ground over the rostrum. The electrodes (IVES EEG; Model # SWE-L25-IVES, EEG Solutions, MA, USA) were fixed with minimal cyanoacrylate adhesive (KrazyGlue), similar to previous protocols [55]. Data acquisition was performed using Sirenia software (Pinnacle Technologies Inc., Kansas, USA) with synchronous video capture. The data acquisition had a 14 bit resolution, 400 Hz sampling rate, and a band pass filter between 0.5 Hz and 50 Hz. The acquisition files were stored in an .EDF format and scored manually, using real-time annotations from the experiments. EEG power for two second epochs was achieved using an automated fast Fourier transformation module in Sirenia software [56].
4.6. In vivo experimental protocol
The in vivo protocols were designed for simultaneous multi-modal sensing of the neural activity in the hippocampus: microdialysis—qEEG and microdialysis—fPA neuroimaging. Figure 2 shows a detailed schematic protocol for each group representing the response to the administration of NMDA, Lexiscan and VSD (i.e. IR780 perchlorate). fPA and qEEG data acquisition were performed for 40 min to correlate with three microdialysis samples collected at 20 min intervals. Graded NMDA infusion concentrations were applied to identify the dose-dependent glutamatergic excitation of hippocampal circuit: 0.3 mm (n = 3) and 3.0 mm (n = 6). VSD and Lexiscan followed the data acquisition sequence with a 3 min delay, thereby 5 min of baseline phase was guaranteed for the VSD response reconstruction in fPA neuroimaging before starting NMDA infusion. The dosing protocol for Lexiscan and VSD administration was as follows: through an IV tail vein catheter, 150 µl of Lexiscan (0.4 mg/5 ml) was injected, followed by 200 µl of VSD at 2 mg ml−1 concentration, flushed immediately with 150 µl of 0.9% isotonic saline. The EEG signal was recorded separately in an identical preparation procedure as the fPA neuroimaging, including animal preparation and administration of IR780, Lexiscan and experimental duration time for all recordings.
4.7. Brain histology
The rats used for the above protocol were euthanized, and the whole brains immediately harvested and placed in 10% formalin. All brains were allowed to fix in fresh 10% formalin for at least 48 h with gentle agitation on a conical rotator. Subsequently, the brains were processed through a series of sucrose gradients (15%, 20%, 30% for 12–24 h each) for cryoprotection. Brains were sectioned frozen with 300 µm thickness. Tissue sections were mounted on slides in ProLong Diamond Anti-face mountant. Slides with sections were imaged using an Olympus OM-D E-M5 Mark II for bright field imaging and using LI-COR Odyssey for fluorescence visualization.
Acknowledgments
This work was supported by the NIH BRAIN Initiative under Grant No. R24MH106083-03 (DFW, AR, AAG, EMB, HV, JE) and the NIH National Institute of Biomedical Imaging and Bioengineering (NIBIB) under Grant No. R01EB01963 (LML); NIH National Institute of Child Health and Human Development (NICHD) for R01HD090884 (SDK); NIH National Institute on Drug Abuse (NIDA) Intramural Research Program (IRP) under Grant No. DA00522 (MHB); NIH National Institute of Heart, Lung and Blood (NHLBI) under Grant No. R01HL139543 (Jeeun K, APM, EMB); National Cancer Institute (NCI) under grant number R21CA202199 and its equipment supplement (EMB). Funding of the PA equipment was provided via resources of Jin K and EMB NSF Career award #1653322. Jeeun K was partially supported by the Basic Science Research Program through the National Research Foundation of Korea (NRF) funded by the Ministry of Education #2018R1A6A3A03011551.
Conflict of interests
The subject matter described in this article is included in patent applications filed by the University of Connecticut and Johns Hopkins University. LML is a founder and owner of Potentiometric Probes LLC, which sells voltage sensitive dyes.
The remaining authors declare that the research was conducted in the absence of any commercial or financial relationships that could be construed as a potential conflict of interest.
Contributions
DFW, AAG and MHB originally conceived of the idea of NMDA administration and of microdialysis with PA and helped to design the overall research plan with initial funding for the in vivo experiments. DFW critically revised the focus of the results and final version and interpretation. EMB, LML and SDK helped to design the overall research plan, helped plan specific experiments, and all contributed to the review and writing of the manuscript. Jeeun K, SDK, JSE, BJS and HV planned and carried out the in vivo experiments, analyzed the research outcomes and wrote key elements of the first draft of the manuscript. Jeeun K analyzed and interpreted the PA measurements and completed the first manuscript, HV and JE carried out the NMDA dosing and microdialysis, and SDK and BS carried out the EEG experiments. MHB provided resources, personnel and advice for the microdialysis methods. HV and LML devised the VSD vehicle preparation. APM performed histopathological analysis. MMH planned and supervised confirmation of VSD penetration into brain tissue and also contributed to the final version of the manuscript. AG critically revised the experimental design, the draft and final versions of manuscript, and the interpretation of results. Jin K developed, funded and participated in the current PA system design. AR participated in early planning and critically read and edited the manuscript. He has contributed both technically and materially to support this research. EMB led the development, system specification, design specification and funding of the current PA imaging system, and secured the funding for the necessary imaging experiments throughout the lifetime of the project, including taking responsibility for two full-time research members specifically for this work, Jeeun K and APM. Further, he has contributed intellectually by mentoring these members and providing input on manuscripts, and participating in PI meetings.