

Abstract
Objective. Deep brain stimulation (DBS) of basal ganglia effectively tackles motor symptoms of movement disorders such as Tourette syndrome (TS). The precise location of target stimulation site determines the range of clinical outcome in DBS patients, and the occurrence of side-effects of DBS. DBS implant procedures currently localize stimulation target relying on a combination of pre-surgical imaging, standardized brain atlases and on-the-spot clinical tests. Here we show that temporal structure of single unit activity in subthalamic nucleus (STN) of patients affected by pure TS can contribute to identify the optimal target location of DBS. Approach. Neural activity was recorded at different depths within STN with microelectrodes during DBS implant surgery. Depth specific neural features were extracted and correlated with the optimal depth for tic control. Main results. We describe for the first time temporal spike patterns of single neurons from sensorimotor STN of anesthetized TS patients. A large fraction of units (31.2%) displayed intense bursting in the delta band (<4 Hz). The highest firing irregularity and hence the higher density of bursting units (42%) were found at the optimal spot for tic control. Discharge patterns irregularity and dominant oscillations frequency (but not firing rate) carried significant information on optimal target. Significance. We found single unit activity features in the STN of TS patients reliably associated to optimal DBS target site for tic control. In future works measures of firing irregularity could be integrated with current target localization methods leading to a more effective and safer DBS for TS patients.
Export citation and abstract BibTeX RIS
1. Introduction
Tourette syndrome (TS) is a neuropsychiatric disorder characterized by motor and vocal tics [1, 2]. In the last two decades, a number of studies associated TS tics to a dysfunctional interaction between the motor cortex and the basal ganglia (BG) stemming from an aberrant behavior of the latter [3–5].
The widely accepted hypothesis about the origin of tics in TS is that they might originate from an overactivation of the striatum, generating an excessive positive feedback towards motor cortical activity, leading to involuntary movements [4, 6, 7]. Support for this hypothesis derives from recordings in nonhuman [8] and human [9] primates showing a relationship between overactivity of the striatal region somatotopically associated with the tic-expressing body part and the probability of tics occurrence. Striatum overactivation can have different causes, as the reduction in the number of striatum interneurons or the functional disinhibition due to dopamine circuits' dysfunctions [10–12]. Nonhuman primates studies have shown that striatal disinhibition in turn leads to silencing of the internal globus pallidus (GPi), primary motor cortex overactivation and finally to abnormal movements [13–15]. Indeed, high frequency DBS of the GPi leads to a significant reduction in tics-related EMG amplitude in nonhuman primate models [16]. Limitations of this model are that it does not account for any relevant involvement of the subthalamic nucleus (STN) [5], and that it largely relies on animal experiments.
Treatment to ameliorate tics and behavioral disorders is often hard to be efficiently personalized [17, 18]. In pharmacologically-resistant and behavioral-refractory TS patients, however, basal ganglia or thalamic deep brain stimulation (DBS) emerged as a promising treatment [20–24]. DBS-driven modulation of thalamic and GPi oscillatory activity has been correlated to clinical outcome [23], but the effect of DBS stimulation of STN in TS patients has not been widely investigated [19, 24].
Localization of DBS target site is a key step of the implant procedure. Several techniques have been developed to identify STN location to deliver DBS for Parkinson's disease (PD) patients [25–28] usually combining imaging and micro-recordings [29]. However, the specific location of DBS electrodes within STN is also of high relevance, since the spread of the stimulation might cause unwanted side effects [30], e.g. impulse control disorders due to the proximity to limbic or associative STN areas [31]. Novel procedures have then been defined to identify STN macroareas [32, 33]. However, even targeting the right STN macroarea might not be sufficient to achieve the desired clinical results, since several studies have shown that STN displays a diverse internal dynamic according to depth [34, 35], and that the precise depth of the target site within areas might have clinical relevance [36, 37]. Recent works showed how the location of DBS electrodes could be optimized thanks to the spectral analysis of local field potentials (LFP) acquired from microrecordings, which can help in the selection the optimal implantation track [38], and in determining symptom-related STN subterritories [39].
In this study we find depth-specific features of STN neurons activity in pure-TS patients through the analysis of intraoperative microrecordings. We followed the approach of [38], reconstructing offline the optimal setting decided by surgeon during DBS electrodes implantation thanks to microrecordings data. In particular, the irregularity of firing patterns was found a posteriori to correlate with target sites achieving effective clinical improvements for TS patients.
2. Methods
2.1. Ethical approval
The study was approved by the Carlo Besta Institutional Ethics Committee (reference number 7/2014) and was carried out according to the Declaration of Helsinki. Informed written consent was obtained either from the patients or from their legal representative.
2.2. Subjects
We analyzed microrecordings from four TS patients undergoing DBS implant surgery. Inclusion criteria for the TS patients were based on current diagnostic criteria [1]: age > 18 years with a stable degree of severity and no spontaneous improvement of tics, a yale tic global severity scale (YTGSS) > 35/50 for at least 12 months (table 1), with tic severity documented by a standardized videotape assessment, inadequate response to standard drug treatment (medication or botulinum toxin). The following exclusion criteria were implemented: diagnosis of secondary tic disorder, cognitive or severe psychiatric abnormalities. Patients were enrolled for a phase II study on efficacy and safety of STN DBS in treating motor and phonic tics in medically refractory pure (motor)—TS patients (ClinicalTrials.gov ID: NCT02619084, research funded by the Italian National Institute of Health (NIH), GR-2009-1594645, PI L. Romito).
Table 1. Baseline characteristics of 4 TS patients. Mean ± SD given in the last row where appropriate.
| ID | Gender | Age at implant (Y) | Disease duration (Y) | YTGSS tic total score | YTGSS impairment score |
|---|---|---|---|---|---|
| 1 | F | 29 | 23 | 42 | 50 |
| 2 | M | 26 | 19 | 38 | 50 |
| 3 | F | 35 | 22 | 44 | 50 |
| 4 | M | 46 | 33 | 42 | 40 |
| Tot | 2F/2M | 34.0 ± 9 | 24.3 ± 6 | 41.5 ± 2.5 | 47.5 ± 5 |
We analyzed also the activity of two Parkinson's disease (PD) subjects with exactly the same procedure (see supplementary material) for a preliminary comparison between the structure of STN activity in the two movement disorders. All the analysis in the main text, unless otherwise stated, refers to TS patients.
2.3. Anesthesia and surgical procedure
Surgery was performed under Bispectral Index—Guided general anesthesia through target controlled infusion (TCI); Propofol was used for anesthesia induction, while anesthesia maintenance and microrecordings were performed under Remifentanil [40]; general anesthesia was mandatory due to the severe tic phenomenology of all patients. Bispectral index (BIS), a depth of anesthesia (DOA) monitor, provides an electroencephalography (EEG) correlation with human behavior in the course of general anesthesia surgeries. BIS value specifies the likelihood of consciousness, thus aiding the tailoring of anesthetic dosages to the individual patient. Anesthetics delivery was targeted to keep BIS values between 40 and 60 [41].
Surgery was always performed in stereotactic conditions with the Leksell (Elekta Inc., Atlanta GA, USA) frame. Computerized tomography (CT) was used to recognize the anterior and posterior commissures in the stereotactic space, after positioning of the Leksell-modified headframe. A probabilistic stereotactic digitalized atlas registered to the anterior commissure (AC)–posterior commissure (PC) line was utilized for the preliminary determination of the target coordinates. The stereotactic CT images were then merged with the preoperative magnetic resonance images (MR; T1 and fast spin echo inversion recovery sequences with double dose of contrast agent) and a second calculation of the target coordinates was performed with the neuronavigation system (Stealth Station Treon Sofamor Danek, Medtronic Inc. Minneapolis, MN, USA). Finally, the two set of data were matched, and the definitive coordinates, along with the planned trajectory, were adapted to the individual patient anatomy. A rigid cannula was then inserted through a small hand-drilled burr hole (5 mm diameter) and through the opened dura mater; the cannula was then indwelled till 15 mm above the estimated target. A high impedance microelectrode (250 lm tip, and impedance 1–1.5 MX; FHC Inc., Bowdoinham ME, USA) was then introduced within the cannula and advanced progressively to the target. Localizing criteria for the placement of the definitive electrode were based on raw inspection of microrecording features, and on the lack of pyramidal or oculomotor side-effects under test stimulation through semi-microlead (see supplementary figure 1 (stacks.iop.org/JNE/16/066011/mmedia)). If microrecordings fulfilled the localizing criteria, the definitive electrode (Leads Model 3389, Medtronic Inc. Minneapolis, MN, USA) was placed at the target through the same rigid cannula after the microelectrode withdrawal. Macrostimulation was then performed in bipolar configuration between the two proximal contacts and between the two distal contacts. At this stage of the procedure, clinical testing with macrostimulations and electromyographic (EMG) recording in the anesthetized patient allowed to define potentially stimulation side effects due to involvement of brain structures close to STN. If microrecordings, stimulations with microelectrodes, and macrostimulation through the definitive lead suggested its accurate placement at the right target, the lead was secured to the burr hole with fibrin glue and a titanium plate. Otherwise if microrecordings and/or clinical and EMG monitoring suggest a suboptimal electrode placement, a new trajectory was planned through the same burr hole. Each definitive implanted lead was finally connected to a Medtronic Activa® SC 37603 Neurostimulator through a Medtronic Model 37086 Extension.
The location of the electrodes was ascertained by Medtronic StealthStation TREON plus Navigation System. 3D anatomy of basal ganglia was adapted to the brain geometry of each patient by overlaying the pre-operative and postoperative MRI or computed tomography scan onto the software atlas. Active contacts location and the volume of activated tissue were estimated by using the contact(s) and the electrical parameters set when the patient had reached a stable clinical condition by using LEAD-DBS v2.1.8 (http://www.lead-dbs.org/) [28, 42].
Electrodes were considered as correctly positioned only if the electrode contacts, the electric field volumes around the stimulated contacts, or both, included the STN. These procedures were done by a neurosurgeon blinded to the results of neurostimulation in each patient. An overall description of the surgical procedure is represented in supplementary figure 1.
2.4. Electrophysiological recordings
Continuous physiological recordings began at 10 mm above the target and were performed by means of a Medtronic LeadpointTM system (Medtronic Inc., Minneapolis, MN, USA). An exploratory trajectory was made by extruding the microelectrode (250 lm tip, and impedance 1–1.5 MX; FHC Inc., Bowdoinham ME, USA). Microrecording tracks were performed with 0.5 mm steps, and up to 1\2 mm beyond the target along the single planned trajectory. Recordings lasted about 10 s for each individual depth. Signal were acquired at 24 kHz and high pass filtered with a hardware filter at 200 Hz to remove low frequencies and allow the visualization of firing activity during surgery.
2.5. Spikes detection and sorting
The signals were exported at 24 kHz and transformed into.mat files for off-line analysis with custom MATLAB (Mathworks) routines. For single unit analysis, every spiking period that was corrupted by noise or by spike amplitude instability that could affect the analysis was visually identified and discarded, i.e. a track was considered reliable if the noise period was below the 50% of the total length of the signal.
Spike detection and sorting were performed using MATLAB ToolBox Wave_Clus [43]. Briefly, the steps of spike detection and sorting were: (i) band-pass filtering the data between 300 and 3000 Hz using a zero-phase filter to avoid distortion in the spike waveforms [44]; (ii) computation of a double (positive and negative) detection threshold based on a robust estimate of the noise statistics; (iii) feature extraction of the spike shapes, using the wavelet transform; and (iv) clustering of the waveforms to identify the firing of the different units by means a modified k-means algorithm.
Every isolated unit was visually inspected and only the well separated ones were selected for further analysis. We used the following criteria [45]: more than 90% of the total area of the amplitude histogram had to be above the detection threshold; the mean waveform had to have a typical action potential shape, i.e. biphasic shape either with a positive or negative most prominent peak; the percentage of spikes occurring within 3 ms of each other had to be less than 1% and the number of spikes detected had to be more than 20.
2.6. Firing rate estimation
Firing rates of the neurons were estimated using the Gaussian Kernel bandwidth optimization method, a classical procedure for estimating the firing rate (FR). It has been shown [46] that the classical kernel methods accomplish well in the goodness-of-fit of the underlying rate and outperform competing methods in representing abrupt changes, i.e. non-stationarities, in the spike rate, which we often encounter in neuroscience. Note that visual inspection of our firing rate tracks assessed a global stationarity of the recordings but this does not rule out the presence of local not-stationarities like improvise abrupt changes in the strength of the firing rate. The kernel function  is a Gaussian function having as mean value the ith spike timestamp (ti), and as standard deviation the bandwidth w that is optimized minimizing a cost-function
  , according the following (1) and (2):
2.7. Discharge pattern analysis and burst detection
The firing regularity was quantified by fitting the inters-spike interval (ISI) distribution with a Gamma distribution (3) [47]

where I is the duration of a given ISI, λ and κ are the firing rate and scale factor, and  is the gamma function. The shape factor
  represents the firing regularity itself and it is estimated by the maximizing the likelihood, as follows (4):
where  and n are the digamma function and the number of ISIs respectively. Firing regularity
  takes a value of 0 (i.e. κ = 1) for a Poisson-like irregular spike train and becomes positive or negative if firings are more regular (κ > 1) or bursting (κ < 1), respectively. We used
  as a criterion to determine three distinct patterns: (i) for
  the neuron was automatically classified as tonic, (ii) for
  the neuron was automatically classified as bursting, (iii) for
  we used an additional criterion based on the firing rate profile: if > 70% of the samples was outside the range
  , indicating the presence of both very high and low firing rate, the neuron was classified as bursting, otherwise as irregular.
The rank surprise method [48] was used to identify a burst (intuitively, an occurrence of many spikes in a small time interval), in the spike train of the bursting labelled cells. This method has a structure similar to the Poisson method [49] and produces comparable results. Instead of assuming a Poisson ISI distribution, the rank surprise assigns a uniform probability to each ISI, based on its rank, and proposes a different statistic, the rank statistic (RS), to evaluate a burst. Two parameters are user-defined: the largest ISI allowed in a burst (limit), e.g. the third quartile as suggested in literature, and the minimum RS (threshold) that a burst must have to be considered valid. First, we search the spike train for all the ISIs that are smaller than limit and mark them. Then, we compute the RS value for every possible continuous sequence (time period) of marked ISIs and find the one with the largest RS. If this RS value is larger than the threshold, we denote a burst and remove the corresponding ISIs from the marked ones. Finally, we repeated the process for the remaining marked ISIs. Furthermore, we computed five different parameters of bursts: (i) the mean intra-burst frequency (IBF) as the number of the spikes within burst divided by the burst length (ii) the mean inter-burst interval (IBI) as the time interval between two consecutive bursts, (iii) the mean number of spikes within bursts (SWB), (iv) the proportion of spikes in bursts (SIB) during 10 s of the recording and (v) the coefficient of variation (CV) as the standard deviation of the IBI divided by its mean.
2.8. Oscillatory strength in neural activity
A method that relies on the estimation of the frequency spectrum from the normalized autocorrelation histogram (ACH) was used to investigate the neural oscillations at the single-neuron level [50]. This method is not computationally demanding, minimizes the false detection of oscillations and can be used even with single units. Briefly, the steps involved in this procedure are: (i) a fast Gaussian Kernel to smooth the ACH and to remove high frequency noise; (ii) a slow Gaussian Kernel to detect the boundaries of the ACH central peak; (iii) efficient removal of the central peak from the smoothed ACH; (iv) FFT of the peak-less smoothed ACH; (v) peak detection within the band of interest. Eventually, a parameter which quantifies the oscillation's strength called oscillation score  is computed as the ratio between the highest frequency magnitude within the band of interest and the baseline, e.g. the average, magnitude of the spectrum. To obtain a measure of the confidence on the oscillation score in a single-trial and few-samples context as our case, we defined 'reliable' oscillation scores that were greater a threshold determined by the mean
  and the standard deviation
  of the total spectrum, as follows (5):
Prevalence of units with significant oscillatory was then assessed for each of the following frequency bands: delta (1–4) Hz, theta (4–8) Hz, alpha (8–12) Hz, beta (12–30) Hz and gamma (30–100) Hz.
2.9. Statistical tests
JMP 14.0.1 software (SAS Institute Inc. Cary, US) and MATLAB R2017b (Mathworks, Natick, MA, USA) custom-written scripts were used for statistical analysis. Fisher-Exact test was used to examine the significance of the association in contingency tables categorical data. A Shapiro–Wilk test was used to determine if the datasets were normally distributed. None of our datasets passed the test substantial inasmuch as a prominent right skewness was present in almost all distributions. Therefore, non-parametric statistics (Mann–Whitney U) tests were used for comparisons of neural features and, unless otherwise noted, all group values of continuous variables were reported in the text as median ± half of the interquartile range (IQR). Linear regression and binning analysis were used to describe the relationship between neural features and depth. Pearson's correlation coefficient was used to examine the linearity of the relationship and R squared to quantify the variance explained by the linear model. Results were considered significant at P < 0.05.
2.10. Mutual information analysis
We computed the mutual information about the target depth carried by three neural features: (i) the presence of bursting neurons, (ii) the presence of oscillatory behaviors and (iii) the firing rate, using the Information Breakdown Toolbox in Matlab [51].
Mutual information between a set of neural features F and the set of depths D was given by (6) [52]:
where P(f ) and P(d) are the absolute probability across all neurons of observing respectively a value f of the feature F and a depth  , while P(f|d) is the conditional probability of observing the feature f in a neuron at depth d.
The set of depths was given by the relative target-depth of the neurons: above (more dorsal), on, and below (more ventral) the target position. We compared then the information carried by three different sets of neural activity features: (i) the firing rate (binned in three equipopulated regions), (ii) the presence of oscillations in the delta band (2: oscillatory in delta, 1: oscillatory in other frequency bands; 0: not-oscillatory), and (iii) the specific discharge pattern (tonic, irregular, bursting, see above). We tackled the information bias due to the small data set [53] with the following precautions: (i) we limited the number of bins of the neural features to three to ensure a conservative but stable measure of information [54]; (ii) we applied the Panzeri–Treves bias correction [55] and (iii) we compared the resulting values of information with those obtained with 500 bootstrap repetitions using P < 0.05 as an information significance threshold.
3. Results
3.1. DBS procedures and clinical outcomes
This work aims at offering a detailed characterization of the spatio-temporal structure of STN firing dynamics in subjects affected by TS to the purpose of optimizing the localization of DBS target site. Four pure-TS [56] patients (2M/2F, age at implant 34.0 years, range 26–46) underwent bilateral STN implant (Medtronic 3389 lead, Activa SC pulse generator) in general anesthesia at the Carlo Besta Neurological Institute (table 1). Microelectrode exploratory recordings were performed at different depths with 0.5 mm steps to determine the optimal target location for DBS (figure 1 and table 2, Methods for details). In all patients, an important subthalamotomic-like improvement of motor and phonic tics was observed soon after the implant and lasted on average 4.5 ± 2.4 d, likely due to the shunting effect [57, 58]. No dyskinesia was detected during this period. In the days and weeks after the clearing of this effect, we started the programming sessions. Initial DBS parameters were set as monopolar, 0–3 Volts (0.1 V steps), 125 Hz, 60 µs stimulation, starting with the ventral-most contact and then preceding towards the dorsal-most contact. In all patients, a sustained acute tic improvement was observed following stimulation of STN-located contacts, even at low stimulation current (average 0.6 ± 0.4 mA) (figure 2, Wilcoxon signed rank test, P < .001). A complete clinical analysis of the improvements of the clinical parameters is currently ongoing (Vissani et al in preparation, [59]).
Table 2. Stereotactic coordinates of active contacts from the post-operative CT-MRI fusion (TS patients). Brain localization is classified as STN sensory-motor (SM), associative (AS), Forel's field H2 (H2) or mesencephalic reticular formation (MRF).
| Contacs stereotactic coordinates [mm] | Brain localization | AC-PC (mm) | |||
|---|---|---|---|---|---|
| Left (x, y , z) | Right (x, y , z) | Left | Right | ||
| ID1 | 25.38 | ||||
| Contact 1 | (8.3, 1.4, −4.6) | (9.9, −2.3, −5.2) | STN-SM | STN-SM | |
| Contact 2 | (9.1, 0.4, −3.9) | (10.3, −2.0, −3.5) | STN-SM/H2 | STN-SM/H2 | |
| ID2 | 26.5 | ||||
| Contact 0 | — | (9.7, 0.0, −2.5) | STN-SM | ||
| Contact 2 | (10.3, 0.0, −4.8) | — | STN-SM/STN-AS | ||
| Contact 3 | (12.26, 0.4, 2.9) | — | STN-SM | ||
| ID3 | 23.55 | ||||
| Contact 2 | (10.4, 1.6, −7.9) | (10.7, 0.6, −5.5) | STN-AS/STN-SM | STN-SM | |
| Contact 3 | (11.1, 2.9, −6.2) | (11.4, 1.8, −3.7) | STN-SM | STN-SM | |
| ID4 | 26.83 | ||||
| Contact 0 | (10.8, −1.3, −5.9) | (13.6, 0.1, −1.2) | STN-AS/STN-SM | MRF/STN-AS | |
| Contact 1 | (11.2, −1.1, −4.1) | (15.0, 0.2, 0.2) | STN-SM | STN-AS/STN-SM | |

Figure 1. Surgical targeting and electrode placement (reconstructed using Lead-DBS v2.1.8). (a) Group analysis showing the 3D location of leads and stimulating contacts (in red) in all four TS patients. Color codes: dark orange, sensorimotor STN; light cyan, associative STN; light yellow, limbic. Three panels correspond to different view angles. (b) Reconstruction of electrode positioning (Contact 1 and 2) in patient 1 according to functional STN subdivision. Top: Left hemisphere. Bottom: Right hemisphere.
Download figure:
Standard image High-resolution image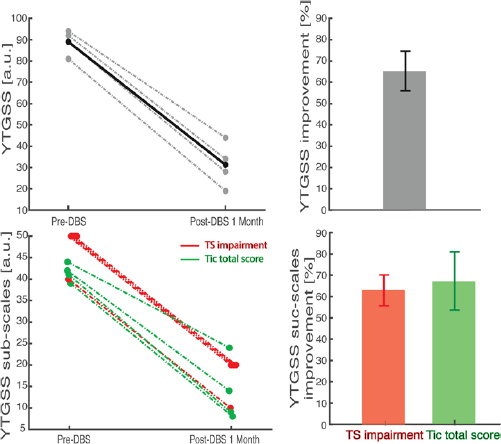
Figure 2. One-month post-operative outcome in absolute (left) and relative (right) terms. Top: overall YTGSS. Bottom: impairment subscale (red) and tic subscales (green).
Download figure:
Standard image High-resolution imageHowever, these preliminary results already prove that the DBS location selected within STN was highly effective. We investigated then which features of the microrecordings were associated to the target sites that led to such clinical improvement.
3.2. Diversity of discharge patterns in STN
We identified in all recordings the activity of individual neurons (see section E of Methods for details). The size of the set of neurons identified across the four TS patients was 32 (±9), in the range 19–45, for a total of n = 125 neurons. Median firing rate was  spikes s−1. Visual inspection indicated profound differences between spiking patterns at different depths (figure 3) and we focused then on the temporal structure of the neural activity. We tested whether bursting regime was prevalent in TS by means of the analysis of the ISI distribution. These distributions were fit with gamma functions, and the level of regularity and hence the presence of bursts were estimated through
  , i.e. the shape factor of the function (see Methods for details). According to this measurement, we classified each neuron within three categories according to its temporal patterns of firing (see Methods): burst-like for
  , regular tonic characterized by a very stable ISI for
  , and an intermediate state of irregular firing (figures 4(a)–(c)). The distribution of the temporal structure of spiking activity in TS patients showed a large fraction of bursting neurons (39/125, 31.2%, figure 4(d)). The overall shape factor in TS STN neurons was negative (
 ) indicating that TS STN neurons operate closer to a bursting regime, in consistence of what inferred from spiking pattern classification. The intra-burst firing rate of neurons with burst-like discharge in TS was really high
  spikes s−1 with an average inter burst interval (IBI) of 597 ± 264 ms and a coefficient of variation (IBI CV) of
  . The fraction of intra bursts spikes was
  , with
  spikes within burst.
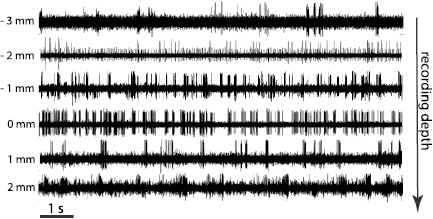
Figure 3. Intraoperative microelectrode recordings of patient 1 (left hemisphere) for depths close to the optimal clinical depth (indicated as 0 mm).
Download figure:
Standard image High-resolution image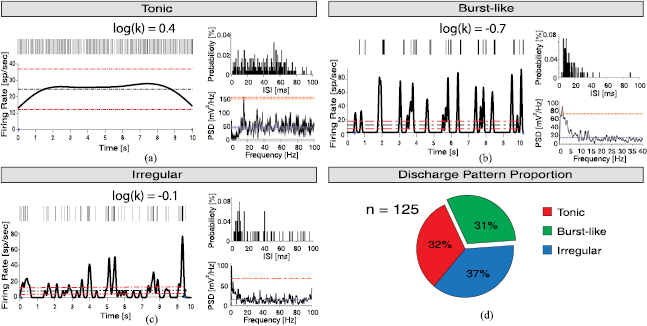
Figure 4. Firing patterns of STN neurons. (a)–(c) Representative temporal firing patterns of single units of STN (see Methods for details): tonic firing (a), burst-like firing (b) and irregular firing (c). Each panel is organized as follows: in the top left vertical bars indicate time stamps of trains of identified spikes; in the bottom left the firing rate of the neuron (tick black line), the mean firing rate (black dashed horizontal line) and the 0.5 * mean range (red dashed horizontal lines); in the top right ISI probability distribution with 1 ms bin; in the bottom right the power spectrum density (black tick line), the mean power spectral density (blue dashed horizontal line) and the minimum threshold for significant oscillations (red dashed horizontal line). D, fraction of bursting (green), tonic (red) and irregular (blue) neurons pooling data from all four patients.
Download figure:
Standard image High-resolution imageOverall, these results show that TS neurons are characterized by a large fraction of intensely bursting neurons.
3.3. TS bursting neurons are prevalently located close to clinical DBS target
Microelectrode recordings were performed to locate the optimal depth of electrodes for DBS stimulation. We investigated then if the neuron activity classification described above varied across depths and whether it was related to the location of optimal DBS target depth.
Neurons were recorded with 0.5 mm intervals from −6 to 4 mm from the target reference frame (see Methods for details). No significant linear correlation between firing rate and depth was observed (Pearson's coefficient r = −0.2, P = 0.07, figure 5(a)). The topographical analysis for  also excluded a linear relationship between burstiness and depth (Pearson's coefficient r = −0.16, P = 0.09). The shape factor varied instead as a function of depth in a U-shaped way (figure 5(b)): bursting neurons were found more frequently close to the selected DBS target (mean depth: −0.93 mm, SD: 2 mm). Moreover, we found a non-homogeneous spatial distribution across depth of the pattern discharge (Fisher Exact test, P = 0.03) with a maximum bursting neurons prevalence at target depth (42% of bursting neurons at depth = 0 mm, versus 17% bursting neurons at depth −4 mm, post-hoc Fisher Exact test, P = 0.01) (figure 5(c)).

Figure 5. Topographical analysis of discharge patterns of STN neurons. (a) Distribution of firing rate as a function of depth, ranging from −6 mm (dorsal) to 4 mm (ventral). The 0 mm depth is defined as the depth of the selected target for DBS. Black thick squares indicate the mean of 2 mm segments. The number of neurons included in each group is reported next to the corresponding bin. (b) Distribution of shape factor log(k) as a function of depth. (c) Distribution of TS neurons spiking pattern (Tonic (red), Irregular (blue) and bursting neurons (green)) for grouped electrode depths (around −4 mm, 0 mm and 4 mm). Asterisk indicates significant difference between bursting neurons proportions at −4 mm and 0 mm depth (Fisher Exact test, P = 0.01).
Download figure:
Standard image High-resolution imageThis suggests that in TS STN presents a global bursting activity over all depths, but with a significantly higher density close to the optimal clinical DBS target. Observing high levels of irregularity might then be used to support the selection of the optimal target site.
3.4. Oscillatory patterns and DBS target site
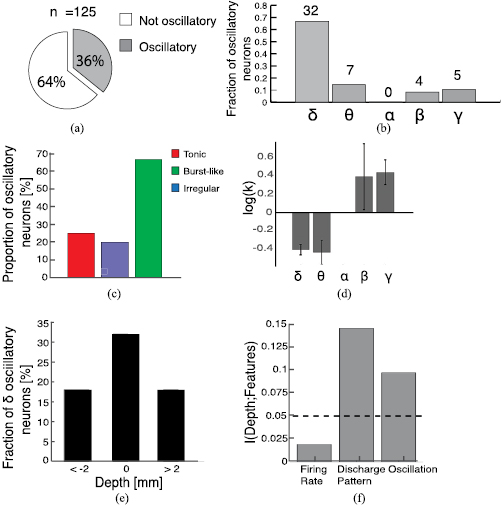
We performed also a spectral analysis of the firing rate to characterize the presence of fluctuations over different timescales in the activity of TS STN neurons and their possible relationship with bursting activity and hence optimal DBS target site. Neurons displaying significant peaks in the power spectrum of their firing rate autocorrelation (see Methods for details) were referred to as oscillatory. When we considered the whole bandwidth from 1 to 100 Hz the fraction of oscillatory neurons was 36.2% (figure 6(a)). Table 3 summarizes the distribution of peak frequency observed in oscillatory neurons across the delta (1–4 Hz), theta (4–8 Hz), alpha (8–12 Hz), beta (12–30 Hz) and gamma (30–100 Hz) bands. Most oscillatory neurons displayed a delta-band frequency, and none an alpha-band frequency (figure 6(b)).
Table 3. Oscillation frequencies of STN cells across frequency bands (median ± iqr/2).
 (1–4) Hz (1–4) Hz |
 (4–8) Hz (4–8) Hz |
 (8–12) Hz (8–12) Hz |
 (12–30) Hz (12–30) Hz |
 (30–100) Hz (30–100) Hz |
|
|---|---|---|---|---|---|
| n (%) | 32 (66.7%) | 7 (14.6%) | 0 (0%) | 4 (8.3%) | 5 (10.4%) |
| Freq | 1.75 ± 0.45 Hz | 4.68 ± 0.32 Hz | Not available | 17.87 ± 4.6 Hz | 71. 58 ± 6.2 Hz |
Figure 6. Single neuron oscillations and feature information. (a) Proportion of oscillatory (gray) and not-oscillatory (white) neurons (b) distribution of oscillatory neurons across different frequency bands: δ (1–4) Hz, θ (4–8) Hz, α (8–12) Hz, β (12–30) Hz and γ (30–100) Hz. (c) Fraction of oscillatory neurons within each category. (d) Shape factor log(k) of oscillatory neurons as a function of frequency band. (e) Fraction of delta oscillatory neurons within each depth. (f) Information carried by different neural features about depth. Black dashed line indicates p = 0.05 significance (see Methods).
Download figure:
Standard image High-resolution image
We wondered then whether these oscillations were related to the presence of bursting activity (see previous subsection). Overall, 60.7% of the bursting neurons were oscillatory, compared to 25.5% and 20.6% of tonic and irregular neurons (figure 6(c)). When stratifying by temporal pattern of firing, we found that oscillatory neurons ranging from delta to theta band were prevalently classified as bursting (n = 27/39; 69.2%), whereas beta and gamma oscillations were exclusively found in tonic or irregular neurons (n = 9/9; 100%). Moreover, a significant positive correlation between the shape factor  and the frequency of oscillation was observed in the oscillatory cells (Pearson's coefficient r = 0.55, P < .001). Coherently, considering separately each frequency band we found that delta and theta oscillations were associated to negative values of the shape factor and beta and gamma to positive values (figure 6(d)). These results imply that low frequency oscillations are specifically associated to bursting activity, coherently with the IBI observed. Note that although the oscillations observed in the gamma band oscillatory neurons were as strong as the delta or theta band oscillations (KW test, p > 0.05) the former were present in far less neurons (figure 6(b)). The predominant frequency band was indeed the burst-related delta band.
Since bursting and oscillations were found to be related, we tested whether the latter could be also used to determine the optimal DBS site. Indeed, in the vicinity of the target site the fraction of oscillatory neurons was 32% compared to 18% of the areas more than 2 mm away from the target (figure 6(e)).
Finally, we computed the amount of information about the target depth carried by the temporal pattern of activity, opposed to oscillatory activity or firing rate (see Methods). We found that the firing rate did not carry significant information, while either the presence of bursting neurons or oscillatory neurons carried significant information (p < 0.05, bootstrap test, see Methods for details), with the presence of bursts carrying 44% more information than the presence of oscillations (figure 6(f)). This strongly suggests that the recording of bursting neurons could be the most useful neural feature to help in the location of the optimal DBS target.
4. Discussion
Localization of DBS target usually starts with radiological images, most commonly MRI, allowing for the determination of the stereotactic coordinates of the selected nucleus. Then, during the implant, microelectrodes are progressively lowered along the selected trajectory to identify the target site thanks to the observation of macroscopic features of the firing rate (e.g. the STN displays higher activity that the thalamus), and of movement correlates (e.g. the sensory-motor area of the STN reacts to passive and active wrist rotations). Finally, the target site is confirmed if the stimulation of the microelectrodes leads intraoperatively to the desired short-term clinical improvements, which for TS corresponds to a decrease in the number of tics per minute [30]. These measurements, however, are able to identify at most the area of the STN, while recent studies [60–62] have shown that the specific depth within the area might be associated to an optimal clinical recovery but also to side effects that cannot be monitored intraoperatively. Here we introduced and analyzed single neuron activity features reliably associated to the optimal clinical depth. These features might help the clinicians to assess the target site with an unprecedented resolution and improve the efficacy of DBS in TS patients.
4.1. STN DBS for TS therapy
DBS therapies for TS focused mostly on the stimulation of the thalamus [63, 64] or the GPi [65, 66]. Here we report a striking improvement of tics following DBS stimulations in sensorimotor STN in four patients with TS. The complete report on clinical trials, including follow-up effects evaluation, goes beyond the scope of the present work and is in preparation.
The main limitation of the current study is the dataset composed by only four patients. However, even such a small set is significant when compared with the lack of similar data in literature: a recent meta-analysis on DBS in TS patients [19] reported no patients with STN implant. To the best of our knowledge, the only previous report of efficacy of STN DBS for tics was observed in a PD patient with concomitant tourettism [67]. Moreover, even if the patients set was small, thanks to the quality of our recordings we were able to record from a large number of neurons (n = 125). Our dataset is then the first relevant insight into the dynamics of STN in TS patients.
4.2. STN dynamics and anesthesia
All four patients underwent STN DBS implant under general anesthesia in order to minimize head movement that might lead to complications during the stereotactic procedure. General anesthesia is a very common practice for this kind of implants in TS patients [68–71]. Anesthesia is well known to affect neural activity, in particular at low frequencies. For this reason, we are aware that our findings, in particular regarding oscillations, might not extend to the dynamics of STN of TS patients in awake condition. However, the purpose of the present work is not to study basal ganglia activity per se but to identify neural markers for the identification of DBS target in TS patients STN, and since this procedure is usually practiced under general anesthesia our conclusions are expected to have a broad clinical application for TS patients. Note that general anesthesia precludes behavioral tests that are routinely performed under local anesthesia to correctly identify optimal DBS location, thus making our candidate procedure particularly useful. The only current alternative to general anesthesia for DBS implant of TS patients is the combination of local anesthesia and drug-induced sedation [63, 68, 69]. It is reasonable to expect that depth specific bursting units could be identified also in this condition and in future works we will investigate this hypothesis.
4.3. Functional architecture of STN and motor disorders
In addition to a direct therapeutic role, DBS provides a unique and powerful platform for the investigation of the neuropathophysiological mechanisms of TS. Indeed, DBS studies contributed to identify hypothetical hyperkinetic neuropathological markers of TS [72–74], like excessive theta LFP activity and theta synchronization between GPi and thalamus [75].
Here we presented the first study on STN subterritories on TS in human patients to our knowledge. Dynamics of firing of the basal ganglia in TS has been analyzed so far mainly in animal models, and usually with a lack of specific analysis of STN firing patterns [4, 5, 8]. Consequently, our work is the first one providing a benchmark to test the theoretical predictions of a recent computational model of TS [76]. We note that model predicts bursting activation of STN with an intra-burst frequency (IBF) of about 200 Hz, which is close to the level of firing we observed in our recordings.
Recent studies performed similar analysis on subterritories of the STN in PD patients. A clinical paper [34] found spatial differences in bursting activities across functional domains in the STN in awake PD patients. Our TS recordings were instead mainly within the sensorimotor domain (figure 1 and table 2) and the analysis focused on depth-specific bursting properties. Although the two works investigated different conditions with different statistical analysis, together they strongly suggest that STN dynamics might be far less homogeneous than generally thought. This has obvious implications in the relevance of an accurate localization of DBS stimulation [77]. In TS patients, such localization of bursts might also be, through the hyper-direct pathway, among the causes of the localization of bursts observed in the thalamus [78], which in turn is supposed to be associated to the specific location of the tics.
To assess whether our results were TS-specific or could be extended to DBS procedures for other motor disorders we performed preliminary analysis comparing our findings with the analysis of microrecordings from the STN of Parkinson's Disease (PD) patients undergoing general anesthesia (supplementary figure 2 and associated supplementary results.). PD patients displayed similar firing rate and delta oscillations distribution but less bursting activity and no specific relationship between the shape factor and the optimal clinical depth. Since the PD dataset was very small, due to the fact that DBS implants for PD patients are usually performed in awake condition, we were not able to infer any specific conclusion about subterritories from the results presented in supplementary figure 2. However, these results suggest that the possibility of identifying the optimal clinical depth thanks to the level of bursting activity might be a TS-specific feature.
A complementary approach investigated the functional relationship between the LFP recorded at different depths in the STN and PD motor symptoms [39]. Interestingly, such studies found that the most informative band in this respect is located at very high frequencies (>200 Hz), which might be linked to in- and out-of phase bursting firing in the basal ganglia neuronal populations [39]. Hence this result is coherent with our view that different motor symptoms might be associated to depth-specific bursting activity. While the LFP spectrum is robust and very rich in information regarding network activity, an estimation of bursting activity might be simpler to implement intra-operatively. Moreover, the spike signal is more localized and might then provide a more detailed spatial resolution. However, since LFP and spiking activity can be recorded at the same time from the same electrodes, the optimal approach would be to combine the information coming from the two signals.
5. Conclusion
We investigated the spatial and temporal structure of single neuron activity recorded with microelectrodes from the sensorimotor area of the STN of four TS patients during intraoperative DBS surgery under general anesthesia. DBS therapy was able to induce a significant improvement in motor disorders in all patients, indicating that stimulation was delivered close to the sites producing the wider therapeutic window to control tics. We found that STN in TS patients was characterized by neurons displaying bursting behavior, and that these neurons were more likely to be found in the vicinity of the optimal DBS target. In particular, a large fraction of these neurons displayed delta-band oscillatory behavior, which also was more frequent close to the optimal DBS target. Both firing irregularity and oscillations frequency carried significant information about optimal DBS target location. We propose that these neural features could be integrated with current DBS implant procedures to support the search for the optimal DBS target site within STN. Finally, this work contributes to knowledge about TS neurophysiology by describing the relationship between the spatial localization of these features and the suppression of TS motor symptoms by DBS.
Acknowledgments
Authors wish to acknowledge Dr Francesco Carella, for his aid in microrecording experimental design and results interpretation. S Micera was supported by the Bertarelli Foundation and by institutional funds from Scuola Superiore Sant'Anna and École Polytechnique Fédérale de Lausanne. LM Romito was partly supported by the Italian Ministry of Health grant GR-2009-1594645. A Mazzoni was supported by institutional funds from Scuola Superiore Sant'Anna.