

Abstract
Objective. Circadian and sleep dysfunction have long been symptomatic hallmarks of a variety of devastating neurodegenerative conditions. The gold standard for sleep monitoring is overnight sleep in a polysomnography (PSG) laboratory. However, this method has several limitations such as availability, cost and being labour-intensive. In recent years there has been a heightened interest in home-based sleep monitoring via wearable sensors. Our objective was to demonstrate the use of printed electrode technology as a novel platform for sleep monitoring. Approach. Printed electrode arrays offer exciting opportunities in the realm of wearable electrophysiology. In particular, soft electrodes can conform neatly to the wearer's skin, allowing user convenience and stable recordings. As such, soft skin-adhesive non-gel-based electrodes offer a unique opportunity to combine electroencephalography (EEG), electromyography (EMG), electrooculography (EOG) and facial EMG capabilities to capture neural and motor functions in comfortable non-laboratory settings. In this investigation temporary-tattoo dry electrode system for sleep staging analysis was designed, implemented and tested. Main results. EMG, EOG and EEG were successfully recorded using a wireless system. Stable recordings were achieved both at a hospital environment and a home setting. Sleep monitoring during a 6 h session shows clear differentiation of sleep stages. Significance. The new system has great potential in monitoring sleep disorders in the home environment. Specifically, it may allow the identification of disorders associated with neurological disorders such as rapid eye movement (REM) sleep behavior disorder.
Export citation and abstract BibTeX RIS
1. Introduction
Sleep disturbances are an important biomarker for many medical conditions [1–6]. Nocturnal sleep disorders can be classified into those that occur during non-rapid eye movement (NREM) sleep and those occurring in rapid eye movement (REM). Insomnia, reduced sleep efficiency and an increased number of awakenings are often reflective of disorders in NREM, while REM sleep behaviour disorder (RBD) or breathing disorders, such as obstructive sleep apnea (OSA), are representative of disorders during REM [7–10]. The signature of sleep disorders therefore relies on identifying the time course of several distinct physiological measures, which are characteristic to each sleep stage. These include electrical brain activity, eye movements and muscle tone. To date, this can only be reliably achieved during an overnight sleep in a polysomnography (PSG) laboratory, which is currently the gold standard for sleep monitoring [9]. PSG consists of at least seven channels: six-lead electroencephalography (EEG), electrooculography (EOG), chin and bilateral anterior tibialis electromyography (EMG), snore channel, abdominal and thoracic respiratory effort, pulse oximetry, and two-lead electrocardiography (ECG). Direct visualization of the raw data facilitates assessment of total sleep time, sleep latency, and percentage of sleep time spent in different stages of sleep. The EEG, EOG and facial EMG are used to distinguish sleep architecture and identify the sleep cycle in which sleep disorders appear (i.e. NREM versus REM) [11].
PSG has been most commonly used for the diagnosis and treatment of OSA, although less common disorders are also readily identified by laboratory PSG, including narcolepsy, RBD, NREM parasomnias, and periodic limb movements of sleep [11]. However, sleep disorders are episodic by nature, and do not necessarily appear every night, thus a single night PSG may not be informative. In addition, the high cost, limited availability and discomfort experienced during a laboratory sleep assessment, which does not reflect everyday life conditions, limits the utility and diagnostic yield of PSG.
In recent years there has been an attempt to use wearable physiologic sensors to conduct sleep-monitoring at home. Most of the available systems utilize movement sensors and monitor blood saturation, heart rate and/or respiratory rate—all important for identifying sleep disturbances but insufficient at distinguishing the sleep stages, in particular for RBD patients [12–15]. Several systems incorporating EEG sensors were recently described. Shambroom and co-workers [16] reported on an automated wireless system based on a headband with three silver coated fabric sensors. In Mikkelsen et al [17] ear electrodes were used to demonstrate automatic sleep EEG data classification. However, these systems still rely on a cumbersome interface or suffer from limited accuracy compared to PSG [9, 10, 12, 18–20].
A promising approach towards ambulatory electrophysiology is the use of printing technology to form flexible electrode arrays. Printed electrodes are marked by their conformity with the skin, being extreme lightweight, their ease of placement on the skin and their improved user comfort. BrainStatus [21] and cEEGrid [22] electrodes are two successful examples. The electrode arrays can be quickly placed on the patient's forehead or behind the ear, respectively. Indeed, Miettinen et al [23] successfully used a printed array to monitor sleep bruxism. However, these systems are incompatible with EMG and require gel coating to establish low-impedance contact with the skin. A home-based system offering a high quality electrophysiological recording of EEG, EOG and EMG along with an ecological interface, as well as comfort and ease of use in a natural environment is still an unmet challenge. To address this need we developed a wireless and wearable system based on 'temporary-tattoo electrodes' we recently developed and optimized for skin electrophysiological applications [24, 25]. The temporary-tattoo electrodes are very thin and as such their placement on the skin is almost unfelt. Their suitability for EMG is outstanding and surpasses the overall performances of gel electrodes. Specifically, as these electrodes require no gel they can be used comfortably for at least 12 h. The system was designed to wirelessly capture EEG, EOG and surface EMG (sEMG) simultaneously from a single electrode array placed quickly on the subject's face for the duration of a night's sleep. The focus of this study was to explore the utility and accuracy of the temporary-tattoo recording during sleep conditions in a laboratory setting and the feasibility of using the temporary tattoo for recording in the home setting. This proof of concept study is the first step towards the ultimate goal to objectively identify sleep architecture over multiple nights in the home environment.
2. Methods
2.1. Electrode arrays
A dedicated electrode layout was designed to capture EEG, EOG and sEMG. Arrays were implemented on thin polyurethane films. An initial silver (Ag) layer was applied to establish the connecting lines. A second carbon (C) layer was used to define the electrode sites. A double-sided adhesive was used to establish stable attachment to the skin. Initial feasibility tests were performed using a prototype version of the electrode. The final design was manufactured using an industry-compatible process as described in [26].
The sleep-specific electrode array includes two sEMG (electrodes 1 and 2), two EOG (electrodes 3 and 4) and four forehead EEG electrodes (electrodes 5–8) (figure 1). The electrode array includes a skin adhesive film for easy and stable attachment to the skin. On both sides, the array is covered with two temporary protection layers to facilitate easy application. The skin-side protective layer is removed right before placement, followed by the removal of the top-side protective layer. All electrodes are 1 cm in diameter. The exposed part of each electrode (i.e. in contact with the skin) is a bio-compatible C layer. Two different locations were tested to place the amplifier (frontal and over the right ear locations). Placement on the skin involved the following stages. First, electrode arrays were connected to a wireless amplifier through a zero-insertion-force (ZIF) connector. Next, the adhesive layer protection was removed and the array was then placed on the cleaned face of the subject. The second protective layer was then removed. Finally, a soft head band was used to secure the amplifier unit (figures 1(b1) and (b2)).

Figure 1. (a) The electrode array system includes: (I) the dry EEG, EOG and sEMG electrode array (with a forehead connector) before placement on the skin (II) the BLE receiver, and (III) the eight channel amplifier with BLE transmitter. Arrows mark flaps in the electrode array for easy peel-off. (b1) A subject wearing an eight-electrode array (with a side connector). (b2) A subject wearing an eight-electrode array with a hair band (with a side connector). (c) Recordings during validation tasks (blinking, eyes movements, smiling and swallowing) of four representing channels. Top: sEMG. Center: EOG. Bottom: two EEG channels (right and left side).
Download figure:
Standard image High-resolution image2.2. Data acquisition
A compact wireless recording system was implemented to amplify and transfer the data to a laptop computer for post-processing (BioPot, SensoMedical). The wireless system consists of an Intan chip integrated on a customized printed circuit board (PCB), a Bluetooth low-energy (BLE) chip, and a battery. Data was recorded online using a LabVIEW program and analysed using customized MATLAB GUI for sleep analysis. The signal was sampled at 486 Hz and filtered using a notch filter at 50 Hz and a band-pass 4 order Butterworth filter at 0.3–35Hz for EEG and EOG, and at 10–242 Hz for sEMG. Recording performance was evaluated: (A) using a series of typical facial movements for validation of the sEMG and EOG and EEG signals; (B) in an EEG laboratory at Tel Aviv Sourasky Medical Center (TASMC) for validation against the gold standard systems (a full EEG and video recording) and (C) in a home setting for assessment of feasibility.
2.3. Participants
Nine healthy volunteers participated in the experiments. The customized single array for EEG, EOG, and sEMG was adhered to the subjects' right side of the face (see figure 1). A disposable ground plate electrode (NATUS, 019-409100\ Spes medica, DENIS01526) was positioned ~5 mm behind the ear on the mastoid process. The array application on the skin took ~5 min to set up and the recording stabilized after ~3 min in all channels. All experiments were conducted on volunteers in accordance with the Helsinki guidelines and regulations for human research and were approved by the Institutional Ethics Committee Review Board at Tel Aviv University and TASMC. Written informed consent was obtained from all subjects. All participants gave their consent for video photography. Any identifiable participants in this study have given their consent for publication.
2.4. EEG during napping
Five subjects were invited to nap for 2 h during the day. This procedure was performed to evaluate sleep in a controlled setting, to explore feasibility and congruency with standardized EEG recordings. Napping was conducted in a designated sleep laboratory room at TASMC. In addition to wearing the temporary-tattoo electrodes, subjects were fitted with a full EEG recording system, applied according to the 10–20 system by a trained technician at TASMC. EEG was recorded using Ag/AgCl electrodes and Ten20 adhesive gel (Weaver and Company, CO, USA). Electrodes were applied according to the 10–20 international system, and the reference electrode was A2. EEG signals were recorded to a Nicolet system (Natus, USA), using a sampling rate of 500 Hz. Files were exported as EDF files and were uploaded to a EEGLAB Toolbox for visualization. For comparison, a tattoo signal was resampled to 486 Hz.
2.5. EEG/EMG/EOG at home
The feasibility of using the temporary tattoo was explored during an overnight sleep at home by four subjects. The array was placed on the subjects' face by the domestic partner before going to bed. Data was recorded on a personal laptop computer. The recording was stopped, and the tattoo was removed when the subject woke up. Recording time was ~6 h but varied between subjects.
2.6. Data analysis
Data collected during validation was explored and compared to video recordings and across subjects. Test-re-test reliability was explored by asking subjects to repeat movements routinely prior to each recording. Data collected during napping was compared to the full EEG system to explore the validity of the signals. Data was reliable at both the laboratory and the home recordings. Sleep staging during the overnight sleep at home was scored by a trained sleep technician according to the American Academy of Sleep Medicine (AASM) manual [27]. For clarity, throughout this paper, data was filtered and presented based on PSG conventions.
3. Results
The array was tested on nine healthy volunteers (age: 34.78 ± 7.49, 77.8% females). Typically, recording from the electrode array showed quick stabilization, reaching a baseline noise root mean square (RMS) of 0.0110 ± 0.0034 mV (derived from 5 s sEMG signals in the first half hour of recording, in eight subjects). Electrode array placements resulted in 7–8 operating and stable recording channels. Operated channels were defined as channels with RMS noise below 20 µV where the RMS noise was derived from all channels at the measurement onset during a time window exhibiting no EMG activity. Operating channels at the onset of a measurement remained stable throughout the entire measurement and detachments were not observed.
System recording performances were first evaluated by a set of validation tasks including: eye blinking, movements of the eyes from right to left, smiling and swallowing. Figure 1(c) shows filtered sEMG (top), EOG (middle) and EEG (bottom) data, using the wireless system with a subject lying in bed. As expected, the blinking artifact is most evident in the EEG channels, eye movements are picked by the EOG and the EEG channels, and smiling and swallowing are recorded in the lower sEMG channels. The polarity of the eye movement artifact in channels 5 and 8 (located on opposite sides of the forehead) is reversed. Results were consistent across all trials and between subjects.
While sEMG, and EOG signals are relatively pronounced (>100 µV), EEG signals are typically marked by relatively low signals. To validate EEG recording performances, we first established the ability to capture Alpha waves. We used 30 s recordings with eyes open and closed (figure 2). Before voluntary eye closure (marked by a dashed line in figure 2), eye blinking is apparent in the EEG channel (channel 7). After eye closure and relaxation, spectral power analysis reveals a clear onset of Alpha waves at ~10 Hz (figure 2(c)).

Figure 2. (a) EEG recording from a subject with eyes open and closed. Dash line indicates voluntary eye closure. (b) Power spectra of 30 s segments (p-welch) of EEG data with eyes open. (c) Power spectra of 30 s segments (p-welch) of EEG data with eyes closed.
Download figure:
Standard image High-resolution imageTo assess the recording stability of the signal during mechanical disturbances (e.g. changing posture during sleep), subjects were visually monitored by a video camera during a sleep session in a hospital bed, while being simultaneously recorded with both our temporary-tattoo electrode array and a 10–20 EEG system. All subjects reported that the system was comfortable and its use did not interfere with their normal sleep positioning. Data in figure 3 demonstrates the effect of rolling in bed, showing a large sEMG signal and pronounced mechanical artifacts. After movement was completed, signals stabilized and returned to baseline. The RMS (calculated over 5 s before turning) was: 0.0164, 0.0091, and 0.0088 mV at the sEMG, EOG and EEG signal, respectively. The RMS during 5 s of turning was: 0.0377, 0.5678, and 0.5082 mV at the sEMG, EOG and EEG signal, respectively. The RMS at 5 s after turning was: 0.0123, 0.0063, and 0.0061 mV at the sEMG, EOG and EEG signal, respectively. Data in figure 3 also portrays two additional achievements; foremost, it shows the ability of the array to record early stages of NREM sleep. Stage 2 is readily observed, as evidenced by the k-complexes and spindles (shaded areas).

Figure 3. Data quality of a temporary-tattoo electrode array compared to a commercial EEG 10–20 system in a monitored hospital environment during an afternoon nap. (a) Voltage versus time recorded with the EEG 10–20 system (F7 and F8). (b) Voltage versus time recorded with the wireless system (electrodes 8 and 5). K-complexes and sleep spindles are clearly apparent in both systems. (c) sEMG, EOG, EEG signal. Movement artifacts during subject rolling in bed are apparent.
Download figure:
Standard image High-resolution imageAdditionally, figures 3(a) and (b) show a comparison between data collected simultaneously from electrodes of different systems, positioned at close proximity to each other (channels 5 and 8 in the temporary-tattoo system and electrodes placed at F7 and F8 with the conventional 10–20 system). Signals recorded with the temporary tattoo and the 10–20 system were visually similar (e.g. all ten eye blinks were visible in both signals). In addition, we evaluated the correlation of three subjects between data recorded with both systems during the blinking tasks (channel 8 versus Fp1). A correlation value of 0.8164 ± 0.0753 substantiates the reliability of the temporary-tattoo recordings compared with the conventional 10–20 system.
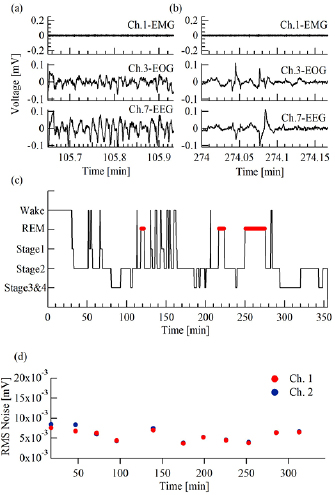
Finally, a full night (~6 h) recording was performed at subjects' homes (n = 4), while sleeping in their own bed. Figure 4 shows an example from one subject. In addition to sleep spindles and k-complexes, already described above, EEG channels also revealed the deeper stages of sleep: stage 3 and 4 (figure 4(a)) and REM sleep (figure 4(b)). A hypnogram, scored by a trained sleep technician (figure 4(c)), shows typical transitioning between night stages, marked by frequent wakening at the first two hours and three REM cycles. The baseline noise level measured on the sEMG channels is presented in figure 4(d). Throughout the measurement, noise remained stable at the range of 0.0057 ± 0.0014 mV (figure 4(d)).
Figure 4. An example of a full night recording at home from one subject. (a) Stage 3 and 4. (b) REM stage. Top: sEMG (electrode 1). Center: EOG (electrode 3). Bottom: EEG (electrode 7). (c) A full night hypnogram scored by a sleep specialist. (d) Noise RMS measured from the sEMG channels (electrodes 1 and 2) over a full night's sleep.
Download figure:
Standard image High-resolution image
4. Discussion
In this investigation we studied the recording performances of a novel wireless, wearable and dry electrode array to simultaneously monitor sEMG, EOG and EEG during napping and night sleep. Results of this study show the feasibility of recording high-fidelity electrophysiological data in both a controlled hospital setting and the home environment.
The soft nature of the temporary-tattoo array and the overall small footprint of the system guarantees user convenience, allowing for a more ecological assessment of sleep. Moreover, the firm manner by which the array is adhered to the skin ensured stable recording over many hours. The use of printed electrodes on a thin film offers the opportunity to introduce many recording sites without an increase in system cumbersomeness. We used this feature to achieve recording redundancy and enable the rejection of noisy channels if necessary. Low noise channels remained stable and could be used for continuous recordings. Multiple recording sites also help to compensate for inter-subject variability to effectively achieve artifact removal. The array used in the current investigation was designed to fit an average adult head. Clearly, variability in head features and dimensions can be compensated by customizing arrays to specific head dimensions.
In recent years there has been an attempt to use wearable physiologic sensors to conduct sleep-monitoring at home. Most of the available systems utilize movement sensors and monitor blood saturation, heart rate and even respiratory rate, all important for identifying sleep disturbances but insufficient at distinguishing between the sleep stages at which they occur [12, 15]. Some bed-based and movement sensors may have a high accuracy of sleep staging in healthy volunteers but they use muscular atonia as a biomarker of the REM sleep state which is irrelevant for RBD patients [13, 14]. Several systems have also attempted to evaluate EEG to distinguish between sleep stages. Most available systems use minimal EEG sensors (1–2 sensors) [12] and do not incorporate additional physiologic sensors. These systems are often cumbersome (they are wired and include a processing unit), and require electrode positioning by a professional. Moreover, to date, reports on accuracy and comparison to PSG are as yet unknown [12]. Our findings demonstrate valid, stable and accurate recordings, similar to conventional methods without the cumbrous PSG constraints. These results pave the way for using such a technique to obtain quality quantitative sleep data in the comfort of a person's home, with minimal disturbance.
The main motivation for our investigation was the realization of a home-based system for future monitoring of RBD. Accordingly, it was important that the collected data is similar to that which is currently accepted by medical practice. Thus, we ensured that data collected by our electrode array and the manner by which it was presented, is similar to that obtained using a conventional PSG setup. This allowed a trained technician to analyse it without difficulty (see figure 4(c)). Clearly, the manual process currently involved in PSG sleep analysis has very long-standing drawbacks and should be addressed. Novel machine learning algorithms can be applied in the future, further simplifying the overall procedure towards faster and cheaper sleep monitoring. Further reducing noise sources and artifacts in the recorded system will contribute to an improved ability to automate the analysis process.
In this feasibility study, all participants were healthy volunteers. Future studies will include a cohort of subjects with sleep disorders (both diagnosed and undiagnosed). Sleep disorders are episodic by nature, and do not necessarily appear every night, thus single night assessment may not be informative enough. Obtaining significantly more data per person is key to identifying episodic symptoms and understanding the variability of sleep patterns within and between subjects. Future studies should also include a full comparison to the current gold standard and enhance the overall usability of the system by optimizing and simplifying the array placement and recording routine to ensure and facilitate self-application by participants at home. This work is currently underway.
To conclude, the wearable technology we developed and demonstrated herein resolves two of the main challenges in PSG: data reliability (patient can sleep normally at home) and data availability (more nights, more patients). User convenience is a critical parameter, determining the ability of the subject to sleep without additional disturbances. The new device is a viable solution to the pressing clinical need to monitor sleep stages in the patient's home.
Acknowledgments
This project was supported by Teva Pharmaceuticals. Partial support was available by ERC (Funmania) and ISF grants. YH and MdV acknowledge the support of the British Council through the UK–Israel lectureship scheme. The authors have confirmed that any identifiable participants in this study have given their consent for publication.