

Abstract
Objective. For individuals blinded by outer retinal degenerative diseases, retinal prostheses would be a promising option to restore sight. Unfortunately, however, the best performance of existing devices is still far removed from normal vision. One possible reason for the shortcoming is thought to be suboptimal stimulation conditions such as the waveform shape of electric stimulus. In this study, we explored the effects of varying waveforms on network-mediated responses arising in retinal ganglion cells (RGCs). Approach. We used a cell-attached patch clamp technique to record RGC spiking activities in the isolated mouse retina. ON alpha RGCs were targeted by soma size and their light responses to stationary spot flashes. Spiking in targeted RGCs was measured in response to an epiretinally-delivered cathodal current pulse in four waveforms: rectangular, center triangular, increasing and decreasing ramp shapes. Each waveform was tested at three durations (20, 10, and 5 ms) with adjusted amplitude for a range of total charges (50–400 nC). Main results. ON alpha RGCs always generated two bursts of spikes in responses to all stimuli conditions we tested. However, at a given charge, effects of differing waveforms were distinct in the two bursts. For the first burst, the increasing ramp was most effective among the four waveforms (p < 0.05 for all pairwise comparisons with other waveforms). For example, in responses arising from 20 ms-long stimuli, the increasing ramp evoked ~44% more spikes on average than the rectangular shape which is the typical choice of neural stimulation. Also, the rectangular stimulus evoked the weakest response in the delayed burst arising from pulses of every duration. For instance, 20 ms-long stimuli in the three non-rectangular waveforms showed ~23% or more increment in spike counts compared to response arising from the rectangular one; but there was no statistical difference in response magnitudes across the non-rectangular waveforms. Significance. Although the rectangular waveform has been primarily used in retinal prostheses our results indicate that rectangular stimulus is not optimal for network-mediated responses of ON alpha RGCs. Instead, non-rectangular waveforms evoke stronger responses at a given charge, indicating higher charge-efficiency. Therefore, non-rectangular waveforms are expected to enhance clinical efficacy of retinal prostheses.
Export citation and abstract BibTeX RIS
Introduction
Millions of patients around the world are suffering from outer retinal degenerative diseases such as retinitis pigmentosa and age-related macular degeneration (Resnikoff et al 2004, Hamel 2006, Hartong et al 2006, Pascolini and Mariotti 2012). These retinal diseases primarily damage light-sensitive photoreceptors, resulting in profound vision loss and blindness. However, inner retinal neurons are known to survive the ailments (Kim et al 2002, Santos et al 1997, Stone et al 1992) and can be electrically stimulated to send artificial visual information to the brain (Zrenner 2002, Weiland et al 2011). This fundamental concept of retinal prostheses has been demonstrated by several groups, and multiple types of microelectronic devices are commercially available or at the stage of clinical trials (Humayun et al 2003, Rizzo et al 2003, Fujikado et al 2007, Zrenner et al 2011, Stingl et al 2013, da Cruz et al 2013, Shivdasani et al 2014, Shivdasani et al 2017, Hornig et al 2017, Daschner et al 2018). Previous clinical studies of those devices have reported some promising results including recognition of high-contrast objects and/or letters in big fonts (Zrenner et al 2011, da Cruz et al 2013, Stingl et al 2013, Daschner et al 2018). Nevertheless, the quality of the restored sight is still far away from that of normal vision. As one of the issues to be addressed for improved quality of artificial vision, suboptimal stimulation conditions are thought to limit the performance of retinal prostheses (Weitz et al 2015, Im and Fried 2016a, Im et al 2018).
To find more effective methods of stimulation, much effort has been devoted to comprehensive understanding of electrically-evoked responses of retinal neurons. As a result, it has been well-established that short duration pulses directly activate retinal ganglion cells (RGCs) (Jensen et al 2005a, Fried et al 2006, Sekirnjak et al 2008, Tsai et al 2009, Jepson et al 2014). Direct activation of RGCs is known to create a single spike per pulse with high temporal precision (Fried et al 2006, Jepson et al 2014). But, it remains challenging how individual RGCs are to be driven to spatiotemporally mimic complex natural spiking patterns that arise normally in the healthy retina (Freeman et al 2011a, Im and Fried 2015). This is because, in part, the neural signaling of the retina in response to natural viewing is composed of sporadic bursts of spikes (Puchalla et al 2005, Im and Fried 2016b), which are unique in each RGC type. Also, earlier studies demonstrated that visually-evoked spiking patterns are remarkably heterogeneous even in a single type of RGC (DeVries and Baylor 1997, Im and Fried 2015). In contrast to short pulses that directly activate RGCs, longer duration pulses preferentially activate presynaptic neurons such as bipolar cells and/or photoreceptors, resulting in indirect activation of RGCs (Freeman et al 2010, Freeman et al 2011a, Eickenscheidt et al 2012, Lee et al 2013, Boinagrov et al 2014, Im and Fried 2015, Im et al 2018). Spiking activity arising from indirect activation is referred to as a network-mediated response and has long been expected to be more natural (or physiological) because indirect activation may utilize unique neural network of each RGC (Zrenner 2002). Indeed, it has been recently demonstrated that network-mediated responses of ON types of RGCs are close matches of their own light-evoked responses (Im and Fried 2015), suggesting a clinical importance of the network-mediated responses. For the best indirect activation methods that may lead to improved clinical outcomes, previous studies have suggested optimal stimulus durations (Lee et al 2013, Weitz et al 2015, Im et al 2018) as well as stimulation rates (Im and Fried 2016a). However, it remains less explored whether network-mediated responses can be further optimized by other stimulation parameters including the stimulus waveform.
Although rectangular electric pulses have been conventionally used in retinal prostheses (Rizzo et al 2003, Ahuja et al 2011, Stingl et al 2013, Shivdasani et al 2014, Fujikado et al 2016) it has been reported that a sinusoidal waveform has a lower threshold for RGC spiking than a rectangular one (Suzuki et al 2004, Weitz et al 2015, Nakano et al 2017). These earlier studies have challenged the optimality of a rectangular waveform and raised the possibility that other waveform(s) may improve the performance of retinal implants. Nonetheless, previous researches have been limited to only sinusoid and its threshold for a single spike (Suzuki et al 2004, Weitz et al 2015, Nakano et al 2017). So, a comprehensive understanding is still lacking about the effects of various waveform shapes on RGC responses.
In the present study, we systemically examined network-mediated responses arising from four different waveforms (i.e. rectangular, center triangular, increasing ramp, and decreasing ramp shapes) in ON alpha RGCs of the mouse retina. The effectiveness of those waveforms was characterized at three pulse durations (20, 10, and 5 ms) in a wide range of total delivered charges (50–400 nC). Our results show that non-rectangular pulses are more charge-efficient in eliciting network-mediated responses than the rectangular pulse, suggesting that those unconventional stimulus waveforms may strengthen artificial visual percepts at a given charge.
Methods
Preparation of retina
The care and use of animals followed all federal and institutional guidelines; all protocols were approved by the Institutional Animal Care and Use Committee of the Henry Ford Health System. Wild-type mice of the C57BL/6J strain (either sex) were purchased from the Jackson Laboratory (Bar Harbor, ME, USA) and sacrificed at the postnatal days ranging from 56 to 158. For euthanasia, animals were anesthetized via inhalation of vaporizing isoflurane and then cervical dislocation was performed. Next, eye balls were enucleated from the mice and then retinas were separated from the retinal pigment epithelium in oxygenated Ames medium (Sigma Aldrich, St. Louis, MO, USA). A piece of retina (~5 mm in diameter) was mounted photoreceptor side down on a 10 × 10 mm2 square piece of Millipore filter paper (0.45 µm HA membrane filter; EMD Millipore, Billerica, MA, USA) immobilized on a slide glass. A small hole (~2 mm in diameter) of the filter paper allowed light stimuli to be presented from below.
Electrophysiology and light response
We used a cell-attached patch clamping technique to record spiking activities of RGCs. Spiking was recorded using a patch electrode filled with Ames medium. Two silver chloride-coated silver wires with a diameter of 0.25 mm served as the ground. Each wire was separated by ~10 mm and was positioned ~15 mm away from a targeted cell. Retina tissue was continuously superfused with Ames medium at 36 °C (flow rate: ~4 ml min−1), equilibrated with 95% oxygen and 5% carbon dioxide.
A patch pipette was used to make a small hole (typically 100–200 µm in diameter) in the inner-limiting membrane. Through the opening, alpha RGCs with large somata (>20 µm) were targeted (Pang et al 2003, Murphy and Rieke 2006). We further identified ON type of alpha RGCs by their response to light stimuli which were projected from below using an LCD projector (IN119HDx; InFocus, Portland, OR, USA), and focused onto the outer segments of the photoreceptors. Bright spot flashes (diameter of 100–1000 µm) were centered at the soma and presented for 1 s on a gray background. Also, moving bars were presented to all cells to exclude directionally selective cells (Barlow et al 1964). Responses from seven ON alpha RGCs were obtained from seven different retinas.
Data were sampled at 10 kHz by NI-DAQ (NI PCIe-6361; National Instruments, Austin, TX, USA) after low-pass filtering at 2 kHz using a MultiClamp 700B amplifier (Molecular Devices, Sunnyvale, CA, USA). The data acquisition and light/electric stimuli were controlled by custom software written in LabVIEW (National Instruments, Austin, TX, USA) and MATLAB (Mathworks, Natick, MA, USA).
Electric stimulation
Monophasic cathodal electrical current was epiretinally delivered using a 10 kΩ platinum–iridium electrode (MicroProbes, Gaithersburg, MD, USA); its exposed conical tip (no insulation layer) has an approximate height of 125 µm and a base diameter of 30 µm, giving a surface area of ~5900 µm2. The tip of the stimulating electrode was positioned 25 µm above the inner limiting membrane and was laterally offset by 50 ± 10 µm from the soma. Two silver-chloride coated silver wires served as the return for the stimulating electrode.
We tested four different waveforms: rectangular, center triangular, increasing ramp, and decreasing ramp shapes (figure 1). Stimulus waveforms were programmed and delivered using the STG2004 system (Multi-Channel Systems MCS GmbH, Reutlingen, Germany). Each waveform was tested in the pulse durations of 20, 10, and 5 ms, which are known to evoke strong network-mediated responses (Im et al 2018). In each duration, we varied the average current amplitude for a total delivered charge ranging from 50 to 400 nC in 50 nC steps (Note that we used positive numbers in total charges for the ease of presentation although we applied cathodal currents). For a constant charge across waveforms, peak current amplitudes were two-fold bigger in non-rectangular waveforms (i.e. center triangular, increasing and decreasing ramps) compared to that of the rectangular waveform. For example, peak current amplitudes of 20 ms-long non-rectangular and rectangular pulses for 400 nC were −40 and −20 µA, respectively. At a given stimulus condition (i.e. pulse shape, pulse duration, and current amplitude), the electric pulse was presented a minimum of eight times with an inter-pulse interval greater than 3 s. This large interval allowed us to avoid the reduction in RGC sensitivity to repetitive stimuli (Jensen and Rizzo 2007, Freeman and Fried 2011, Im and Fried 2016a). A same stimulus condition was repeated before another new condition was tested. Both current amplitude and duration were tested in increasing order while pulse shape was randomized.
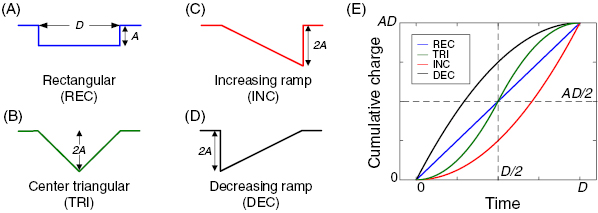
Figure 1. Four stimulus waveforms tested in the present study have different charge injection rates. (A)–(D) Electric stimulus was a monophasic cathodal current in one of rectangular (A), center triangular (B), increasing ramp (C), and decreasing ramp (D) waveforms. D and A represent the stimulus duration and the current amplitude of a rectangular pulse, respectively. Non-rectangular pulses (i.e. center triangular, increasing ramp, and decreasing ramp waveforms) had the same duration but two-fold higher peak current to hold total charge constant for all waveforms, facilitating comparisons in terms of charge-efficiency. (E) Cumulative charge is plotted as a function of time for each waveform. Over the course of stimulus duration, charge injection rate differs across waveforms although all waveforms deliver the same amount of total charge (AD).
Download figure:
Standard image High-resolution imageData analysis
Typically, we recorded spiking activities of RGCs in responses to a minimum of eight repeats of each stimulus. We detected spikes from raw recordings using a matched filter written in MATLAB. The individual spike timing was extracted as the depolarization peak of each spike (Lee et al 2013), making the spike timing reported here ~0.2 ms greater than its actual onset. Each spike was represented by a vertical tick mark in raster plots. We also presented spiking responses in the form of a post-stimulus time histogram (PSTH). Consistent with previous work in the rabbit retina (Im and Fried 2015, Im et al 2018), the clustering of evoked spikes into two bursts was clearly visible with separation by a spike-free interval in both raster plots and PSTHs (figure 2). We defined the 'first burst' as spiking activities that arose within 50 ms from the onset of stimulus, and the 'delayed burst' as those arose after 100 ms. In the present study, these two response components were individually analyzed.

Figure 2. Waveform shape alters response magnitudes of ON alpha retinal ganglion cell. (A) (Top) stimulus was a 20 ms-long cathodal current in rectangular waveform (amplitude of ‒20 µA). (Middle) raw recording in response to electric stimulation from a representative ON alpha retinal ganglion cell; a yellow box highlights spikes that are partially obscured by the stimulus artifact. Raster responses from eight repeats of the identical stimulus. The top response of the raster plot corresponds to the raw recording shown above. (Bottom) post-stimulus time histogram (PSTH) of evoked responses averaged from eight repeats. Time scale at the PSTH applies to all rows. (B) and (C) Same as A but for stimuli in center triangular (B), increasing ramp (C), and decreasing ramp (D) waveforms (peak amplitude of ‒40 µA). All waveforms delivered the same amount of charge (400 nC) at a fixed stimulus duration (20 ms). To facilitate comparison of spiking activities arising from the rectangular stimulus versus the other non-rectangular stimuli, the PSTH of the response to the rectangular stimulus was overlaid in red contour on the PSTHs of the responses to other stimuli in panels (B)–(D).
Download figure:
Standard image High-resolution imageTo evaluate charge-efficiencies across waveforms, we plotted spike counts as a function of stimulus charge for both bursts of spikes (figures 3 and 7). For the delayed burst, we also plotted spike counts as a function of normalized energy: for all waveforms, supplied energies at differing stimulus charges were normalized by the reference energy which was the maximum energy of rectangular waveform at the total charge of 400 nC in each duration (figures 8(A1)–(C1)); indicated by an upward yellow arrowhead in figure 8(A1). At the reference energy, relative energy-efficiencies were also computed for the waveforms (figures 8(A2)–(C2)): spike counts in responses to non-rectangular waveforms were normalized by the spike count in response to the rectangular waveform in each cell, and then averaged across all cells. Due to the two-fold difference in peak current amplitude across rectangular versus non-rectangular pulses (figure 1), the supplied energy levels at the same stimulus charge differed across the two groups, resulting in lack of measurement for non-rectangular waveforms at the reference energy. This is because the supplied energy is proportional to the square of the instantaneous current amplitude (Foutz et al 2012). Therefore, the numbers of spikes elicited by non-rectangular waveforms at the reference energy were estimated by interpolating between two data points close to the reference energy (indicated by downward yellow arrows in figure 8(A1).
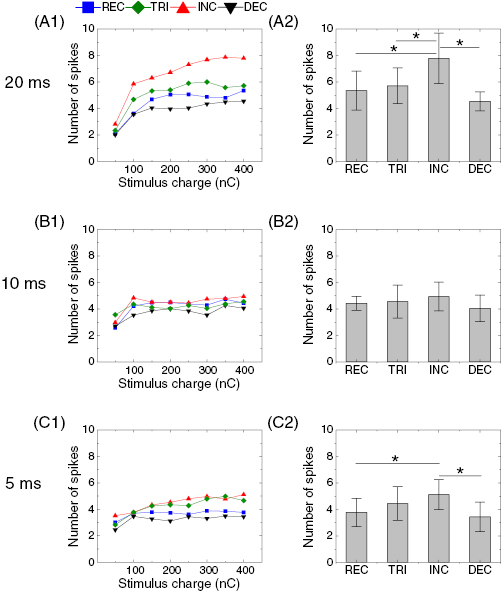
Figure 3. Response magnitude of first burst is dependent on stimulus waveform. (A1) Average number of elicited spikes in the first burst (spike onset latency <50 ms) as a function of stimulus charge in response to four waveforms at the duration of 20 ms. Spike counts were averaged across all cells (n = 7). Error bars are omitted for clarity. (A2) Comparisons of spike counts across responses to all waveforms at 400 nC of total delivered charge. Error bars indicate standard errors. ANOVA using Holm–Sidak post-hoc comparison was applied to verify the statistical significance: *p < 0.05. (B) and (C) Same as A but for stimulus durations of 10 ms (B), and 5 ms (C). No statistical significance was found in responses to 10 ms-long stimuli (B2).
Download figure:
Standard image High-resolution imageUnless otherwise indicated, all data were presented as the mean ± standard error. Statistical significance was verified using a two-way repeated ANOVA (pulse shape × duration) and Holm-Sidak post-hoc comparisons; p < 0.05 was considered statistically significant.
Results
Sensitivity of indirect responses of ON RGCs differs across stimulus waveforms
Previous studies reported that the sinusoidal stimulus requires smaller threshold charges than the rectangular stimulus does for both direct (Suzuki et al 2004, Nakano et al 2017) and indirect (Weitz et al 2015) activation of RGCs. These earlier findings raise a possibility that other non-rectangular waveform(s) may be more effective for eliciting spiking activities in RGCs. To test this possibility, we measured indirect responses of ON types of alpha RGCs in the mouse retina to four different waveforms: rectangular (REC), center triangular (TRI), increasing ramp (INC), and decreasing ramp (DEC) shapes (figures 1(A)–(D)). Stimulus was a cathodal current pulse which was epiretinally delivered from an extracellular stimulating electrode (see methods). At a given stimulus duration, we doubled peak current amplitude for non-REC pulses to hold total charge constant for all waveforms (figures 1(A)–(D)). This allowed us to systematically explore charge-efficiencies of those waveforms. These four waveforms have differing charge injection rates (i.e. current amplitude as a function of time): REC pulse has a constant current level during the whole duration of stimulus whereas other waveforms have their peak current in the middle, at the end or the beginning of stimulus (TRI, INC and DEC, respectively). Figure 1(E) shows how the total charge was delivered as a function of time for each waveform shape. Due to the different charge injection rate of each waveform, there would be discrepancies across waveforms in time required to reach the certain amount of cumulative charges. For instance, the DEC waveform (black trace in figure 1(E)) would always need the shortest integration time to reach to all levels of cumulative charges while the INC waveform (red trace in figure 1(E)) would require the longest time for the same charge. However, the TRI waveform (green trace in figure 1(E)) would require a longer time to supply the charge smaller than a half of the total charge (AD/2) but a shorter time to supply the charge >AD/2 than the REC waveform (blue trace in figure 5).
Figure 2 shows raw recordings, raster plots and PSTHs of spikes elicited in a representative ON alpha RGC by 20 ms-long stimuli in the four waveforms which delivered an equal charge of 400 nC (corresponding to peak currents of −20 and −40 µA for REC and non-REC pulses, respectively). All waveforms generated a brief burst of spikes with the onset latency in the order of milliseconds, and the other prolonged burst of spikes was followed with the onset latency of ~150 ms after a long spike-free interval. This spiking pattern is consistent with previous work reporting two bursts of spikes in the corresponding type (ON brisk sustained type) of RGCs in the rabbit retina (Im and Fried 2015, Im et al 2018). Although the spiking patterns arising from dissimilar waveforms looked largely similar, those elicited responses showed a couple of differences across waveforms. First, it is notable that the delayed burst arising from the REC stimulus was sparser (or weaker) than those arising from the other non-REC stimuli (compare raster plots of figures 2(A) versus 2(B)–(D)). The weaker response is more clearly visible when the PSTH of the response to the REC waveform (shown in red contour) is overlaid onto the PSTHs of the responses to the other waveforms (compare responses around 200 ms in figures 2(B)–(D)). In the PSTHs, it is evident that the peak firing of the delayed burst was considerably increased in responses to non-REC pulses compared to the red contour (figures 2(B)–(D)). Second, TRI and INC pulses elicited stronger responses in the first burst than that of REC pulse while the DEC pulse produced the first burst in a similar magnitude (compare red contour and black PSTH before 50 ms in figures 2(B)–(D)). These results in the two bursts were similarly observed from every ON alpha RGC (n = 7/7), indicating that the sensitivity of indirect activation of RGCs is different across various waveform shapes. Given the fact that REC waveforms have been the conventional electric stimuli used in retinal prosthetic systems (Rizzo et al 2003, Ahuja et al 2011, Stingl et al 2013, Shivdasani et al 2014, Fujikado et al 2016), it is surprising the stronger responses arose from non-REC stimuli although the total delivered charges kept constant.
Increasing ramp waveform evokes the largest number of spikes in the first burst
In the two bursts of spikes arising in the ON RGCs, numerous previous studies suggest that the first burst arises from activation of the ganglion cell and bipolar cells while the delayed burst is mediated by photoreceptors (Jensen et al 2005b, Fried et al 2006, Sekirnjak et al 2006, Tsai et al 2009, Margalit et al 2011, Eickenscheidt et al 2012, Boinagrov et al 2014, Im and Fried 2015, Twyford and Fried 2016). Due to the different synaptic origins, varying waveforms may have differing effects on the first and delayed bursts. Thus, we analyzed effects of waveforms in the two bursts of spikes separately. For all stimulus duration, we performed a two-way repeated ANOVA analysis (pulse shape × duration) for numbers of spikes in the first burst: the effect of pulse shape on the spike counts was significant (p < 0.001).In particular, INC waveforms evoked significantly more spikes than other waveforms (p = 0.016, p = 0.009, and p = 0.004 for INC-REC, INC-TRI, and INC-DEC, respectively). We further quantified the response magnitude of the first burst arising from 20 ms-long pulses in each waveform: figure 3(A1) shows the average number of spikes in the first burst (latency < 50 ms) as a function of supplied charges ranging from 50 to 400 nC. It is readily prominent that the INC waveform elicited considerably bigger responses than the other three waveforms (REC, TRI, and DEC); the enhancement was consistently shown throughout the charge levels we tested. Specifically, at the given charge of 400 nC (figure 3(A2)), it is surprising that the INC pulse generated ~73% more spikes than the DEC pulse which generated the smallest responses (7.8 ± 1.9 versus 4.5 ± 0.7 spikes; p = 0.016). Also, the INC waveform was ~44% more effective for eliciting spikes than the REC pulse which is a primary choice in retinal prosthetics (7.8 ± 1.9 versus 5.4 ± 1.5 spikes; p = 0.033). These results clearly indicate that the stimulus waveform is an important factor determining response magnitude of the first burst arising in ON alpha RGCs.
In addition, we explored whether stimulus duration alters the effect of waveforms because network-mediated responses of RGCs are strongly dependent on stimulus durations (Lee et al 2013, Samba et al 2015, Im et al 2018). All waveforms were also tested in the durations of 10 and 5 ms, and the average numbers of spikes were plotted with respect to delivered charge (figures 3(B1) and (C1)). Consistent with results of 20 ms-long pulses, the strongest responses were elicited by INC stimuli in both shorter durations in most of the cells (n = 7/7 for 20- and 5 ms-long pulses, and n = 6/7 for 10 ms-long pulses). Although the average spike count was biggest with INC stimuli pairwise comparisons of responses between 10 ms-long INC pulse and other pulses did not reach the level of statistical significance (figure 3(B)). However, the response difference across waveform shapes became significant when one outlier was excluded from the analysis with responses to 10 ms-long stimuli (p = 0.019, p = 0.039, and p = 0.003 for INC-REC, INC-TRI, and INC-DEC, respectively; ANOVA).
It is interesting to note that the enhancement by INC waveform in spike counts was somewhat reduced with shorter stimulus durations (figures 3(B2) and (C2)). For example, 5 ms-long INC pulses produced 50% more spikes on average than DEC pulses (5.1 ± 1.1 versus 3.4 ± 1.1 spikes; p = 0.026), which is smaller than a ~73% increment between corresponding pulses in the duration of 20 ms. This difference demonstrates that the effect of waveform shape on the first burst was biggest at the longest duration we tested. We found it was because the effect of stimulus duration differs across waveforms: the INC waveform elicited a much stronger first burst in response to a 20 ms-long pulse than those in response to a 10- or 5 ms-long pulse (compare red traces in figures 3(A1)–(C1)) while other waveforms did not show a similar level of increment. For instance, at the fixed charge of 400 nC, the 20 ms-long INC waveform showed ~53% enhancement in spike counts compared to a 5 ms-long one (7.8 ± 1.9 versus 5.1 ± 1.1 spikes; compare INC bars of figures 3(A2) and (C2)). In contrast, other waveforms exhibited relatively smaller levels of increment (~42%, ~29%, and ~32% for REC, TRI, and DEC, respectively) between responses to pulses in 20 and 5 ms (compare corresponding bars between figures 3(A2) and (C2)).
The INC waveform showed another unique feature in their first burst responses to 20 ms-long pulses. The number of spikes elicited by the INC stimulus kept increasing at a high amount of charges until 350 nC (but seemed eventually saturated between responses to 350 and 400 nC) while responses to other waveforms were saturated from 200 nC (figure 3(A1)). We suspect that the monotonous increment in current amplitude of the INC waveform might better prevent RGC responses from saturation, resulting in the biggest spike count (see discussion). Earlier studies demonstrated the first burst arises from the activation of both the ganglion cell and its presynaptic bipolar cells (Jensen et al 2005b, Fried et al 2006, Sekirnjak et al 2006, Tsai et al 2009, Twyford and Fried 2016). Our results indicate that the long duration (i.e. 20 ms) in the INC shape activates those inner retinal neurons most effectively among the stimuli we tested in this study.
Onset latency of the first spike depends on charge injection rate
In addition to spike counts, each waveform showed a systematic change in the average onset latency of the first spike as a function of total charge delivered (figure 4). For every waveform, the first spike needed longer time of charge integration to be elicited by the longer duration pulse at an equal charge (due to lower current amplitude), consistent with previous studies (Tsai et al 2009, Lee et al 2013). In addition, the onset latency of the first spike across all pulse durations generally decreased with increasing charge, similar to earlier reports (Stett et al 2000, Sekirnjak et al 2008, Lee et al 2013). However, after the latency was reduced to ~2 ms, any further increase in charge did not significantly alter the latency (figures 4(B) and (C)). For example, the latencies of the first spikes in responses to the 10 ms-long DEC and REC pulses became 1.9 ± 0.4 and 2.1 ± 0.4 ms at 200 nC, respectively; and in response to bigger charges, there was no significant reduction in the latency of the first spike (figure 4(B)). Also, in the duration of 5 ms, all waveforms evoked the first spike with average latencies ranging from 1.6 to 2.2 ms for the total charge >200 nC (figure 4(C)). Interestingly however, even the DEC stimuli that had the biggest current amplitude during the first couple of milliseconds among all waveforms failed to achieve sub-1.6 ms latency at all durations. The lower limit of the onset latency was similarly observed in previous work (Fried et al 2006, Tsai et al 2009, Im and Fried 2015), and is probably due to the biophysical properties of voltage-gated sodium channels in RGCs.
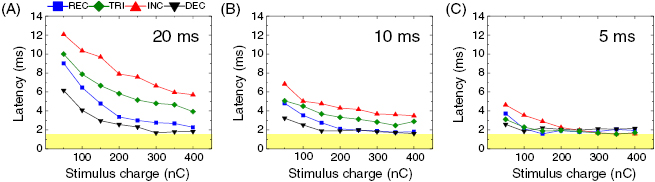
Figure 4. Onset latency of first spike is sensitive to stimulus waveform in all durations. Average latency of the first spike is plotted as a function of stimulus charge for each waveform at pulse durations of 20 ms (A), 10 ms (B), and 5 ms (C). Latencies were averaged across all cells (n = 7). Error bars are omitted for clarity. In all waveforms at every duration, the average latency decreased with increasing charge but did not fall below the lower limit highlighted with a yellow band in all panels.
Download figure:
Standard image High-resolution imageIn all durations and charge levels, INC and DEC pulses showed the longest and the shortest latencies for the first spike (figures 4(A)–(C)), but note that this trend was not clearly shown for 5 ms-long pulses with total charge >200 nC as latencies reached their lower limit (figure 4(C)). More interestingly, at a given total charge, the first spike latencies increased in the order of DEC, REC, TRI, and INC waveforms in responses arising from 20- and 10 ms-long pulses (figures 4(A) and (B)). These distinct onset latencies across waveforms are not entirely surprising because current amplitudes of these waveforms at the stimulus onset were highest in the same order (DEC > REC > TRI > INC) and previous work reported decreasing latencies with increasing stimulus amplitude or charge (Stett et al 2000, Sekirnjak et al 2008, Lee et al 2013). To develop a universal relationship between first spike onset latency versus stimulus amplitude (i.e. independent of waveform shape as well as stimulus duration), we replotted figure 4 as a function of the 'effective' current amplitude (figure 5), which is defined by the average current amplitude from the stimulus onset to the first spike latency (see insets of figures 5(A)–(D)). In general, the latency curves from the three durations became similar to a power-law curve (Berry et al 1997, Lee et al 2013) for each waveform (figures 5(A)–(D)) as well as for all waveforms together (figure 5(E)). These plots suggest that, regardless of waveform shapes and stimulus durations, a certain level of cumulative stimulus charge is required to evoke the first spike.

Figure 5. Onset latency of first spike decreases with increasing effective current amplitude. Average latency of the first spike is plotted as a function of effective current amplitude for rectangular (A), center triangular (B), increasing ramp (C), and decreasing ramp (D) waveforms. From each data point in figure 4, an effective current amplitude (Aeff) was computed as an average current amplitude until the first spike arose, which is total cumulative charge for the first spike (Q) over onset latency of the first spike (see insets of (A)–(D)). Each panel contains all data points of each waveform from the three stimulus durations (i.e. 20, 10, and 5 ms). Latencies were averaged across all cells (n = 7). Error bars are omitted for clarity. (E) All data points from panels (A)–(D) were overlaid, demonstrating a universal relationship between first spike onset latency versus effective current amplitude. A yellow band in each panel highlights the lower limit of the first spike latency.
Download figure:
Standard image High-resolution imageMore intriguingly, the incremental order of waveforms in first spike latency exactly matches with the order of those in elicited spike counts (compare figures 3(A1) and (A1)). For example, DEC and INC stimuli that showed the shortest and the longest latencies for their first spike evoked the smallest and the largest numbers of spikes, respectively. To understand this parallel, we plotted the amount of charges accumulated until the first spike elicited by each waveform from the onset latency (figure 6). It is important to note that, in all durations, INC stimuli generally consumed the smallest and pretty consistent charges until the first spike (red curves in figures 6(A)–(C)). Also, although they took the longest time to evoke their first spike, INC stimuli used charges most effectively for eliciting the very first spike. On the other hand, DEC waveform was least effective in the use of applied charges. It seems likely that too strong a current amplitude at the beginning of stimulus unnecessarily wastes charges. For instance, among 5 ms-long pulses delivering 400 nC in total (figure 6(C)), DEC waveform consumed more than ~65% of the total charge until the first spike while INC waveform just needed ~10% of the whole delivered charge. On average across RGCs, the DEC stimulus used additional 229.2 nC (shown as Q5 ms in figure 6(C)). It is likely to be because the DEC stimulus can supply threshold charges in a shorter time than the aforementioned lower limit of onset latency of the first spike, thereby supplying more charges for nothing. Given the smaller number of spikes arising from the DEC pulse (figure 3(C2)), this extra charge seems not effectively used for following spikes by activating RGC and/or bipolar cells. Also, the shorter pulse increased the difference between cumulative charges needed for the first spike arising from DEC and INC stimuli (i.e. Q20 ms < Q10 ms < Q5 ms in figure 6). All in all, too fast current injection would not be preferred for stronger first burst response in the ON alpha RGCs (figure 3) because waveforms consuming smaller charge for the first spike are likely to allocate more charges for the subsequent spikes (see discussion).
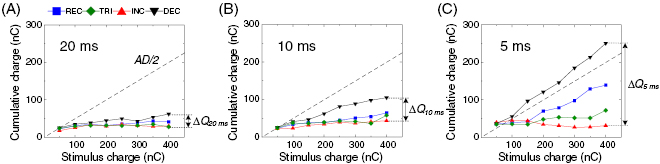
Figure 6. Cumulative charge to first spike latency varies across waveforms. Average delivered charge until first spike was elicited is plotted as a function of stimulus charge for each waveform at pulse durations of 20 ms (A), 10 ms (B), and 5 ms (C). Cumulative charges were averaged across all cells (n = 7). Error bars are omitted for clarity. Diagonal dashed line indicates a half of the total charge (AD/2) at a given stimulus charge. The cumulative charge difference between DEC and INC waveforms were marked at the right of each plot (ΔQ20 ms, ΔQ10 ms, and ΔQ5 ms).
Download figure:
Standard image High-resolution imageNon-rectangular waveforms elicit stronger delayed burst than the rectangular one
We also examined the response magnitude of the delayed burst (latency > 100 ms) elicited by each waveform shape and plotted the average number of spikes (figure 7). Interestingly, all three non-REC waveforms (i.e. TRI, INC, and DEC) always outperformed the REC one at a given charge in every duration (compare blue trace versus others in figures 7(A1)–(C1)). For example, a 20 ms-long TRI waveform delivering the total charge of 400 nC elicited 36.8 ± 13.9 spikes on average, resulting in an increase of ~30% compared to 28.2 ± 12.0 spikes elicited by the REC waveform at the same charge (figure 7(A2)). Also, with 400 nC pulses at the stimulus durations of 10 and 5 ms, spike counts were increased by ~23% and ~15% in responses to DEC and INC waveforms, respectively, both compared to the response elicited by the REC waveform at the corresponding duration (figures 7(B2) and (C2)). It is interesting that, although the best-performing waveform differs in each duration, there was no statistical significance in differences across responses arising from non-REC pulses in general (but note a significance between responses to 5 ms-long TRI and DEC pulses in figure 7(C2)). However, statistical significances were always present between the numbers of spikes elicited by the REC versus non-REC waveforms (figures 7(A2)–(C2)). These results suggest the three non-REC waveforms are equally more effective than the REC waveform for the generation of delayed burst. It is also surprising that the weakest responses arose consistently from REC pulses which has long been typically used in the retinal prosthetics (Rizzo et al 2003, Ahuja et al 2011, Stingl et al 2013, Shivdasani et al 2014, Fujikado et al 2016). Given the previous finding that delayed burst is a closer match of visually-evoked response than first burst in each ON RGC (Im and Fried 2015), it is likely that stronger delayed burst is preferred for strong visual percept. Therefore, our results suggest that non-REC pulses may further strengthen visual percepts at a given charge.
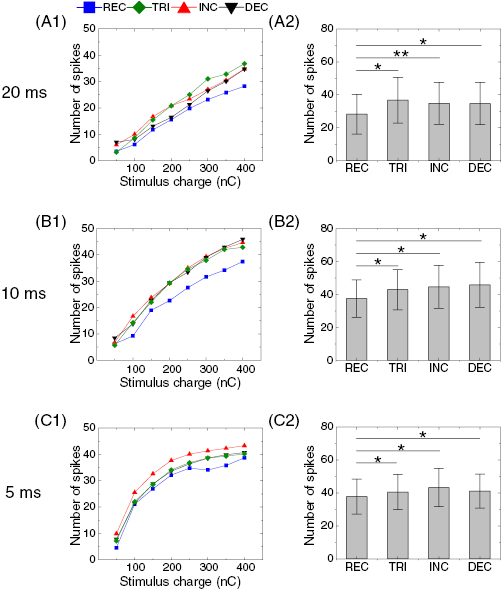
Figure 7. Rectangular waveform evokes weaker delayed burst than non-rectangular waveforms. (A1) Average number of elicited spikes in the delayed burst (spike onset latency >100 ms) as a function of stimulus charge in response to four waveforms at the duration of 20 ms. Spike counts were averaged across all cells (n = 7). Error bars are omitted for clarity. (A2) Comparisons of spike counts across responses to all waveforms at 400 nC of total delivered charge. Error bars indicate standard errors. ANOVA using Holm–Sidak post-hoc comparison was applied to verify the statistical significance: *p < 0.05. (B) and (C) Same as A but for stimulus durations of 10 ms (B), and 5 ms (C).
Download figure:
Standard image High-resolution imageIn contrast to the first burst that was strongest in response to the longest pulses (20 ms) (figure 3), the delayed burst was stronger in responses arising from shorter pulses (5 and 10 ms) in all waveform shapes (compare figures 7(A) versus (B) and (C)). None of the four waveforms at the duration of 20 ms evoked more than 40 spikes on average (figure 7(A)) while the average spike counts of non-REC waveforms were above 40 for the durations of 10 and 5 ms (figures 7(B) and (C)). This is consistent with previous observation that shorter pulses elicited stronger responses than longer pulses at a constant charge (Im et al 2018). In addition, short and long pulses showed distinct response magnitude curves as a function of stimulus charge: the number of spikes evoked by 20 ms-long pulses linearly increased with increasing charge (figure 7(A1)) while the number of spikes evoked by 5 ms-long pulse dramatically increased at the total charge <200 nC, and became almost saturated afterwards (figure 7(C1)). These resulted in a bigger difference in the magnitudes of responses arising from short and long pulses at lower charge levels. For example, at the fixed charge of 400 nC, a 20 ms-long REC pulse elicited ~75% responses compared to responses arising from a 5 ms-long one (28.2 ± 12.0 and 37.8 ± 10.6 spikes). But, the ratio was reduced to only ~48% at 200 nC (15.5 ± 8.1 and 32.2 ± 9.8 spikes), suggesting that the shorter pulse (5 ms) would be even more effective than the longer pulse (20 ms) for eliciting the delayed burst when charge density needs to be limited due to electrode design/material (see discussion).
Response magnitude of the delayed burst is dependent on delivered energy
Our results suggest that the first burst of network-mediated responses arising in ON alpha RGCs is sensitive to charge injection rate (figures 3–6), probably because the first bursts were generally evoked during the stimulus (i.e. while the stimulus charge was being supplied). In contrast, the delayed burst began after the latency >100 ms from the stimulus offset in all RGCs (n = 7/7), which is quite long compared to the stimulus duration. Thus, it is unlikely that a change in charge injection rate within stimulus duration affects the response strength of the delayed burst. Instead, we noted that all three non-REC waveforms were similarly efficient (i.e. no statistical difference across non-REC waveforms in figures 7(A2)–(C2)), and those non-REC waveforms had the peak current amplitude which was twice as big than that of the REC pulse for a constant total charge (figure 1). The higher peak current could be a possible source of the enhanced response in the delayed burst arising from non-REC waveforms compared to the REC waveform because it increased the total energy delivered to the retina although an identical amount of charge was injected. The energy delivered during current stimulus (E) is described by the following equation (Foutz et al 2012):
where D is the stimulus duration, I(t) is the instantaneous current amplitude as a function of time, Z is the load impedance. Although we did not measure the impedance it can be assumed constant during all experiments performed in each RGC. Therefore, relative energy levels can be estimated using this equation: delivered energy for each stimulation condition was normalized by the energy delivered by the REC pulse at 400 nC in each duration. Figures 8(A1)–(C1) show the spike counts of the delayed burst as a function of the normalized energy. It is notable that non-REC pulses supplied more energy compared to a REC pulse that delivered the corresponding amount of charge; e.g. right-most data points in figure 8(A1) represent ~33% more energy was delivered by non-REC than by REC stimuli for the same total charge of 400 nC. This additional energy at a given total charge may explain that the 20 ms-long non-REC waveforms demonstrated ~25% enhancement on average in the number of spikes in the delayed burst at 400 nC than the REC waveform (~30%, ~23%, and ~23% for TRI, INC, and DEC pulses, respectively; see figure 7(A2)). Therefore, we further examined the effectiveness of each waveform stimulus in terms of relative energy-efficiency: spike counts of the delayed burst arising in each RGC were normalized by the spike count arising from the REC pulse that has the maximum energy in each duration, making the normalized energy-efficiency of REC pulse unity (figures 8(A2)–(C2); see Methods). As expected from figures 8(A1)–(C1), normalized energy-efficiencies were largely similar across all waveforms (figures 8(A2)–(C2)): all pairs of waveforms showed no statistical significance between their normalized energy-efficiencies. This result suggests that waveform shape does not substantially alter energy-efficiency in generating the delayed burst although charge-efficiency differs considerably between REC versus non-REC waveforms (figure 7).
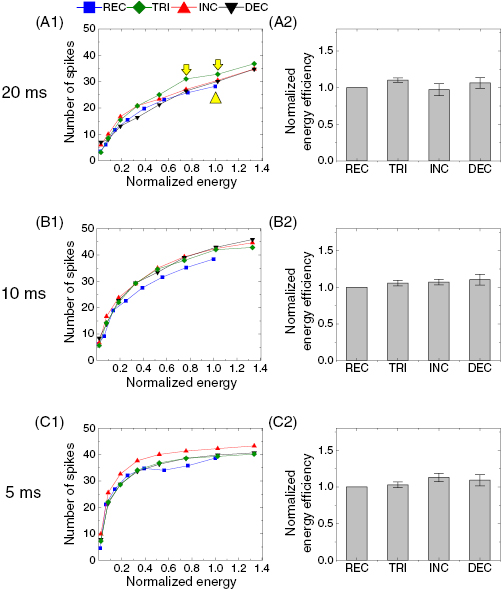
Figure 8. Energy-efficiencies for delayed burst are comparable across all stimulus waveforms. (A1) Average number of elicited spikes in the delayed burst (spike onset latency >100 ms) as a function of normalized energy in response to four waveforms at the duration of 20 ms. Electric energy of each data point in figure 7(A1) was normalized by the maximum energy delivered by the rectangular waveform (400 nC; ‒20 µA). Spike counts were averaged across all cells (n = 7). Error bars are omitted for clarity. (A2) Comparisons of normalized energy-efficiencies across responses to all waveforms at the maximum energy rectangular waveform delivered (marked with an upward yellow arrowhead in panel (A1)). Due to difference in peak current amplitudes between rectangular versus non-rectangular stimuli, the corresponding energy was lacking in non-rectangular stimuli; spike counts were estimated by interpolating two data points near the corresponding energy level (marked with downward yellow arrows in panel (A1)). Spike counts were further normalized by the spike count in response to the rectangular pulse delivering the maximum energy. Error bars indicate standard errors. (B) and (C) Same as A but for stimulus durations of 10 ms (B), and 5 ms (C). ANOVA using Holm–Sidak post-hoc comparison was applied to verify the statistical significance but no significance was found in all pairs in all panels.
Download figure:
Standard image High-resolution imageThe dependence of the response magnitude on the delivered energy is likely to be also responsible for the stronger delayed burst arising from shorter pulses (see figures 7(A1) versus (C1)). At a constant charge, a shorter pulse has bigger current amplitude than a longer pulse (e.g. −40 µA versus −10 µA for 5- and 20 ms-long REC pulses at 200 nC), resulting in the delivery of higher energy. This also suggests that the delayed burst arising from 20- and 10 ms-long pulses is also likely to be saturated at some point of total stimulus charge >400 nC (figures 7(A1)–(B1)) because the delayed burst response became saturated at the high charge level (>200 nC) of 5 ms-long pulses (figure 7(C1)). In contrast to the delayed burst, the first burst was not sensitive to the energy. For instance, the first burst showed bigger responses to longer stimulus durations that delivered smaller energy (figure 3). Moreover, there was remarkable difference between first burst responses arising from INC and DEC pulses (figure 3(A)) although they delivered the same amount of energy at the given stimulus charge. These contrasts clearly demonstrate that the two bursts of spikes arise from differing underlying mechanisms.
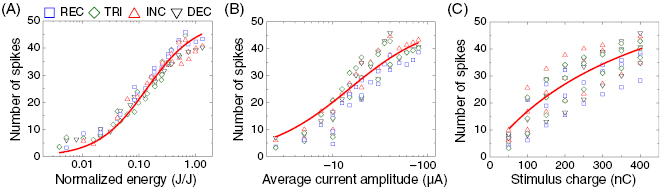
The spike counts of the delayed burst arising from all stimulation conditions (i.e. waveforms, durations, and charges) were plotted as a function of normalized energy, average current amplitude, and stimulus charge, respectively (figures 9(A)–(C)). Although the responses magnitude generally increases with increasing amplitude, of all three stimulus parameters figure 9 shows that the delivered energy plays the most critical role in controlling the response magnitude of the delayed burst arising in the ON alpha RGCs of the mouse retina. For example, all data points in figure 9(A) (i.e. average number of spikes versus normalized energy) were found to follow the fitting curve well (adjusted R2 = 0.999), which was fit by a Michaelis–Menten function with a Hill coefficient of 1 (Malchow et al 1990, Cowan et al 2016). Also, figure 9(A) suggests that the supplied energy determines response magnitude of the delayed burst regardless of waveform shapes (i.e. similar energy-efficiency irrespective of stimulus waveform). In contrast, other plots of the spike count as a function of current amplitude and stimulus charge (figures 9(B) and (C)) showed weaker clustering of data points (adjusted R2 = 0.976 and 0.764, respectively) than that of the plot with the energy (figure 9(A)). Particularly, figure 9(C) indicates that, even with a fixed amount of stimulus charge, response magnitude can vary depending on waveform shape (and stimulus duration), suggesting differing charge-efficiencies across stimulus waveforms. This is because REC stimuli delivered less electric energy than non-REC stimuli at a given charge.
Figure 9. Response magnitude of delayed burst is strongly dependent on delivered energy. Scatter plots of average number of spikes in the delayed burst versus normalized energy (A), versus average current amplitude (B), and versus total delivered charge (C). Data points are from responses arising from all stimulation conditions (i.e. durations and stimulus charges) but coded with symbols for each waveform. For example, in panel (C), three data points of an identical symbol at a given charge represent the average numbers of evoked spikes in response to the three different stimulus durations. Solid red curve in each panel shows a Michaelis–Menten function fit with a Hill coefficient of 1 (R2 = 0.999, 0.976, and 0.764 for panels (A), (B), and (C), respectively). All data points from four waveforms were used for these fittings.
Download figure:
Standard image High-resolution image
Discussion
Stimulus waveform alters indirect responses of ON alpha RGCs
In the field of neuromodulation, numerous earlier studies have studied various waveforms to determine optimal waveform that stimulate nerve cells most effectively (McIntyre and Grill 2002, Sahin and Tie 2007, Wongsarnpigoon and Grill 2010, Foutz and McIntyre 2010, Wongsarnpigoon et al 2010, Yip et al 2017). Similarly, there have been attempts to identify optimal waveform shape(s) for retinal prostheses (Suzuki et al 2004, Weitz et al 2015, Nakano et al 2017), which revealed stimulation thresholds of retinal neurons for sinusoidal waveforms were lower than those of REC waveforms. Nevertheless, the previous studies had focused on the direct activation of RGCs using short pulses (Suzuki et al 2004, Nakano et al 2017) or not classified RGC types (Weitz et al 2015). In the present work, we studied network-mediated responses arising in ON alpha cells in the mouse retina to determine optimal waveform among the four stimulus waveforms (i.e. REC, TRI, INC, and DEC). In responses to all stimulus waveforms, all ON RGCs generated two bursts of spikes (n = 7/7), suggesting that other waveforms are highly likely to evoke the similar spike pattern. Interestingly, varying waveform shapes showed distinct effects in each burst: for example, each waveform elicited distinct magnitude of first burst responses (figure 3) while three non-REC waveforms elicited a similar level of delayed burst responses (figure 7). This discrepancy suggests unique neural mechanism(s) play a role in each burst. Although we did not directly uncover the mechanisms underlying the differing effects of the waveforms in the two bursts it would be necessary to delve into details of our findings for potential reasons and more insights.
Charge injection rates of waveforms vary the first burst of indirect responses
In our study, several results suggest that response features (magnitude and latency) of the first burst is dependent on the charge injection rate of the stimulus waveform (figures 3–6). The first spike of the first burst is known to arise from direct activation of the RGC (Margalit et al 2011, Eickenscheidt et al 2012, Boinagrov et al 2014, Twyford and Fried 2016), when voltage-gated sodium channels become activated by a stimulus (Behrend et al 2009, Fried et al 2009, Sekirnjak et al 2008). Voltage-gated sodium channels are maximally activated by fast changes in the membrane potential. Accordingly, at a given charge, shorter pulses are more effective to directly activate RGCs (Fried et al 2006, Jensen et al 2003, Jensen et al 2005a), probably due to a higher charge injection rate (or higher current amplitude). Similarly, in our study, stimulus waveforms that have higher effective current amplitude (i.e. average charge injection rate until the first spike) resulted in a rapid first spike (figures 4 and 5).
It is important to note that waveform driving RGC response slower produced more number of spikes in the first burst (see figures 3(A) and (A)): INC waveform showed the longest first spike onset latency, but elicited the biggest number of spikes in the first burst. The recent work by Twyford and Fried (2016) reported that multiple spikes can be elicited by direct activation of RGCs in response to long pulses (20 and 50 ms) while one or two spikes are elicited by direct activation in response to a shorter pulse (5 ms). Consistent with this latest study, it has been reported that all but the first spike of the first burst in response to short stimulus (1–4 ms) arise secondary to the activation of bipolar cells (Jensen et al 2005b, Fried et al 2006, Eickenscheidt et al 2012, Boinagrov et al 2014). Taken all together, it seems like that 20 ms-long pulse is long enough to evoke multiple direct spikes from RGCs. Also, it is probably because the stimulus duration of 20 ms is much longer than the average refractory period of RGCs, i.e. a couple of milliseconds (Nirenberg et al 2001, Fiscella et al 2012). In the case of the long pulse (20 ms) however, RGCs may also experience desensitization because the stimulus is still on even after eliciting several spikes. In other words, long pulses are likely to be similar to repetitive stimuli with a very short 'pseudo' inter-stimulus interval, which is probably equal to the sum of spike width and refractory period. The reduction in RGC sensitivity to repetitive stimuli has been well-known as desensitization and studied with repetition of pulses ⩽4 ms (Jensen and Rizzo 2007, Freeman and Fried 2011, Im and Fried 2016a). In addition to desensitization, a portion of the stimulus current during the refractory period may serve as a depolarizing pre-pulse which is known to decrease neuronal excitability (Grill and Mortimer 1995), making an even stronger stimulus required in subsequent spikes. Particularly, the INC waveform at long duration (20 ms) substantially increased the number of elicited spikes in the first burst (figure 3(A)). This suggests the INC waveform is somewhat better than other waveforms in activating ganglion cells. For example, the gradually-increasing stimulus amplitude in the INC waveform may be required to overcome potential 'desensitization' of RGCs during the stimulus. The INC waveform in the duration of 20 ms always supplied bigger current amplitude to RGCs after each individual spike arising in the first burst, which may be suitable to overcome the aforementioned issues (i.e. desensitization and depolarizing pre-pulse) of long stimuli that reduce sensitivity of RGCs.
Given the refractory period, RGCs can just generate one or two direct spikes during a 5 ms-long stimulus, suggesting the remaining spikes in the first burst must be mediated by activated bipolar cells like in previous work reported (Jensen et al 2005b, Fried et al 2006, Eickenscheidt et al 2012, Boinagrov et al 2014). In all cases, it seems like bipolar cell activation was modest, suggesting difficulties in targeting bipolar cells. This is consistent with our recent results from stimulus durations ranging from 5 to 100 ms (Im et al 2018). In contrast to RGCs, bipolar cells do not have sodium channels with high density, thus have a slower response speed than RGCs (Pan and Hu 2000). Furthermore, the slow kinetics of calcium channels limit the ability of bipolar cells to initiate synaptic release in response to rapid fluctuations in membrane potential (Freeman et al 2011b), suggesting that stimulus waveforms which cause the membrane voltage to change abruptly would not effectively activate bipolar cells. Consistent with this, waveform shapes causing abrupt change in potential at the very beginning of the stimuli, such as DEC and REC waveforms, elicit less number of spikes than those causing gradual increase like INC and TRI (figure 3(C)). Taken all-together, it seems like all components of the first burst response is dependent on the total delivered charge and its injection rate (figures 3–6).
Supplied energy determines response magnitude of the delayed burst
We were tempted to conclude that charge-efficiency is the most critical factor for the delayed burst because there was a substantial difference across REC versus non-REC waveforms in the charge-efficiencies for the delayed burst (figure 7). However, the delayed burst was distinct from the first burst: they showed the opposite trend in terms of optimal stimulus durations in general. For example, the longer duration pulses were more effective for the first burst while so were the shorter duration pulses for the delayed burst (see figures 3 verus 7), suggesting these two bursts are modulated differently. We found that, in the delayed burst, the energy-efficiencies of all waveforms were not statistically different (figure 8) and response magnitude was strongly dependent on the delivered energy (figure 9). These results indicate that response magnitude of the delayed burst is highly likely to be determined by the total delivered energy. For the delayed burst, all waveforms showed comparable levels of energy-efficiencies (figure 8) while the REC waveform was least charge-efficient among the waveforms we explored here (figure 7). The reduced charge-efficiency of REC pulses is highly likely due to lower peak current amplitude than non-REC waveforms that results in smaller energy delivered to the retina (figure 8). In contrast to the delayed burst, the first burst showed no correlation between response magnitude and delivered energy. For example, the 20 ms-long DEC waveform exhibited a dramatic reduction in the first burst compared to the INC waveform in the same duration (figure 3(A)) although those two stimuli supplied the identical energy. The delayed burst is thought to be a rebound burst (Im and Fried 2015, Im and Fried 2016a) and our results suggest that the rebound burst requires more energy to produce more spikes (figure 9(A)). This is somewhat consistent with our previous work: in the rabbit retina, ON brisk sustained cells evoked significantly more spikes when a consecutive stimulus added more energy to the retinal network (Im and Fried 2016a). However, we did not further investigate why RGCs showed a stronger level of correlation between the number of evoked spikes and delivered electrical energy, rather than total charge of electric pulse. It will be interesting to reveal why the delayed burst is determined by the total energy.
Waveforms modulate charge- but not energy-efficiency
The present study suggests that responses of the first and delayed bursts are dependent on the supplied charge and the supplied energy, respectively. Therefore, it would be important to revisit clinical importance of charge- and energy-efficiencies. In the neural prosthetics, the charge-efficiency has long been considered an important factor deciding optimal stimulation condition. It is because higher levels of charges of electrical pulse necessitate increase of charge density at a given surface area of stimulating electrodes, resulting in faster electrode corrosion (Rose and Robblee 1990) and/or bigger tissue damage (McCreery et al 1986, 1990, Merrill et al 2005). Also, in an earlier study using finite elemental analysis, it has been predicted that Gaussian and sinusoidal waveforms may significantly decrease peak current density while retaining comparable to the REC waveform, suggesting that Gaussian and sinusoidal waveforms provide safety benefits in clinical use (Cantrell and Troy 2008). Our results demonstrated that non-REC waveforms are more charge-efficient than REC shape, thereby likely to be advantageous in the above-mentioned issues. More importantly, optimal waveform with higher charge-efficiency could allow retinal prosthetics to have smaller electrode size for higher spatial resolution, which will improve the quality of artificial vision (Weiland et al 2005, Rodger et al 2008). Thus, our results suggest that retinal prostheses can reduce electrode size using non-REC waveforms.
On the other hand, the energy-efficiency of stimulation has been another vital consideration in optimization of waveform shapes for implantable neural prostheses (Sahin and Tie 2007, Wongsarnpigoon and Grill 2010, Foutz et al 2012). This is mainly because high energy-efficient stimulation could stretch the battery life of implantable neural stimulators (or reduce the volume of stimulators), and thus lower the costs and risks associated with battery replacements (Foutz et al 2012). However, in retinal prosthetics at commercial/clinical stage, electrical power is wirelessly transmitted to intraocular components (e.g. microelectrode array) (Weiland et al 2005, Zrenner et al 2011, Stingl et al 2013) rather than an implanted battery with limited size and capacity. Although it seems like the energy-efficiency is not of significant clinical importance in retinal prosthetics, the energy should be more efficiently used to minimize a possible intraocular temperature rise due to a heat dissipation, in particular with significantly increased number of electrodes for better visual acuity. Our results demonstrated that, while all waveforms demonstrated comparable level of energy-efficiencies for the delayed burst (figure 8), the INC waveform seemed slightly better than the REC one in terms of energy-efficiency only at the duration of 20 ms (figure 3(A); ~44% more spikes but ~33% more energy at 400 nC).
Implication and limitation of this study
Because REC pulses have been typically used in retinal implants (Rizzo et al 2003, Ahuja et al 2011, Stingl et al, 2013, Shivdasani et al 2014, Fujikado et al 2016), effects of stimulation parameters of the REC waveform, such as current amplitude and stimulus duration, on response patterns of RGCs have been well-characterized. For example, it has been shown that the increase in the stimulus amplitude enhances RGC responses (Stett et al 2000, Fried et al 2006, Stett et al 2007, Tsai et al 2009). It is also reported that the stimulus duration modulates RGC activities differently (Jensen et al 2003, 2005a, Fried et al 2006, Lee et al 2013, Weitz et al 2015, Im et al 2018). However, it has been challenged whether the REC pulse is the optimal waveform shape for retinal prostheses (Suzuki et al 2004, Tahayori and Dokos 2013, Weitz et al 2015, Nakano et al 2017). Our results further support that the REC pulse is not optimal for electric stimulation of the retina. Among the four different waveforms we tested, the REC waveform was not most effective for both first and delayed bursts in terms of response magnitude. In first burst, the INC waveform elicited the strongest response at a given charge. Also, in delayed burst, the REC waveform exhibited substantially less charge-efficiency compared to other non-REC waveforms. Because we tested only four waveform shapes, our results raise a question if there is more effective waveform(s) which surpass the performance we reported here. For instance, in neural prosthetic studies, researchers have tested other waveforms including exponential increase (or decrease), Gaussian, and sinusoidal shapes (Suzuki et al 2004, Sahin and Tie 2007, Wongsarnpigoon and Grill 2010, Foutz and McIntyre 2010, Weitz et al 2015, Nakano et al 2017, Yip et al 2017). In addition to those, creative waveforms can be tested to see if they can further enhance the charge-efficiency for each burst. Though, while linear waveforms such as the REC and the TRI shapes can be generated with simple analog circuits, non-linear waveforms (i.e. exponential, Gaussian, sinusoidal, and other more creative shapes) would require integration of complex electrical circuits including high-resolution digital-to-analog converters (Foutz and McIntyre 2010), thus utilizing non-linear waveforms in retinal implants may not be practical.
This work was done in line with our previous studies that have explored optimal stimulation conditions (Im and Fried 2016a, Im et al 2018). The spiking pattern of the ON alpha RGCs in the mouse retina, which is consisted of two bursts, is remarkably similar to that of corresponding type (i.e. ON brisk sustained) of RGCs in the rabbit retina (Im and Fried 2015, Im et al 2018). This parallel suggests that our previous and present findings are likely to be reproducible in the sustained type of ON RGCs in the mammalian retinas. Like those earlier works however, the use of the healthy retina imposes limitations on our findings. In case of profound degeneration of photoreceptors, some or all delayed bursts which are mediated by activation of photoreceptors are likely to disappear. Then, it may not be feasible to achieve increased spiking in the delayed burst using non-REC waveforms at the same total charge. In contrast to the delayed burst, the first burst is highly likely to be maintained even after substantial loss of photoreceptors because RGCs and bipolar cells are known to be preserved during the retinal degeneration (Medeiros and Curcio 2001, Strettoi et al 2003). Thus, the INC waveform is likely to be still most effective for the first burst. Taken all-together, the two components (i.e. first versus delayed bursts) of ON alpha RGC responses need to be pursued depending on the progression of retinal degeneration. For example, at the early stage of degeneration, it seems that 5 ms-long non-REC pulses would be most effective in use of a given total charge because retinal prostheses may target the delayed burst that is known to be more physiological pattern of spiking than the first burst (Im and Fried 2015). However, at the advanced stage of degeneration, a 20 ms-long INC pulse would be most effective to evoke stronger responses at a given charge. However, given the fact that the first burst is less similar to their own physiological signaling pattern (i.e. light-evoked responses) than the delayed burst (Im and Fried 2015), a question arises whether a stronger first burst would lead to better quality of artificial vision. Moreover, given the significant difference in spike counts between the first and delayed bursts, it seems challenging to increase the number of spikes in the first burst to the comparable level of light-evoked responses of ON alpha RGCs in the mouse retina (or sustained types of RGCs in other mammalian retinas), at least with stimulus durations ranging from 5 to 100 ms (Im et al 2018).
Acknowledgments
We thank Andrew Hsu for his feedback on our earlier manuscript draft. This work was supported by the Henry Ford Health System (A30940 and A20056), Howard Neff Fund for Vision Rehabilitation, the Alliance for Vision Research, and the Juliette RP Vision Foundation.
Conflict of interest
The authors declare no competing financial interests.