
Abstract
Objective. Longitudinal observation of single unit neural activity from large numbers of cortical neurons in awake and mobile animals is often a vital step in studying neural network behaviour and towards the prospect of building effective brain–machine interfaces (BMIs). These recordings generate enormous amounts of data for transmission and storage, and typically require offline processing to tease out the behaviour of individual neurons. Our aim was to create a compact system capable of: (1) reducing the data bandwidth by circa 2 to 3 orders of magnitude (greatly improving battery lifetime and enabling low power wireless transmission in future versions); (2) producing real-time, low-latency, spike sorted data; and (3) long term untethered operation. Approach. We have developed a headstage that operates in two phases. In the short training phase a computer is attached and classic spike sorting is performed to generate templates. In the second phase the system is untethered and performs template matching to create an event driven spike output that is logged to a micro-SD card. To enable validation the system is capable of logging the high bandwidth raw neural signal data as well as the spike sorted data. Main results. The system can successfully record 32 channels of raw neural signal data and/or spike sorted events for well over 24 h at a time and is robust to power dropouts during battery changes as well as SD card replacement. A 24 h initial recording in a non-human primate M1 showed consistent spike shapes with the expected changes in neural activity during awake behaviour and sleep cycles. Significance. The presented platform allows neural activity to be unobtrusively monitored and processed in real-time in freely behaving untethered animals—revealing insights that are not attainable through scheduled recording sessions. This system achieves the lowest power per channel to date and provides a robust, low-latency, low-bandwidth and verifiable output suitable for BMIs, closed loop neuromodulation, wireless transmission and long term data logging.
Export citation and abstract BibTeX RIS

Original content from this work may be used under the terms of the Creative Commons Attribution 3.0 licence. Any further distribution of this work must maintain attribution to the author(s) and the title of the work, journal citation and DOI.
1. Introduction
There is currently a global effort to expand our knowledge of the brain by recording large-scale cortical neural activity over a long period of time. The 'Brain Research through Advancing Innovative Neurotechnologies' (BRAIN) Initiative in particular is looking to deliver a step change in our understanding of the brain's networks and function—a key element of this is research to advance neural recording from the current state-of-the-art (short term targeted recordings of in the order of 1000s of channels [1–3]) to round-the-clock recordings of more than 100 000 channels in freely behaving animals [4].
These ever increasing channel counts and recording periods naturally lead to an enormous amount of raw data to be stored and processed to extract useful information. For example a 100 000 channel system could well generate in excess of 10 gigabits per second of data, not to mention the requirement of recording 24 h. This presents a major obstacle for chronic operation and real-time behaviour analysis. However, raw recorded neural data is sparse and hence amenable to data compression [5–7] or techniques to extract useful information from the signal locally on the recording device [8–10]. While both these methods are effective in saving bandwidth and power [11], the latter also enables on-node analysis of individual neuron activity [12] for real-time neuroscience applications such as triggers for controlling brain–machine interfaces (BMI) without data decompression.
Understanding neural circuits, the state of the neurons in the circuit and their relationship to observed behaviour is greatly enhanced by separating out the activity of individual neurons from the melee recorded by each electrode—i.e. spike sorting [13–15]—as each neuron may encode different features of a behaviour.
Classic spike sorting (involving spike detection, feature extraction, clustering and classification) is a clustering problem in a feature space generated by principal component analysis or wavelet decomposition [8, 16, 17]. The high computational complexity of classic spike sorting methods makes them impractical for real-time portable or implantable devices with high channel counts [18–20]. In recent years there has been a move towards using a 2 step process for such applications [1, 19, 21], where: in the first step classic sorting is performed offline to identify characteristics of the spikes (i.e. training); and in the second step a computationally simpler form of spike sorting can be performed online in real-time based on classification rather than clustering. An example of this is the work of Schwarz et al [1] who implemented a system that connects a head-mounted data processor and transmitter to four 32-channel Plexon® amplifiers. The system demonstrated short term logging of 128 channels of spike sorted events or six channels of raw neural signal (due to the limited wireless bandwidth available) and also suffered from wireless transmission latency and packet loss.
This paper describes an end-to-end solution based on the aforementioned two-step process and template matching (see figure 1). The core system is capable of performing real-time template matching based spike sorting on 32 channels simultaneously and reliably recording 32-channels of spike sorted and/or raw neural signal data onto a microSD card. A tethered computer is not required although one can be attached for the training phase to provide real-time signal display [22]. During training, the templates are generated from the mean waveform of each cluster identified by the freely available Wave_Clus clustering programme (this clustering step could be performed with any clustering software). Real time classification is then performed using template matching on an FPGA. Such a system reduces the required data storage by circa 2 to 3 orders of magnitude (assuming a nominal spike rate of ten spikes per second per channel [23]), and provides an architecture which addresses the key challenges of data transmission bandwidth and system power consumption for scaling up to systems with thousands of channels. It also provides a low-bandwidth, low-latency (max 169 μs) output that describes the activity of isolated neurons—ideal for portable or implantable applications in closed-loop neuromodulation or brain machine interfaces.

Figure 1. System concept—the miniature head-mounted system amplifies, filters and spike sorts neural signals from electrodes inserted in the cortex, and the resulting spike events are either stored in local memory (as demonstrated here) or wirelessly transmitted (in future versions). During a training phase a cable to a computer is briefly attached and raw neural signal data is recorded, clustered and the resulting characteristic spike waveforms are uploaded into the headstage to enable the template matching based spike sorting.
Download figure:
Standard image High-resolution imageThe focus of this paper is system implementation and its in vivo validation, while performance of the algorithms and parameters used are analysed and previously published in [24, 25]. The system is a complete end-to-end solution (including hardware, firmware, computer graphical user interface (GUI) and data processing toolbox) that has been fully tested in vivo for several 24 h recording sessions. Specific technical implementation details have additionally been made available to the community5 Further advantages of this system include: the modular rather than monolithic design (which enables the on-node data logging to be easily replaced by a wireless transceiver or BMI); a more compact front end and spike sorting module; an increase in the number of templates per channel (and hence distinguishable neurons) from 2 to 4; and features targeted at chronic experiments such as automatic reloading of configuration data on power cycling or SD card changing.
The remainder of this paper is organised as follows: section 2 describes the system design and implementation; section 3 presents performance metrics from benchtop electronic testing as well as the results obtained from in vivo experiments; and section 4 discusses the results, limitations and expected future development of the system.
2. System design
2.1. Outline system architecture
The system (shown in figure 2) has been designed in a modular fashion with standard connectors to enable future flexibility and system reconfiguration. The core of the system is the neural interface board which performs the signal conditioning and on-node spike sorting. For initial system validation this has been paired with a custom micro-SD logging and standalone controller board capable of recording all the raw and spike sorted data as well as automatic reconfiguring the system when power is interrupted (e.g. during a battery change) or when the SD card is changed. These two boards have been designed to be small and lightweight to enable them to be head-mounted for long periods of time. In addition a benchtop data interface board can be connected through a wired link to enable data to be logged to a computer and for configuration data to be uploaded to the head-mounted boards.

Figure 2. The standalone system mounted in a 3D printed support designed to fit inside a monkey's head cradle. A 5p coin (18 mm diameter) is shown for size comparison.
Download figure:
Standard image High-resolution image2.2. Typical system operation
The system is designed to operate in two distinct phases of operation as shown in figure 3.
- (i)In the calibration phase, the head-mounted system is tethered to a computer and a 5–10 min recording of raw neural signal data is recorded and clustered using offline processing (here we use Wave_Clus [24]). Spike detection levels, characteristic templates for each of the observed spike clusters, and template matching thresholds are then uploaded for the next phase.
- (ii)During the online template matching phase, the headstage is untethered from the computer and a small, low-power FPGA is used to perform template matching based spike sorting. The resulting raw and/or spike sorted data is recorded to a micro-SD card for later analysis and validation.

Figure 3. Strategy of two-phase online spike sorting. (1) Calibration phase using a computer to generate templates offline. (2) Real-time on-node template matching where spike events are stored on an SD card.
Download figure:
Standard image High-resolution image2.3. System design rationale
Real-time on-node template matching lies at the heart of this system and typically involves three main processing steps each of which can have a substantial effect on overall efficiency and performance. This section sets out the design rationale and chosen values for these processing steps, which was guided by the work of Navajas et al [25] Their work establishes the impact of various parameters (e.g. sampling frequency, sample bit-depth and template matching method) on spike sorting performance—enabling an efficient template matching implementation to be achieved with negligible performance impact.
2.3.1. Signal conditioning and digitisation.
This includes the amplification, filtering, sampling and analogue to digital conversion of the signal. An Intan RHD2132 was used to implement this step which provided the following options: a fixed gain of 192; tunable 3rd order Butterworth low pass filter, single order analogue high pass filter and single order IIR digital high pass filter; up to 30 kSamples s−1; and a 16-bit analogue to digital converter (ADC). For action potential data the high pass corner was set to approximately 300 Hz as a balance between the modelled best setting for a high pass Butterworth filter, the band of interest and the need to reject power line interference (although the filter can also be tuned to record local field potentials (LFPs)). The low pass corner was set to 3 kHz to reduce high frequency noise and balance performance against the reduced data rate of sampling at a rate of 15 kSamples s−1. Modelling in [25] had also shown that the sample depth could be reduced to as low as 7-bits without significantly impacting spike sorting performance, in this work we converted the 16-bit signal to a 9-bit value to retain a higher dynamic range while reducing the data rate, processing requirements, and also to make efficient use of the memory structures of the FPGA used to perform the spike detection and template matching. The 9-bits to be used are user configurable at run time, but in practice the 9-bits chosen are rarely changed as the most significant bits (MSBs) of the ADC are impractically large for neural signals and the noise floor of the front end is approximately 16 times the least significant bit (LSB) of the ADC (2.4 μV versus 0.195 μV).
2.3.2. Spike windowing.
This step includes detection of the spikes, peak alignment and the windowing of the neural spike to be compared to the template. Spike detection is not essential for template matching—e.g. Schwarz et al continuously test every incoming sample against templates—however, it can greatly reduce the amount of processing required in the template matching step and therefore increases system efficiency. This is a step that is highly parallel and was a key driver for utilising an FPGA (which can run many parallel calculations at a low clock speed) rather than a microcontroller (which would have required a high clock speed and hence high power consumption). Spike detection can be achieved by a variety of approaches, but simply detecting an absolute threshold crossing remains an efficient and high performance solution [26–28] and was the chosen approach for this system with spike thresholds user configured on a per-channel basis (automatically calculated from the standard deviation of the median filtered noise [24]). Spike detection, alignment and windowing were performed using a state machine for each channel in conjunction with the rolling input buffer and an 8-bit comparator. The absolute value of each incoming sample is compared to that channel's spike threshold in one clock cycle, and the peak value of the current spike in the next. Depending on the outcomes of these comparisons the state machine: tracks whether a spike has been detected; tracks the peak value of the window; and counts up to a specified number of samples after the peak. This has the effect of detecting, windowing and aligning the spikes into (in this case) a window of five samples before the peak and ten after the peak (16 samples total). A pointer for the start of the spike in memory is then queued in a first in, first out (FIFO) buffer for template matching processing.
2.3.3. Template matching.
This step includes the scoring of the differences between an incoming windowed spike snippet and a characteristic waveform (templates) of previously observed spikes, as well as the final classification of a spike. Navajas et al reviewed numerous methods for comparing waveforms and there were two clear leading algorithms in the tradeoff between performance and efficiency—Norm 1 (sum of absolute difference) and Euclidean distance (sum of squared difference). In this instance (due to the lack of dedicated multiplication resource on the chosen FPGA) the Norm 1 implementation (shown in figure 4) utilised significantly less logic elements and was preferred.

Figure 4. Calculation of template matching scores—an incoming spike waveform is compared against each of the templates and the sum of absolute difference for each pairing is calculated.
Download figure:
Standard image High-resolution image2.4. System implementation
Figure 5 shows a block diagram breakdown of the key components across the three boards that make up the system. As shown the head-mounted boards can be powered either by a battery or from isolated USB power when tethered. When two power sources are available, a diode prevents uncontrolled current flowing into the battery and, due to its higher voltage, USB power is prioritised.

Figure 5. System architecture of the proposed platform with inset photos showing the corresponding head mounted modules. The link to computer is USB 3.0.
Download figure:
Standard image High-resolution image2.4.1. Data flow.
The front end neural signal acquisition provides 32 channels of signal conditioning and digitisation. The data is streamed out to a small low power FPGA over an serial peripheral interface (SPI) link. The FPGA performs signal manipulation to reduce the 16-bit sample to 9-bits before performing timestamping, and in normal operation it also performs spike detection and template matching (as depicted in figure 6) before packaging the sorted result and/or raw neural signal data into 16-bit words for transmission. These words flow into one or both of the FPGA's 2 output FIFO buffers—a large one feeding the wired SPI link (with the FPGA as slave), and a small one feeding the SPI link to the controller board (with the FPGA as master).

Figure 6. Data processing in the FPGA. The red line indicates data flow for template matching, while the blue dotted line indicates the data flow for raw neural signal data.
Download figure:
Standard image High-resolution image2.4.2. Control and communication.
Control and configuration of the headstage is typically performed through the wired link during the calibration phase. While this upload is happening the microcontroller receives copies of these settings and backs them up to specifically named files on the SD card. Then if power is interrupted during normal untethered operation the microcontroller will read the configuration files and upload these values to the headstage restoring the programmed configuration. This also means that it is possible to operate the system completely without the wired link by simply putting appropriately coded files onto an SD card, inserting the card and power cycling the controller board. The full list of FPGA configurable registers are listed in table 1, in addition to this are the settings required for the Intan front end (as specified on datasheet).
Table 1. Configurable registers on FPGA.
| Description | Bits | Scope | Total bits |
|---|---|---|---|
| Operation mode |
4 | Global | 4 |
| LSB re-mapping |
3 | Global | 3 |
| Sampling rate divider |
4 | Global | 4 |
| Spike detection threshold | 9 | Channel | 288 |
| Templates | 576 | Channel | 18432 |
| Matching threshold | 64 | Channel | 2048 |
aSets raw neural signal and/or sorted spike events output on the two links. bControls the conversion of 16-bit samples to 9-bit. cControls the global clock division.
2.4.3. Clock control.
Reducing clock speed is a key factor in improving system power performance. Here the sampling rate of the ADC and two FPGA clocks are derived by integer division (between 2–16) down from an off-chip clock running at 19.2 MHz. With nominal settings the sampling rate is at ∼15 kS s−1 per channel (with an SPI clock speed of 9.6 MHz) and the two FPGA clock domains (for communication and data processing) are in turn divided down to 4.8 MHz and 2.4 MHz. All these frequencies are intrinsically linked (based on clock cycles necessary to process the data), so for efficient capture of low frequency LFPs the global integer division can be set to 16 giving a sampling speed of ∼2 kS s−1 (SPI clock at 1.2 MHz) and clocks of 600 kHz and 300 kHz.
2.4.4. Data logging.
In this instance the system has been equipped with a controller board for logging data. The core component of this board is a K64F microcontroller which implements three SPI interfaces (as shown in figure 7) which receive data from the wired connection and from the FPGA and also enables control of the FPGA for recovery on power cycling.

Figure 7. Data (red lines) and configuration (blue lines) flow between the head mounted modules. The FPGA controls the bidirectional flow of information (data and configuration) between the microcontroller and the Intan front end as described in sections 2.4.1 and 2.4.2. It communicates with the microcontroller via two SPI interfaces handling data and configuration respectively. Within the FPGA: a 'frontend driver' module communicates with the analogue frontend for configuration and data fetching, a 'spike sorting engine' module processes the data in real-time, and a 'central control unit' controls the various modules.
Download figure:
Standard image High-resolution imageThe microcontroller receives data and uses a direct memory access (DMA) channel to pass the data to the micro-SD card via an SDHC interface. For system validation purposes the aim was to record all raw and spike sorted data, as such the data output rate of the system was ∼11 Mbps. This may not at first seem challenging (any class 10 SD card can write at 80 Mbps), however, the latency of typical SD cards can exceed 100 ms and presents a substantial challenge due to the data buffering requirements and limited memory on a microcontroller. As a result this system required careful code optimisation to maximise the memory available for buffering and align writing block size with sectors; and this combined with a U3 grade micro-SD card (with an average latency around 10 ms) ensured data integrity in repeated long term testing. Since the total amount of data generated for 24 h is approximately 109 GB when logging all data including both the raw signal and sorted spike events, a 128 GB card is required and the exFAT file system was used to enable large multi gigabyte files to be stored.
2.5. Computer interface
The system can be tethered to a PC using the data interface board which converts between an SPI interface and USB 3.0. A USB 3.0 interface is not required for 32 channels, however, the data interface board was designed to be scalable by connecting up to 32 neural interface boards simultaneously in parallel—streaming up to 1024 channels of raw and spike sorted data to the computer and increasing the total data rate to approximately 350 Mbps. In order to handle this high data rate, each bit sent over the 32 parallel MISO data lines from these boards is read in as a 4 byte word and this data is communicated directly to the USB interface using a DMA channel.
2.6. User operation
In order to configure the system for untethered recording, the user needs to follow the procedure listed below to complete the training phase before untethered operation. See the supplementary material for more detail, available at (stacks.iop.org/JNE/15/046014/mmedia).
- (i)Insert a SD card to the system then connect it to the implanted electrodes and computer.
- (ii)Open the GUI to configure amplifier settings to avoid clipping the signal.
- (iii)Start streaming data to the computer for template generation with Wave_Clus.
- (iv)Review the automatically generated templates and modify if necessary.
- (v)Upload the system configuration to SD card and disconnect the computer.
The above steps can be finished within 20 min during a normal subject behaviour training session.
3. Results
3.1. System specification tests
The system was tested with benchtop equipments including a neural signal generator before in vivo deployment. The hardware performance is summarised in table 2.
Table 2. Specifications for key components.
| Neural interface PCB | |
|---|---|
| Sampling rate | 15.8 kSample s−1 |
| Word length | 9-bit |
| Spike detection | Single threshold |
| Threshold range | 9-bit |
| Classification method | Template matching |
| Alignment method | Peak |
| Template length | 16 samples (1 ms) |
| Template align offset | 5 samples (from abs.) |
| Distance measure | Sum of abs. difference |
| Template/channel | 4 |
| Resource utilisation | 98% |
| Total memory | ∼36 kbits |
| Weight | 1.78 g |
| Power | 14.52 mW (Event), 14.75 mW (Signal + Event) |
| Dimension | 26 mm × 14 mm × 4 mm |
| Controller PCB | |
| Weight | 1.73 g (1.99 g with micro-SD) |
| Power | 47.42 mW (Event), 84.74 mW (Signal + Event) |
| Dimension | 22 mm × 15 mm × 5 mm |
Data integrity was tested by replacing the ADC's output data with a simple counter on the FPGA—giving a known signal with the same data bandwidth as in real recording—and checking the sequence stored on the SD-card. A battery of 5200 mAh supports recording up to ∼52 h when recording both spike events and the raw neural signal. This differs from a simple calculation of battery capacity divided by measured power consumption due to the dropping battery output voltage over a discharge cycle.
3.2. In vivo recording
The system was validated in vivo in a rhesus macaque with moveable microwire electrodes (50 μm tungsten, tip-impedence ∼500 kΩ) [23] implanted into the motor cortex (M1) and protected with surgical cement and a skull mounted titanium case. A cradle to hold the platform against the case was 3D-printed to fit inside the head case as shown in figure 8. This helps prevent the device from falling off and damaging the implanted electrodes when monkey moves. All experiments were approved by the local ethics committee and performed under appropriate UK Home Office licenses in accordance with the Animals (Scientific Procedures) Act 1986.

Figure 8. Experimental setup for the 24 h recordings with a rhesus monkey. Twelve tungsten wire electrodes are connected to the recording module. A cap with battery included was secured on top of the cradle.
Download figure:
Standard image High-resolution imageTwo 24 h sessions were performed. In the first session (44 d after electrode implantation), the system was configured to record only action potentials with on-line spike sorting. Once configured, the system was left recording for a 24 h duration while the monkey was freely moving in her home cage. A total of 12 electrodes were connected across which 21 different cells were detected. A total of 13 431 217 spike events were recorded over the 24 h session (or more precisely 87 386 s). This corresponds to each electrode observing an average of 1.75 neurons, with each neuron having an average spike rate of 7.3 spikes s−1. A summary of the recorded activity is given in table 3.
Table 3. Summary of the recorded activity and spikes classified in the first 24 h session.
| Channel # | Cells (assigned templates) | Spikes classified (over 24 h) | Total spikes detected | ||
|---|---|---|---|---|---|
| Template 1 | Template 2 | Template 3 | |||
| 1 | 2 | 115 010 | 132 819 | — | 247 829 |
| 2 | 2 | 349 221 | 207 011 | — | 556 232 |
| 3 | 2 | 865 000 | 404 734 | — | 1269 734 |
| 4 | 2 | 302 240 | 356 414 | — | 658 654 |
| 5 | 3 | 2800 420 | 572 501 | 800 074 | 4172 995 |
| 6 | 2 | 161 879 | 139 822 | — | 301 701 |
| 7 | 1 | 94 499 | — | — | 94 499 |
| 8 | 2 | 201 976 | 198 550 | — | 400 526 |
| 9 | 2 | 199 663 | 208 943 | — | 408 606 |
| 10 | 1 | 2926 326 | — | 2926 326 | |
| 11 | 0 | — | — | — | — |
| 12 | 2 | 547 691 | 1842 424 | — | 2390 115 |
| Total | 21 | — | — | — | 13 431 217 |
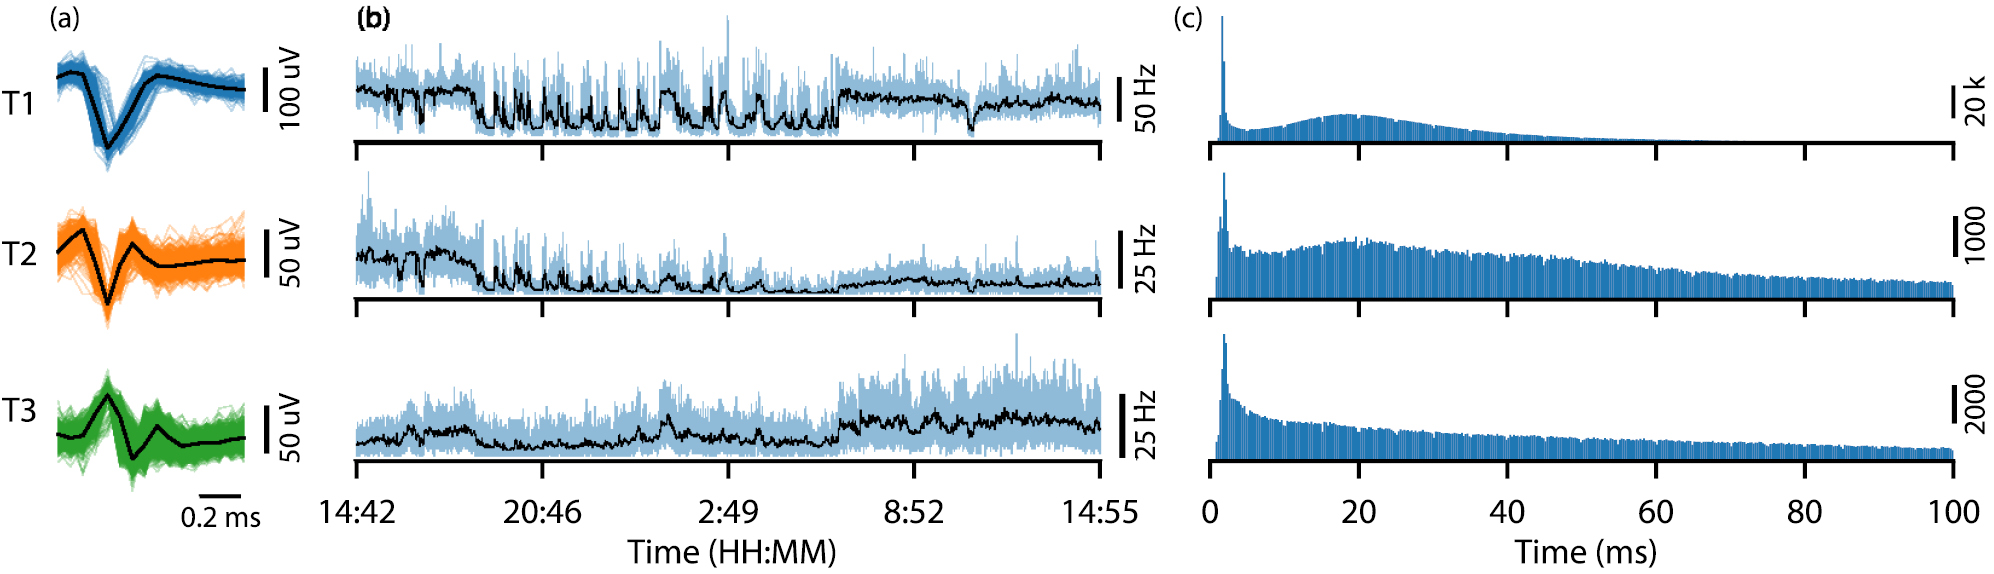
The channel with the most units detected (#5) is shown in figure 9. A two minute initial recording was used for clustering and four different templates were generated. Template 4 was merged into template 1 due to a close similarity. Figure 10 shows the resulting three spike templates (with the first 1000 matched spikes) together with firing rates and inter-spike intervals (ISI) for channel #5 during the 24 h session. The changes in firing rate during sleep can be clearly marked. It can, however, also be observed (from the ISI diagrams) that for this channel templates T1, T2 and T3 may contain more than one cell. This is observed due to the presence of short intervals in the ISI histogram that are less than the expected physiological refractory period of a single neuron.

Figure 9. Extracellular neural recording (for channel #5) showing sorted spike events (in real-time) during the first 24 h session. (a) and (b) are spike events and neural signal for the whole recordings showing consistent amplitude and constant operation throughout; (c) and (d) show a 30 s segment as marked by the dashed red line; Templates (e) generated using 2 min recording before the experiment using Wave_Clus.
Download figure:
Standard image High-resolution image
Figure 10. Example spike event data (for channel #5) generated during the first 24 h recording session. Shown are: (a) peak aligned and sorted first 1000 matched spikes and the characteristic templates; (b) spike firing rates averaged over 1 s (light blue) and 1 min (black); and (c) inter-spike interval (ISI).
Download figure:
Standard image High-resolution imageAn off-line analysis with Wave_Clus yielded similar results demonstrating that this particular channel is challenging to sort for both online and offline sorters. Figure 11 shows a different recording channel (#3) where two units can be clearly identified.

Figure 11. Example spike event data (for channel #3) generated during the first 24 h recording session. Shown are: (a) peak aligned and sorted first 1000 matched spikes and the characteristic templates; (b) spike firing rates averaged over 1 s (light blue) and 1 min (black); and (c) inter-spike interval (ISI).
Download figure:
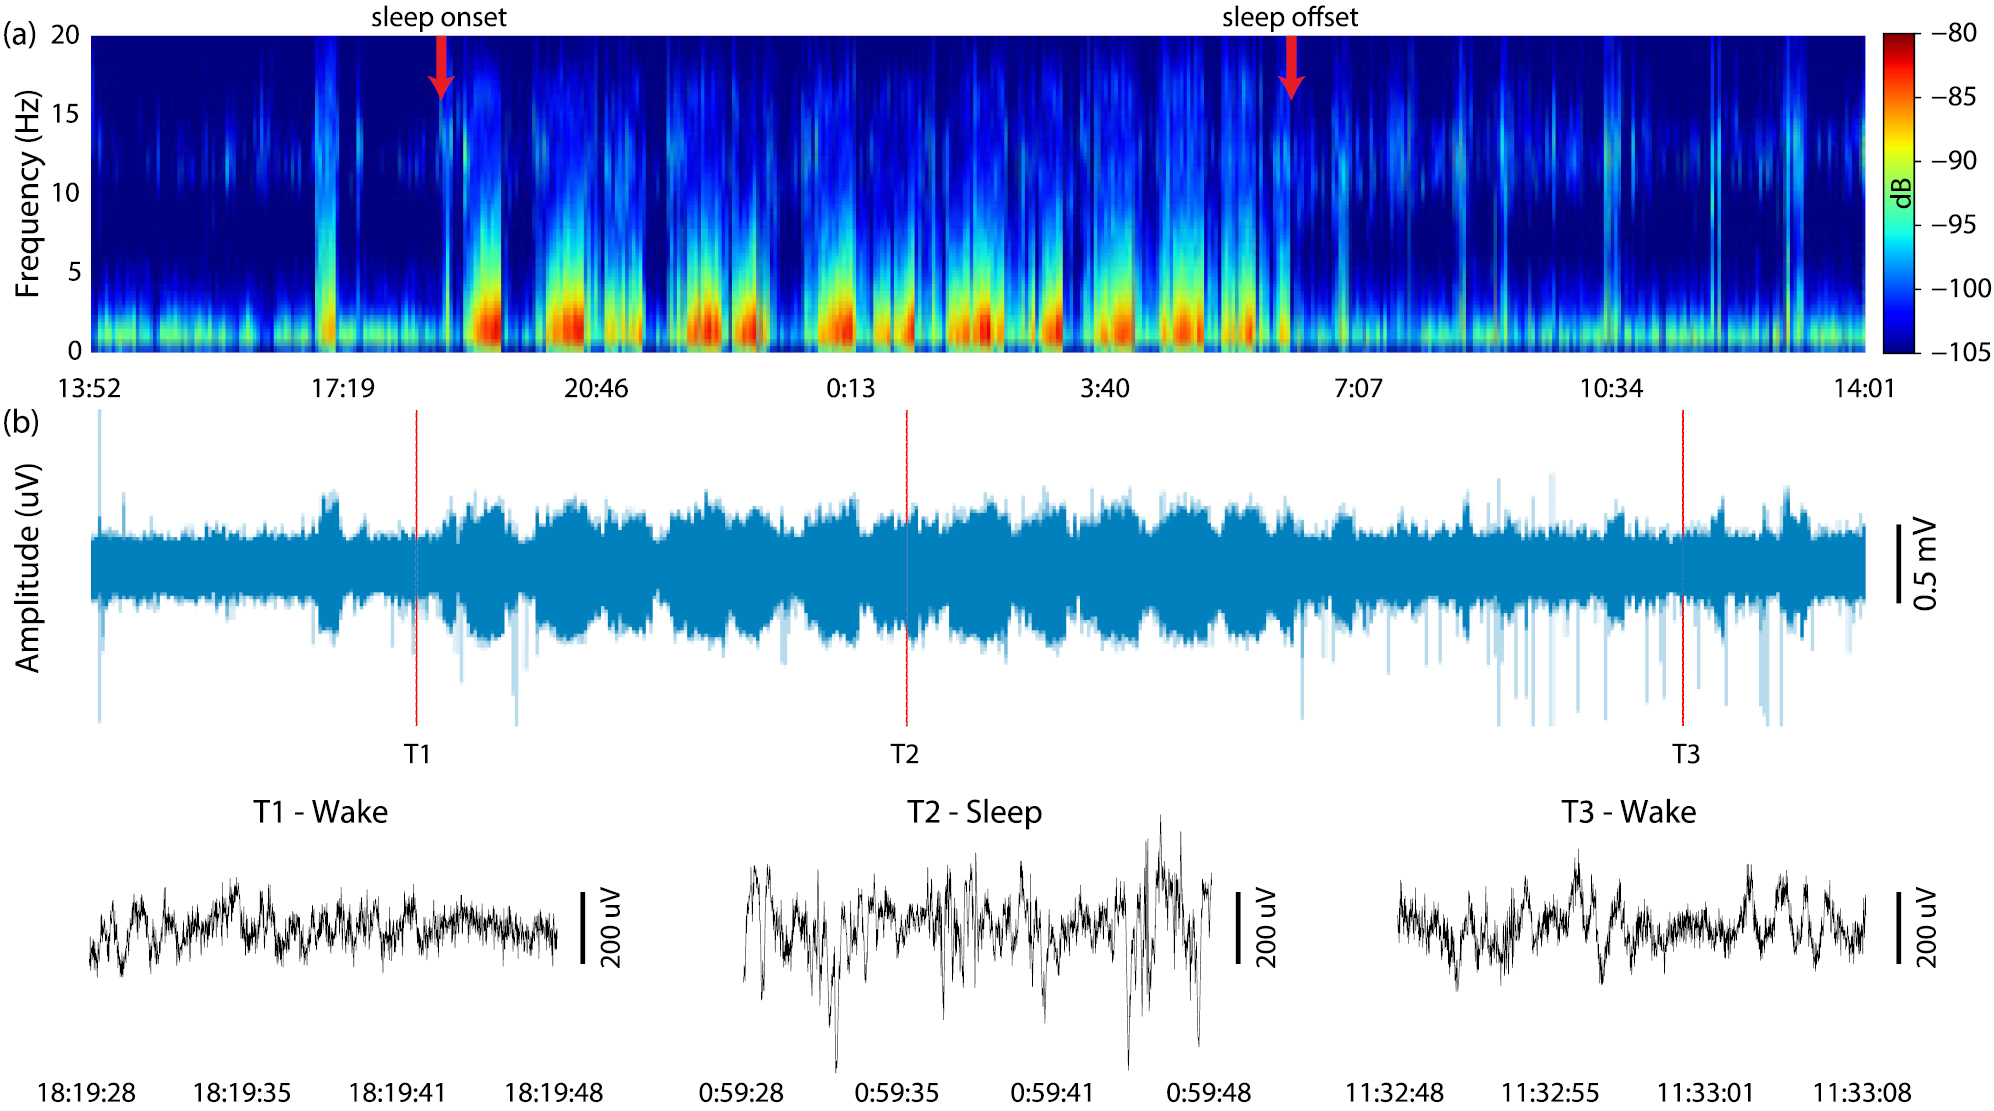
Standard image High-resolution imageIn the second session, the micro-SD card was replaced during a behavioural training session and the system was configured to use a wideband filter to record both action potentials and LFPs. Offline down sampling was used to show the LFP signal and its spectrogram in figure 12. The increased power in the low frequency (<20 Hz) can be attributed to the activity expected during sleep. The hours of sleep are consistent with the period identified previously and individual sleep cycles can be observed.

Figure 12. (a) Calculated spectrogram with sleep onset and cessation annotated; (b) Recorded LFP signal with magnified insets.
Download figure:
Standard image High-resolution image3.3. Power consumption
The power consumption was measured using an Agilent N6782A SMU (source measure unit) instrument. The idle power consumption was 52.83 mW (with SD card inserted) rising to a maximum of 99.45 mW when saving both the raw neural signal and spike event data to the SD card. The power when saving only spike events is 61.94 mW. A breakdown of the measured power budget is shown in figure 13. Apart from the FPGA core which is running at 1.5 V, all other I/O and chips are running at 3.3 V. It should be noted that the idle current consumption is dominated by the microcontroller (∼82% of idle power) and that the power consumed by the spike sorting FPGA is minimal (<5.8% power in the worst case spike sorting only mode).

Figure 13. Breakdown of the power consumption for different modes of operation.
Download figure:
Standard image High-resolution image3.4. Data reduction
The data storage required for recording the raw digitised neural signal for 24 h per channel (including data encoding) is:

For the 12-channels utilised in the 24 h recordings previously presented, this corresponds to a total data requirement of 33.14 GB. Whereas the actual recorded spike sorted data size was merely 112.85 MB. This includes the classified spike events (13 427 217 total spikes requiring 2-bytes each occupying a total of 26.85 MB) and timing (2-byte timestamp inserted every 32 samples occupying a further 86.29 MB). This corresponds to an average data reduction factor of approximately  .
.
4. Discussion
The system presented here has successfully demonstrated 24 h on-node spike sorting. This has enabled the capture of valuable data during untethered sleep showing characteristic patterns of reduced motor cortex spiking activity and patterns of LFP power spectral density modulation. This small and low power device enables massive data compression (and hence power reduction) while also providing triggers that could be invaluable for other event driven systems.
The spike sorting front end was paired in this instance with miniaturised SD-card logging. This was due to a desire to reliably record neural signal and spike sorted data from our 32-channel headstage for validation purposes while minimising power consumption and hence battery size and weight for 24 h trials. Our estimates of likely power consumption (see figure 14) indicated that flash memory represented the lowest power off-the-shelf solution to our data logging needs and also demonstrated the significant impact that spike sorting can have on system logging capability, power consumption and battery lifetime. Table 4 shows a comparison to similar platforms.

Figure 14. Estimate of power consumption for transmission (by bluetooth low energy or WiFi 802.11g/ac) or local logging of data for exponentially increasing numbers of channels of neural signal or spike sorted data. Key assumptions include: a sampling rate of 16 kHz and an average spike rate of ten spikes/s/channel. Wifi power estimates are based on a minimum range and low congestion scenario with <100 ms packet latency.
Download figure:
Standard image High-resolution image
Table 4. Comparison with the state-of-the-art spike sorting implementations.
| References (units) | 2010 [31] | 2011 [32] | 2014 [1] | 2015 [33] | 2017 [34] | 2017 [35] | This work |
|---|---|---|---|---|---|---|---|
| # Channels — | 32 | 3 | 512 | 1024 | 128 | 128 | 32 |
| Power/Ch. (mW) | 4.43 | 109.33 | 2.06 | 6.84 | N/A | N/A | 1.94 |
| Data storage — | Wireless | SDCard (⩽2 GB) | Wireless | SATA & | No | USB 3.0 | USB 3.0/SDCard (no capacity limits) |
| Sorting method — | None | TAWD | TM | None | TM | TM | TM |
| Sorting on headstage — |  |
 |
|||||
| Event latency (μs) | N/A | N/A | N/A | N/A | 90.635 | N/A | 12–169 |
| Auto-start — | N/A | N/A | N/A | N/A | N/A | N/A |  |
| Size |
28 × 2 × 13 | 35 × 35 × 20 | 13.7 × 21.5 × 1.6 |
150 × 160 × 20 | N/A | 150 × 130 | 26 × 14 × 4 |
| 43 × 21 × 3.4 |
22 × 15 × 5 |
||||||
| Weight |
N/A | 36 | N/A | 164 | N/A | N/A | 1.99 |
Note: Δ 12 μs in uncongested typical case; 169 μs when each of 32 channel has a simultaneous spike (worst case scenario, highly unlikely) TM = Template matching, TAWD = time-amplitude window discriminator. aExcl. battery and electrodes. bHeadstage. cInterface. dSpike events. eSignal + spike events.
One key limitation of the current system is that once templates have been determined, they remain fixed for the duration of the recording. This means that changes in unstable recordings of spike waveforms are not tracked. The stability of neural recordings will depend on many factors including the design of electrodes, brain regions targeted and surgical techniques used. Chronic, moveable microwire arrays such as we used here [29] can readily record stable spike activity over days to, in some cases, months (see also [30]). Thus we were able to demonstrate 24 h recordings with our current system using a single calibration session. However, when used with less stable recording electrodes, more frequent recalibration may be required. One possibility might be to use statistical analysis of spike events that did not match a current template as an indicator of when recalibration is required, although we have not yet investigated this.
4.1. Expandability
Underpinning our design was the desire to create a device that rather than simply demonstrating technology, will actually be used on a day-to-day basis by widespread neuroscience groups. As such the system has been designed to be highly flexible and enables us to rapidly extend capability by adding, for example, a bidirectional wireless link or a neuromodulation device.
4.2. Recording duration
For a compact system like the one presented here, the maximum continuous operating time is typically limited by the capacity of the battery and/or the data storage media. This is a complex function of recording mode, number of channels enabled, filter and ADC settings and spike rate. In our case, for all 32-channels used for continuous recording in signal + events mode, a maximum of 50.97 h was measured. The total data storage required is 185.5 GB, which does not require a change of SD card. If all 32 channels operate record only spike events, the projected values are 81.87 h continuous recording and 225 MB of data based on the power and data reduction ratio reported in section 3.
In both cases, the 5200 mAh battery used was not fully discharged but the system stopped at 3.65 V due to the required overhead of our regulators. If high efficiency DC-DC regulators are used and a 400 GB micro-SD card (the highest capacity currently available), then the maximum continuous recording time for 32-channels in signal + events mode will be ∼107 h (limited by data storage) and ∼156.8 h (limited by battery). If the system is however operated in spike events mode (i.e. recording, spike sorting, and storing only the classified spike event times), both the system power consumption (figure 13) and memory requirements are significantly reduced, resulting in a continuous operating time of ∼252 h (around 10.5 d) that is limited only by battery.
4.3. Future work
Technological advances mean that there are already substantial improvements we will be making to our system design. In particular it is worth noting that all the spike detection and sorting in this system was performed on a small (5 mm × 5 mm), low power and relatively old technology (130 nm) FPGA, however, technology scaling offers significant potential to increase the channel count while also reducing the power consumption and footprint. Indeed we have since successfully ported the code to an FPGA family offering 6 times smaller footprint, 30 times as much memory (a key limiting factor on channel count or templates per channel) and 3 times lower core power consumption. Moving to an ASIC design could offer a further step change in system performance and capability. Similarly the microcontroller core power consumption tracks with the technology and reducing the current consumption to a small fraction of its current level is feasible.
Changes to the front end (signal conditioning) ASIC are another aspect with potential for system-wide impact [28, 36]. The current front end is designed for generic biopotential recording and as a result its core power consumption is unnecessarily high (for this application). Power consumption could also be greatly reduced by moving the spike detection into the front end as this could reduce the data rate output at this stage by around 2 orders of magnitude [37, 38].
In the near term we are looking at a variety of algorithm enhancements that could improve template matching performance (e.g. by pre-manipulation of the templates [39]) or identify and potentially track changes in templates due to electrode drift and fibrous encapsulation—reducing calibration requirements and enhancing system performance for chronic recordings. While in the long term we would look to leverage commercial technology scaling to enable integration of on-line naive spike sorting for hundreds of channels—scaling, enhancing and making viable existing approaches [40, 41].
5. Conclusion
Challenges abound for delivering the next generation of neural interface technology. As the number of recording channels increases by orders of magnitude so too will the data rate as well as the power required for data transmission and the storage requirements. It is therefore clear that simply scaling existing electrode arrays, connectors, electronic designs or wireless bandwidth will not deliver the performance required in future and that fundamentally new approaches are required. Spike sorting on the node is a key enabling capability in dealing with the coming data barrage and for creating untethered BMIs and closed loop event driven neuromodulation. The system presented here represents our first efforts to deploy this capability into the neuroscience community.
Acknowledgment
This research is funded by Engineering and Physical Sciences Research Council (EPSRC) EP/I000569/1, EP/H051570/1, EP/H051651/1, EP/K015060/1. We thank Dr Jennifer Tulip and Dr Wei Xu from Newcastle University for their support on in vivo experiments and data analysis.