

Abstract
When verifying the validity of the exponential-decay law through 137 precise decay rate measurement series at various nuclear laboratories, minor violations have been observed in the shape of annual cycles in the residuals with different amplitudes and phase shifts. The timing and amplitude of these deviations have been compared with local weather data and it appears that ambient humidity is highly correlated with the observed instabilities in these radioactivity measurements. In fact, when compensating the residuals for a linear relationship with absolute humidity in air, most of the annual cycles are no longer statistically significant. As a result, the validity of the exponential-decay law can now be demonstrated with even higher fidelity.
Export citation and abstract BibTeX RIS

Original content from this work may be used under the terms of the Creative Commons Attribution 4.0 license. Any further distribution of this work must maintain attribution to the author(s) and the title of the work, journal citation and DOI.
1. Introduction
Science-based decision making crucially depends on the quality of the metrology from which it derives its information [1, 2]. Measurements with incomplete uncertainty budgets can lead to misinterpretations of the phenomena under investigation, possibly with fundamental implications in science and policy making [3]. One of the most persistent misunderstandings concerning radionuclide metrology is the assertion that cyclic variations in measured decay rates are caused by space weather phenomena, in particular by neutrinos emitted from the Sun or dark matter [4]. Some authors are adamant in their claims that observed violations of the exponential-decay law cannot be attributed to environmental conditions in the laboratory [5, 6]. However, using historical weather data available on meteorological websites, a link with terrestrial weather could be established for several infamous experiments [1, 2, 4, 7–19].
The most obvious weather attribute suspected of influencing activity measurements would be temperature, hence the common practice to stabilise the room temperature in nuclear laboratories by circulation of heated or cooled air. The air conditioning system may also affect the air humidity in the room, however not every system is set up to keep the absolute humidity stable. The ambient air humidity outside the building easily enters the ventilated rooms of the laboratory and affects the behaviour of detectors and their electronics as well as the circulation of radon and travel paths of radioactive particles in air. It may be true that ambient humidity is an often overlooked culprit of instability in activity measurements. One could argue that its effects are generally insignificant in the uncertainty budget of absolute activity measurements. Few metrologists will consider small humidity-induced effects in the context of e.g. alpha spectrometry [20] or routine gamma-ray spectrometry [21], considering that the measurement uncertainty typically ranges from 2% to 30%. It is even seldom taken into account in primary standardisation methods for activity [22–28], where uncertainties can go down to 0.1% or even lower [29–31].
Nevertheless, there are circumstances in which the impact of tiny instabilities in activity measurements gains significance. This applies mainly to precise relative measurements, and in particular to half-life measurement series, which can be interpreted as a chain of relative activity measurements over time [32]. The repeatability requirement of half-life experiments exceeds that of absolute measurements by one or more orders of magnitude. For example, better than 0.02% medium-term stability was demonstrated in alpha decay with planar Si detectors [33, 34] and repeatability in an ionisation chamber (IC) is of the order of 0.04% [35]. That explains why half-life measurements are a magnifying glass for underlying metrological imperfections and why their uncertainties have often been underestimated in the literature [32, 36–38]. Not controlling such sources of error and their propagation gives room to alternative interpretations of an experiment. Therefore, when annual cycles in activity measurement series are observed [39], it is incumbent upon the metrological community to provide an explanation and to take corrective action.
In former work, some of the most precise and extensive activity measurement series from laboratories across the world were analysed to investigate the hypotheses that solar neutrinos induce annual and monthly cycles in decay due to variations in Earth–Sun distance [7–10] and internal solar dynamics [12], respectively. Contrary to the monthly cycles, some of the annual cycles were statistically significant, but they were not aligned in phase or amplitude. On this basis, the 'solar neutrino-induced decay' hypothesis could be rejected. In this work, ambient humidity is investigated as a plausible culprit for the occurrence of the annual cycles. Using historical weather data from nearby stations, a linear relationship is established between ambient humidity (or dew point) and residuals from exponential decay. The amplitudes of the annual cycles are redetermined after compensating the residuals for this hypothetical humidity effect. If the magnitudes of the cycles can be reduced below statistically significant levels, the hypothesis gains credibility, and the validity of the exponential-decay law can be confirmed with higher fidelity.
2. Analysis of decay rate series at JRC
2.1. Ambient humidity
Data from a temperature (T) and relative humidity (Hr) monitor inside the radionuclide metrology laboratory 35 A in building 010 of the JRC in Geel were extracted to calculate the absolute humidity (Ha) through the ideal gas equation [40]

in which the quantities must be expressed in the indicated units, and Ps represents a heuristic formula for the saturation vapour pressure above water as a function of temperature [41]

The equation (2) is considered accurate enough (≈0.1% for T between −30 °C and +35 °C) without applying an enhancement factor (for moist air compared to pure water vapour, as a function of atmospheric pressure) or a different approximation below 0 °C [42, 43].
Starting from the relationship Hr/100 = Ps(TD)/Ps(T), the dew point TD can be derived from the measured temperature and relative humidity through [44]

with

These data measured inside the laboratory in Geel will be compared with external data from a weather station [45] in the Antwerp airport, located about 43 km away.
The JRC laboratories use an air circulation system that establishes underpressure in certain containment areas and regulates the temperature typically within (21 ± 1) °C. However, there have been some variations in the system's settings over the years, as well as exceptional periods where the system (or sensors) did not function adequately. Figure 1(a) displays the relationship between inside and outside daily average temperatures over the past decade. The inside temperature remains relatively stable during colder days, but there is a slight positive quadratic trend overall. Despite the strong correlation between activity measurements in the ionisation chamber IC1 [1, 2, 46, 47] and outside temperature, they are only weakly correlated with the inside temperature. Therefore, the inside temperature is not the main driving force behind IC1's seasonal effect, and air humidity in the room is more likely the culprit.

Figure 1. Relationship between (a) inside vs outside daily average temperature, (b) inside vs outside absolute humidity with linear trendline, (c) inside vs outside dew point, (d) deviation of inside humidity from the trendline as a function of outside dew point. The data were collected over the period 2013–2022 in laboratory 35 A, where the ionisation chamber IC1 is located, and compared with matching data from the weather station in the airport of Antwerp. (In figures (b) and (d), a small fraction of deviant data were filtered to enhance the most common trend.).
Download figure:
Standard image High-resolution imageFigures 1(b) and (c) show the relationships between inside and outside absolute humidity and dew point, respectively. There is a linear relationship between the humidity data, except at the most humid days (outside Ha> 10.3 g m−3) when the inside humidity is visibly flattened by the air-conditioning system. A similar plot is obtained for inside versus outside dew point, since part of the humidity in the incoming air condensates as soon as the dew point exceeds the temperature of the cooling element. The mechanism is more pertinently visible in figure 1(d), which depicts the deviation of the inside humidity Ha from a linear relationship with outside humidity Ha as a function of the outside dew point TD. The graphs also indicate that weather data collected tens of kilometres away are representative of the external conditions surrounding the laboratory.
2.2. 22Na and 134Cs in IC1
The decay curves of a single 22Na source [46] and two 134Cs sources [47] have been regularly monitored in the ionisation chamber IC1 from 2010 to 2022. The residuals of the measured activity rates to an exponential decay function exhibit a high negative correlation (ρ= −0.55 and ρ= −0.59) with the absolute ambient humidity. Figure 2 shows the averaged residuals of the two 134Cs sources binned by corresponding absolute humidity values outside the laboratory, with a bin width of 0.2 g m−3. There is a clear downward linear trend of the residuals between 3 g m−3 and 11 g m−3, which appears to break at higher humidity levels. This can be attributed to the drying effect of the laboratory's air-conditioning system. A similar trendline has been observed in the 22Na data [46].

Figure 2. Average values and standard uncertainty of residuals to exponential decay of 134Cs in JRC's ionisation chamber IC1 in Geel, binned as a function of ambient humidity obtained from a weather station in Antwerp.
Download figure:
Standard image High-resolution imageThe ambient humidity undergoes a seasonal cycle that follows the average ambient temperature, as heat drives evaporation of water and increases the humidity capacity of air. Due to their sensitivity to humidity, the 22Na and 134Cs activity measurements in IC1 exhibit an annual cycle with an amplitude of 0.0055% and a phase shift of 50 d. Figure 3 confirms that this cycle is well synchronised with ambient humidity, and less so with the Earth–Sun distance (as seen in the variation in solar neutrino flux) or local temperature.
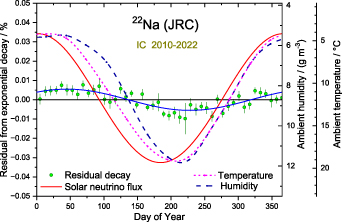
Figure 3. Average residuals from exponential decay for 22Na decay rates measured in IC1, binned over fixed periods in the year, and a fitted sinusoidal cycle through the data. The lines represent the expected relative change in solar neutrino flux hitting Earth (full line), the average ambient temperature (short dash) and humidity (long dash).
Download figure:
Standard image High-resolution image2.3. Power of annual cycle
The amplitude A of the annual cycle in the residuals from exponential decay is determined from a weighted fit of a sinusoidal function f(x) = Ax, in which x= sin((t+ a)/365), t is the day of the year, and a the phase shift. To account for uneven distributions of x, the amplitude is normalised to A' = A
 . The statistical uncertainty on A' (when generated by normally distributed noise) is easily calculated from the uncertainty of the weighted mean of the residuals,
  [48]. The ratio
  determines the power S= k2/2 and the probability P= e−S
that a power above S may be produced from random noise.
determines the power S= k2/2 and the probability P= e−S
that a power above S may be produced from random noise.
The method used in previous work [7–10] differs slightly as the data were binned in time zones and the uncertainty of the amplitude was derived by changing its value until the chi-squared (χ2) of the fit varied by unity. In this work, the power of the annual cycle in decay series will be compared before and after compensation for a humidity effect. For example, the power of the 134Cs and 22Na cycles dropped from 124 and 54 to statistically acceptable levels of 3.8 and 2.9, respectively.
2.4. Other nuclides
Other nuclides, including 54Mn, 65Zn, 177Lu, 109Cd, 124Sb, and 226Ra, have been measured in the same IC [49–53]. Although these data sets are less elaborate, they also exhibit a humidity effect. Extensive decay rate series of two 209Po sources measured with Si detectors show no significant correlation with humidity [34, 35]. The same conclusion applies to repeated activity measurements of 3H and 14C in a liquid scintillation detector (LSC) [9], 55Fe in an x-ray counter with defined solid angle using a gas counter [54] and a large pressurised gas proportional counter [55], as well as a combination of 230U decay rates taken with a CsI sandwich spectrometer, LSC, pressurised proportional counter, and planar Si detectors [56]. The findings are summarised in table 1.
Table 1. Characteristics of the decay rate measurement sets analysed: (i) decay mode, (ii) radionuclide, (iii) institute at which the measurement series was performed, (iv) method acronym (explained below the table
| Raw data | Humidity-compensated | ||||||||
|---|---|---|---|---|---|---|---|---|---|
| Decay mode(s) | Nuclide | Institute | Method | Period/year | #Data | Amplitude A'/% | Power S | Amplitude A'/% | Power S |
| β− | 3H | JRC | LSC | 2002–2014 | 706 | 0.052 (22) | 2.7 | 0.035 (22) | 1.2 |
| β− | 3H | NIST | IGC | 1963–1999 | 17 | 0.22 (28) | 0.3 | 0.21 (28) | 0.3 |
| β− | 14C | JRC | LSC | 2002–2014 | 706 | 0.012 (15) | 0.3 | 0.009 (15) | 0.2 |
| β− | 14C | NMISA | TDCR | 1994–2014 | 32 | 0.05 (9) | 0.1 | 0.05 (9) | 0.1 |
| β−, EC | 36Cl | PTB | LSC | 2009–2013 | 66 | 0.0041 (16) | 3.2 | 0.0032 (16) | 1.9 |
| β− | 60Co | NIST | IC | 1973–2007 | 198 | 0.001 (9) | 0.0 | 0.010 (9) | 0.7 |
| β− | 60Co | NIST | LTAC | 2006–2014 | 26 | 0.013 (15) | 0.4 | 0.014 (15) | 0.4 |
| β− | 60Co | PTB | IC K | 2016–2020 | 649 | 0.0138 (12) | 64 | 0.0036 (12) | 4.4 |
| β− | 60Co | PTB | IC U | 2019–2022 | 471 | 0.0042 (18) | 2.6 | 0.0021 (18) | 0.7 |
| β− | 60Co | JSI | HPGe | 1998–2016 | 14 942 | 0.018 (16) | 0.6 | 0.018 (16) | 0.6 |
| β− | 60Co | IAEA | HPGe #12 | 2018–2023 | 121 | 0.19 (10) | 1.7 | 0.18 (10) | 1.5 |
| β− | 60Co | IAEA | HPGe #15 | 2018–2023 | 149 | 0.33 (13) | 3.4 | 0.18 (13) | 1.0 |
| β− | 60Co | IAEA | HPGe 100 | 2018–2022 | 169 | 0.09 (9) | 0.5 | 0.07 (9) | 0.3 |
| β− | 60Co | IAEA | HPGe 170 | 2018–2022 | 123 | 0.33 (14) | 2.8 | 0.33 (14) | 2.8 |
| β− | 85Kr | PTB | IC K | 1999–2020 | 2432 | 0.0020 (20) | 0.5 | 0.0010 (20) | 0.1 |
| β− | 85Kr | PTB | IC U | 2019–2022 | 379 | 0.008 (5) | 1.4 | 0.002 (5) | 0.1 |
| β− | 90Sr | PTB | IC K | 1999–2016 | 1986 | 0.023 (2) | 52 | 0.012 (2) | 15 |
| β− | 90Sr | PTB | TDCR | 2013–2014 | 4493 | 0.0036 (14) | 3.5 | 0.0036 (14) | 3.6 |
| β− | 124Sb | JRC | IC | 2007 | 55 | 0.0032 (21) | 1.2 | 0.0031 (21) | 1.1 |
| β− | 124Sb | PTB | IC K | 2007–2008 | 232 | 0.007 (5) | 0.8 | 0.001 (5) | 0.0 |
| β− | 134Cs | JRC | IC | 2010–2022 | 1268 | 0.0051 (3) | 124 | 0.0009 (3) | 3.8 |
| β− | 137Cs | PTB | IC K | 1999–2020 | 2149 | 0.0013 (9) | 1.0 | 0.0007 (9) | 0.2 |
| β− | 137Cs | PTB | IC U | 2019–2022 | 415 | 0.0083 (22) | 7.4 | 0.0066 (22) | 4.7 |
| β− | 137Cs | NIST | IC | 1973–2007 | 229 | 0.004 (9) | 0.1 | 0.004 (9) | 0.1 |
| β− | 137Cs | IRA | IC | 1997–2012 | 135 | 0.014 (10) | 0.9 | 0.007 (10) | 0.2 |
| β− | 137Cs | NRC | IC #1-3 | 1995–2009 | 51 | 0.030 (15) | 2.0 | 0.005 (15) | 0.1 |
| β− | 137Cs | IAEA | HPGe #12 | 2018–2023 | 120 | 0.05 (9) | 0.2 | 0.05 (9) | 0.2 |
| β− | 137Cs | IAEA | HPGe #15 | 2018–2023 | 146 | 0.18 (10) | 1.7 | 0.14 (10) | 1.0 |
| β− | 137Cs | IAEA | HPGe 100 | 2018–2022 | 168 | 0.16 (9) | 1.6 | 0.12 (9) | 0.9 |
| β− | 137Cs | IAEA | HPGe 170 | 2018–2022 | 127 | 0.23 (13) | 1.7 | 0.07 (13) | 0.2 |
| β+, EC | 22Na | JRC | IC | 2007–2022 | 524 | 0.0054 (5) | 54 | 0.0013 (5) | 2.9 |
| β+, EC | 22Na | NIST | IC | 1968–1982 | 87 | 0.018 (13) | 0.9 | 0.012 (13) | 0.4 |
| EC | 54Mn | JRC | IC | 2006–2009 | 156 | 0.0047 (11) | 9.5 | 0.0026 (11) | 2.7 |
| EC | 54Mn | PTB | IC | 2010–2016 | 716 | 0.014 (3) | 12 | 0.004 (3) | 1.3 |
| EC | 55Fe | JRC | PC | 2004–2005 | 595 | 0.0044 (17) | 3.4 | 0.0030 (17) | 1.6 |
| EC | 55Fe | JRC | PPC | 2001–2018 | 47 | 0.005 (8) | 0.2 | 0.003 (8) | 0.1 |
| EC | 57Co | NIST | IC | 1962–1966 | 73 | 0.060 (24) | 3.2 | 0.058 (24) | 3.0 |
| EC, β+ | 65Zn | JRC | IC | 2002–2003 | 92 | 0.007 (6) | 0.7 | 0.011 (6) | 1.7 |
| EC(,β+) | 82Sr/82Rb + 85Sr | NIST | IC | 2007–2008 | 158 | 0.0006 (25) | 0.0 | 0.0018 (25) | 0.3 |
| EC(,β+) | 82Sr/82Rb | NIST | HPGe | 2007–2008 | 25 | 0.11 (13) | 0.4 | 0.07 (13) | 0.2 |
| EC, IT | 108mAg | PTB | IC K | 1999–2020 | 2361 | 0.0196 (16) | 80 | 0.0043 (16) | 3.8 |
| EC, IT | 108mAg | PTB | IC U | 2019–2022 | 411 | 0.007 (4) | 1.7 | 0.003 (4) | 0.3 |
| EC | 109Cd | JRC | IC | 2006–2010 | 123 | 0.0111 (21) | 13 | 0.0071 (21) | 5.4 |
| EC | 109Cd | NIST | IC | 1976–1981 | 167 | 0.013 (12) | 0.6 | 0.008 (12) | 0.2 |
| EC | 109Cd | JSI | HPGe | 1998–2016 | 5311 | 0.052 (36) | 1.1 | 0.050 (36) | 1.0 |
| EC | 133Ba | NIST | IC | 1979–2012 | 130 | 0.030 (6) | 12 | 0.011 (6) | 1.5 |
| EC | 133Ba | PTB | IC K | 1999–2020 | 2437 | 0.004 (5) | 0.4 | 0.004 (5) | 0.4 |
| EC | 133Ba | PTB | IC U | 2019–2022 | 417 | 0.020 (11) | 1.8 | 0.009 (11) | 0.4 |
| EC, β−, β+ | 152Eu | NIST | IC | 1976–2011 | 96 | 0.024 (9) | 4.0 | 0.017 (9) | 2.1 |
| EC, β−, β+ | 152Eu | PTB | IC K | 1999–2020 | 2367 | 0.0072 (13) | 16 | 0.0016 (13) | 0.8 |
| EC, β−, β+ | 152Eu | PTB | IC U | 2019–2022 | 421 | 0.014 (5) | 4.3 | 0.014 (5) | 4.4 |
| EC, β−, β+ | 152Eu | NPL | HPGe | 2017–2023 | 265 | 0.28 (9) | 5.3 | 0.11 (9) | 1.4 |
| EC, β−, β+ | 152Eu | SCK | HPGe #8 | 2008–2017 | 3 × 498 | 0.057 (27) | 2.3 | 0.051 (27) | 1.8 |
| EC, β−, β+ | 152Eu | SCK | HPGe #10 | 2008–2016 | 3 × 470 | 0.075 (18) | 8.4 | 0.049 (18) | 3.7 |
| EC, β−, β+ | 152Eu | SCK | HPGe #11 | 2008–2017 | 3 × 501 | 0.071 (22) | 5.2 | 0.058 (22) | 3.4 |
| EC, β−, β+ | 152Eu | SCK | HPGe #13 | 2008–2017 | 3 × 519 | 0.163 (25) | 21 | 0.052 (25) | 2.3 |
| EC, β−, β+ | 152Eu | SCK | HPGe #16 | 2008–2016 | 3 × 452 | 0.066 (16) | 8.9 | 0.058 (16) | 7.0 |
| EC, β−, β+ | 152Eu | SCK | HPGe #17 | 2014–2017 | 3 × 186 | 0.043 (22) | 1.8 | 0.039 (22) | 1.5 |
| EC, β−, β+ | 152Eu | SCK | HPGe #20 | 2013–2019 | 3 × 332 | 0.005 (31) | 0.0 | 0.015 (31) | 0.1 |
| EC, β−, β+ | 152Eu | SCK | HPGe #21 | 2008–2017 | 3 × 419 | 0.018 (24) | 0.0 | 0.019 (24) | 0.1 |
| EC, β−, β+ | 152Eu | SCK | HPGe #23 | 2011–2017 | 3 × 282 | 0.089 (35) | 3.2 | 0.067 (35) | 1.8 |
| EC, β−, β+ | 152Eu | SCK | HPGe #24 | 2011–2017 | 3 × 308 | 0.017 (16) | 0.6 | 0.016 (16) | 0.5 |
| EC, β−, β+ | 152Eu | SCK | HPGe #25 | 2011–2017 | 3 × 325 | 0.017 (16) | 6.2 | 0.016 (16) | 2.3 |
| EC, β−, β+ | 152Eu | SCK | HPGe #26 | 2013–2017 | 3 × 248 | 0.030 (24) | 0.8 | 0.018 (24) | 0.3 |
| EC, β−, β+ | 152Eu | SCK | HPGe #27 | 2011–2017 | 3 × 304 | 0.070 (31) | 0.8 | 0.019 (31) | 0.3 |
| EC, β−, β+ | 152Eu | SCK | HPGe #28 | 2014–2017 | 3 × 187 | 0.036 (22) | 1.4 | 0.033 (22) | 1.2 |
| EC, β−, β+ | 152Eu | SCK | HPGe #8 | 2019–2022 | 3 × 199 | 0.146 (42) | 6.2 | 0.147 (42) | 6.2 |
| EC, β−, β+ | 152Eu | SCK | HPGe #9 | 2020–2022 | 3 × 137 | 0.059 (29) | 2.0 | 0.019 (29) | 0.2 |
| EC, β−, β+ | 152Eu | SCK | HPGe #10 | 2019–2022 | 3 × 217 | 0.082 (34) | 2.9 | 0.083 (34) | 2.9 |
| EC, β−, β+ | 152Eu | SCK | HPGe #11 | 2020–2022 | 3 × 129 | 0.059 (45) | 0.9 | 0.067 (45) | 1.1 |
| EC, β−, β+ | 152Eu | SCK | HPGe #13 | 2019–2022 | 3 × 214 | 0.031 (36) | 0.4 | 0.033 (36) | 0.4 |
| EC, β−, β+ | 152Eu | SCK | HPGe #14 | 2019–2022 | 3 × 191 | 0.090 (29) | 5.0 | 0.094 (29) | 5.3 |
| EC, β−, β+ | 152Eu | SCK | HPGe #19 | 2019–2022 | 3 × 197 | 0.061 (28) | 2.5 | 0.060 (28) | 2.4 |
| EC, β−, β+ | 152Eu | SCK | HPGe #21 | 2019–2022 | 3 × 182 | 0.094 (50) | 1.8 | 0.077 (50) | 1.2 |
| EC, β−, β+ | 152Eu | SCK | HPGe #22 | 2020–2022 | 3 × 87 | 0.029 (35) | 0.8 | 0.008 (35) | 0.0 |
| EC, β−, β+ | 152Eu | SCK | HPGe #23 | 2019–2020 | 3 × 58 | 0.059 (53) | 0.6 | 0.065 (53) | 0.8 |
| EC, β−, β+ | 152Eu | SCK | HPGe #24 | 2021–2022 | 3 × 91 | 0.035 (34) | 0.5 | 0.020 (34) | 0.2 |
| EC, β−, β+ | 152Eu | SCK | HPGe #25 | 2019–2022 | 3 × 168 | 0.056 (23) | 2.9 | 0.023 (23) | 0.5 |
| EC, β−, β+ | 152Eu | SCK | HPGe #26 | 2019–2022 | 3 × 193 | 0.099 (39) | 3.2 | 0.052 (39) | 0.9 |
| EC, β−, β+ | 152Eu | SCK | HPGe #27 | 2019–2022 | 3 × 194 | 0.106 (39) | 3.8 | 0.097 (39) | 3.2 |
| EC, β−, β+ | 152Eu | SCK | HPGe #28 | 2019–2022 | 3 × 194 | 0.048 (29) | 1.4 | 0.041 (29) | 1.0 |
| EC, β−, β+ | 152Eu | SCK | HPGe #30 | 2019–2022 | 3 × 155 | 0.040 (23) | 1.6 | 0.022 (23) | 0.5 |
| EC, β−, β+ | 152Eu | SCK | HPGe #31 | 2019–2022 | 3 × 182 | 0.039 (23) | 1.5 | 0.017 (23) | 0.3 |
| EC, β−, β+ | 152Eu | SCK | HPGe #32 | 2020–2022 | 3 × 10⁵ | 0.095 (62) | 1.2 | 0.082 (62) | 0.9 |
| β+, EC | 154Eu | PTB | IC K | 1999–2020 | 2494 | 0.0066 (8) | 35 | 0.0018 (8) | 2.7 |
| β+, EC | 154Eu | PTB | IC U | 2019–2022 | 415 | 0.004 (3) | 0.7 | 0.003 (3) | 0.3 |
| EC (,β+) | 207Bi | NIST | IC | 1971–2011 | 152 | 0.031 (9) | 6.5 | 0.011 (9) | 0.8 |
| α | 209Po | JRC | PIPS | 2013–2022 | 6291 | 0.0028 (24) | 0.7 | 0.0032 (24) | 0.9 |
| α + β− | 226Ra | JRC | IC | 2005–2015 | 1244 | 0.0036 (22) | 1.3 | 0.0033 (22) | 1.1 |
| α + β− | 226Ra | BIPM | IC | 2001–2022 | 206 | 0.0026 (19) | 0.9 | 0.0023 (19) | 0.7 |
| α + β− | 226Ra | NPL | IC | 1996–2016 | 3714 | 0.0042 (7) | 18 | 0.0018 (7) | 3.3 |
| α + β− | 226Ra | NPL | IC | 1997–2016 | 3746 | 0.0020 (20) | 0.5 | 0.0011 (20) | 0.2 |
| α + β− | 226Ra | NIST | IC | 2012–2016 | 272 | 0.001 (7) | 0.0 | 0.002 (7) | 0.0 |
| α + β− | 226Ra | PTB | IC K | 1999–2020 | 1380 | 0.0113 (15) | 28 | 0.0039 (15) | 3.4 |
| α + β− | 226Ra | PTB | IC U | 2019–2022 | 344 | 0.004 (3) | 0.9 | 0.004 (3) | 0.9 |
| α + β− | 226Ra | ANSTO | IC | 2008–2014 | 1743 | 0.004 (19) | 0.0 | 0.010 (19) | 0.0 |
| α + β− | 226Ra | ANSTO | IC | 2012–2016 | 852 | 0.0050 (29) | 1.5 | 0.0003 (29) | 0.0 |
| α | 228Th | NIST | IC | 1968–1978 | 70 | 0.030 (24) | 0.8 | 0.028 (24) | 0.7 |
| α | 230U | JRC | mix | 2011 | 4731 | 0.004 (6) | 0.2 | 0.008 (6) | 0.9 |
| α | 241Am | NPL | IC | 2020–2022 | 521 | 0.0053 (15) | 2.4 | 0.0010 (15) | 0.2 |
| α | 241Am | PTB | LSC | 2014–2016 | 574 | 0.0007 (11) | 0.2 | 0.0004 (11) | 0.1 |
| α | 241Am | JSI | HPGe | 1198–2014 | 2852 | 0.13 (7) | 1.6 | 0.12 (7) | 1.2 |
| α | 241Am | IAEA | HPGe #12 | 2018–2023 | 122 | 0.14 (9) | 1.3 | 0.01 (9) | 0.0 |
| α | 241Am | IAEA | HPGe #15 | 2018–2023 | 148 | 0.46 (12) | 7.8 | 0.20 (12) | 1.4 |
| α | 241Am | IAEA | HPGe 100 | 2018–2022 | 167 | 0.18 (10) | 1.8 | 0.16 (10) | 1.4 |
| α | 241Am | IAEA | HPGe 170 | 2018–2022 | 129 | 0.06 (16) | 0.1 | 0.10 (16) | 0.2 |
| α | 241Am | SCK | HPGe #8 | 2008–2017 | 500 | 0.030 (27) | 0.6 | 0.019 (27) | 0.3 |
| α | 241Am | SCK | HPGe #10 | 2008–2016 | 482 | 0.095 (20) | 12 | 0.037 (20) | 1.9 |
| α | 241Am | SCK | HPGe #11 | 2008–2017 | 487 | 0.052 (21) | 3.0 | 0.047 (21) | 2.4 |
| α | 241Am | SCK | HPGe #13 | 2008–2017 | 517 | 0.142 (26) | 15 | 0.051 (26) | 2.1 |
| α | 241Am | SCK | HPGe #16 | 2008–2015 | 409 | 0.049 (22) | 2.4 | 0.039 (22) | 1.6 |
| α | 241Am | SCK | HPGe #17 | 2014–2017 | 189 | 0.131 (32) | 8.6 | 0.064 (32) | 2.2 |
| α | 241Am | SCK | HPGe #20 | 2013–2019 | 317 | 0.149 (50) | 4.4 | 0.152 (50) | 4.9 |
| α | 241Am | SCK | HPGe #21 | 2008–2017 | 412 | 0.081 (49) | 1.4 | 0.079 (49) | 1.2 |
| α | 241Am | SCK | HPGe #23 | 2010–2017 | 354 | 0.179 (54) | 5.5 | 0.167 (54) | 4.8 |
| α | 241Am | SCK | HPGe #24 | 2011–2017 | 307 | 0.017 (16) | 0.6 | 0.016 (16) | 0.5 |
| α | 241Am | SCK | HPGe #25 | 2011–2017 | 326 | 0.108 (21) | 13 | 0.048 (21) | 2.4 |
| α | 241Am | SCK | HPGe #26 | 2013–2017 | 245 | 0.018 (22) | 0.3 | 0.017 (22) | 0.3 |
| α | 241Am | SCK | HPGe #27 | 2011–2017 | 305 | 0.153 (72) | 2.3 | 0.128 (72) | 1.6 |
| α | 241Am | SCK | HPGe #28 | 2014–2017 | 193 | 0.011 (28) | 0.1 | 0.006 (28) | 0.0 |
| α | 241Am | SCK | HPGe #8 | 2019–2022 | 207 | 0.148 (55) | 3.7 | 0.134 (55) | 3.0 |
| α | 241Am | SCK | HPGe #9 | 2020–2022 | 121 | 0.160 (52) | 4.8 | 0.150 (52) | 4.3 |
| α | 241Am | SCK | HPGe #10 | 2019–2022 | 213 | 0.091 (37) | 3.1 | 0.040 (37) | 0.6 |
| α | 241Am | SCK | HPGe #11 | 2019–2022 | 126 | 0.019 (53) | 0.4 | 0.015 (53) | 0.0 |
| α | 241Am | SCK | HPGe #13 | 2019–2022 | 217 | 0.098 (41) | 2.9 | 0.066 (41) | 1.3 |
| α | 241Am | SCK | HPGe #14 | 2019–2022 | 193 | 0.101 (145) | 0.2 | 0.097 (145) | 0.2 |
| α | 241Am | SCK | HPGe #19 | 2019–2022 | 180 | 0.126 (42) | 4.4 | 0.059 (42) | 1.0 |
| α | 241Am | SCK | HPGe #21 | 2019–2022 | 182 | 0.107 (93) | 0.7 | 0.090 (93) | 0.5 |
| α | 241Am | SCK | HPGe #22 | 2020–2022 | 101 | 0.056 (54) | 1.0 | 0.066 (54) | 0.8 |
| α | 241Am | SCK | HPGe #23 | 2019–2020 | 64 | 0.072 (81) | 0.9 | 0.073 (81) | 0.4 |
| α | 241Am | SCK | HPGe #24 | 2021–2022 | 84 | 0.067 (29) | 2.3 | 0.057 (29) | 2.0 |
| α | 241Am | SCK | HPGe #25 | 2019–2022 | 174 | 0.063 (25) | 2.6 | 0.027 (25) | 0.6 |
| α | 241Am | SCK | HPGe #26 | 2019–2022 | 184 | 0.085 (36) | 2.4 | 0.040 (36) | 0.6 |
| α | 241Am | SCK | HPGe #27 | 2019–2022 | 171 | 0.145 (92) | 1.6 | 0.147 (92) | 1.3 |
| α | 241Am | SCK | HPGe #28 | 2019–2022 | 177 | 0.050 (40) | 1.2 | 0.038 (40) | 0.5 |
| α | 241Am | SCK | HPGe #30 | 2019–2022 | 155 | 0.070 (22) | 3.2 | 0.063 (22) | 4.2 |
| α | 241Am | SCK | HPGe #31 | 2019–2022 | 182 | 0.087 (22) | 3.9 | 0.060 (22) | 3.8 |
| α | 241Am | SCK | HPGe #32 | 2020–2022 | 104 | 0.094 (63) | 1.5 | 0.079 (63) | 0.8 |
a Acronyms: LSC liquid scintillation counting; IGC internal gas counting; TDCR triple-to-double coincidence counting ratio; IC ionisation chamber (K Keithley electrometer readout; U ULCA ultrastable low-noise current amplifier); LTAC live-time anti-coincidence counting; HPGe high-purity germanium detector; PPC pressurised proportional counter; PIPS planar Si detector.
3. Measurements at other metrology institutes
3.1. Procedure
Additional evidence has been collected from metrology institutes in various locations. The obtained decay rate series were optimised to detect annual cycles by removing outlying data points and compensating apparent discontinuities or systematic trends with time using linear functions covering relatively large time periods. Weather data were collected from nearby weather stations (Weather Underground, 2023) and a linear regression analysis was conducted to establish a linear relationship  between the absolute ambient humidity,
  , and the residuals from exponential decay,
  . Activity data without corresponding humidity measurements were excluded from analysis. The amplitude and power of annual cycles in activity series were determined before and after compensation for the hypothesised humidity effect (
 ), and the results are summarised in table 1.
3.2. NIST
The NIST has provided historical decay measurements of various nuclides, including 22Na, 60Co, 82Sr, 109Cd, 133Ba, 137Cs, 152Eu, 207Bi, 228Th, and 226Ra, obtained with ICs [57, 58]. Additionally, a decay series of 60Co was measured by coincidence counting, 3H by internal gas counting, and 82Sr by γ-ray spectrometry with a HPGe detector. Humidity data were extracted from the weather station at the Washington Dulles Airport (Sterling). To suppress the influence of instabilities on the measurements obtained from the 'IC A' chamber, the source current was taken relative to that of a 226Ra reference source. As a result, a mild annual cycle was observed in the measurements, which was reduced after compensation for the hypothesised humidity effect.
Direct evidence of the sensitivity of instruments to environmental factors was collected in the new laboratory wing of the NIST. The behaviour of the 'AutoIC' chamber was continuously monitored by performing source and background measurements while the climate control system generated short-term cyclic variations in temperature and humidity in the laboratory. Figure 4 illustrates how the ionisation current for a 223Ra source in the 'AutoIC' chamber follows the environmental changes with a delay of approximately an hour. This information was persuasive in efforts to prioritise improved climate control as part of the ongoing construction project.

Figure 4. Relative change in ionisation current from a 223Ra source in the 'AutoIC' ionisation chamber at the NIST as a function of time, compared to short-term changes in temperature and absolute humidity in the laboratory generated through the climate control system.
Download figure:
Standard image High-resolution image3.3. PTB
Over the years, the PTB has applied three different current measurement methods for their IC (type IG12, 20th Century Electronics, UK); a Townsend balance until 1999, a Keithley electrometer until 2020, and currently an Ultrastable Low-Noise Current Amplifier (ULCA). As a result, the detector has shown different sensitivity to environmental influences. It has already been demonstrated in previous work [8, 59–62] that the Townsend balance appeared to be susceptible to radon concentration in air, which explains the annual cycles observed in the pre-1999 data sets. These data are not further considered in the paper.
More recent data sets were provided for 11 radionuclides: 54Mn, 60Co, 85Kr, 90Sr, 108mAg, 133Ba, 124Sb, 137Cs, 152Eu, 154Eu, and 226Ra. Those obtained with the Keithley electrometer generally show some humidity effects, which reduce to an acceptable level after compensation based on humidity data from the Langenhagen weather station. A peculiar case is the beta emitter 90Sr measured in the IC, which manifests a significant annual cycle with power S= 52, as shown in figure 5. It would appear that the cycle is synchronised with ambient humidity to a large extent, but there is additional structure due to local instabilities in the data set. There is a gradient in the residuals of −0.0045% per g m−3 humidity. Besides that, other influential factors in the measurement conditions may have played a role. As a result, a linear correction proportional with humidity reduces the power of the cycle to S = 15, but does not completely cancel the annual trend.

Figure 5. Average residuals from exponential decay for 90Sr decay rates measured at the PTB in an IC, binned over fixed periods in the year. The lines represent the expected relative change in solar neutrino flux hitting Earth (full line), the average ambient temperature (short dash) and humidity (long dash).
Download figure:
Standard image High-resolution imageThe ULCA, developed by PTB [63, 64], has been introduced to measure small currents with low noise and high gain stability. While the 2020–2022 data sets appear to be independent of humidity, there is still some variance present that can be partly attributed to imperfections in geometrical replication of the source positioning using a robot arm. In general, the amplitudes of the fitted annual cycles are statistically insignificant, but reside at the high side of the Rayleigh probability distribution. It should be noted that in order to mitigate the influence of environmental effects in normal praxis, the PTB conducts its calibrations relative to a 226Ra reference source.
The PTB [65, 66] generated particularly stable decay series measurements of 36Cl, 90Sr, and 241Am by means of liquid scintillation counting, applying TDCR in the case of 36Cl and 90Sr and a commercial LSC for 241Am. The data show no correlation with humidity. Undisclosed results of ongoing 32Si decay rate measurements promise exceptional stability, in contrast with the seasonal variations observed in the BNL/Purdue data [67, 68], which were found to be correlated with ambient humidity [17, 18].
3.4. NPL
At the NPL (UK), a long history of 226Ra check source measurements was provided for two well-type re-entrant ICs: a PA782 (2 MPa argon gas, steel inner well) and a Vinten (1 MPa nitrogen gas, 3 mm Al inner well), as well as a more recent series of 241Am measurements in the Vinten IC. Only data obtained since July 1996 could be used in the study, upon the availability of weather information from the Hounslow weather station. The residuals show the presence of a significant annual sinusoidal deviation from exponential decay, which clearly correlates with ambient humidity. Evidence is shown in figure 6. In addition, a series of gamma-ray measurements with lower precision showed a hint of a humidity effect which disappeared after compensation.

Figure 6. Average residuals from exponential decay for 226Ra decay rates measured in a Vinten IC, binned over fixed periods in the year, and a fitted sinusoidal cycle through the data. The lines represent the expected relative change in solar neutrino flux hitting Earth (full line), the average ambient temperature (short dash) and humidity (long dash) in the Hounslow region.
Download figure:
Standard image High-resolution image3.5. BIPM
The BIPM (located in Sèvres) houses the SIR, a system of two Centronics IG11 ICs used as long-term reference instruments by which mono-radionuclide solutions with standardised activities can be compared for international equivalence. The ionisation current is measured with a Keithley electrometer with external capacitors in a sealed box and using the Townsend balance technique. The laboratory room is temperature and humidity controlled. The stability of the IC #389 has been monitored with the 226Ra check source #4 and the residuals from exponential decay between 2001 and 2022 show no annual cycle, and no significant correlation with humidity in the Toussus-le-Noble weather station.
3.6. ANSTO
Additional evidence was collected in the southern hemisphere, at ANSTO (Australia) [8]. Several sets of 226Ra measurements in a TPA Mk-II IC with a Keithley 6517 A electrometer have been combined and turned out to be free of an annual cycle. Records of the response of a medical calibrator (TPA IC with Keithley electrometer) to a 226Ra reference source show also no sign of annual oscillations.
3.7. NMISA
A series of 14C measurements by TDCR in NMISA (South-Africa) showed no significant annual cycle [9].
3.8. IRA
At the IRA (Switzerland), a 137Cs source was measured between 1980 and 2012 in a Centronic IG11 IC and automated readout based on the principle of the Townsend balance. A typical measurement cycle corresponds to the time needed to load a given capacitor up to 0.1 V. Data after 1996 could be compared with humidity values from the Lausanne weather station. There was no notable annual cycle.
3.9. NRC
From NRC (Canada) three small data sets were made available from 137Cs in three different ICs (Capintec, Vinten and TPA). The individual data sets seem correlated with humidity in the Ottawa weather station. In table 1, values are provided for a combination of the data sets.
3.10. ENEA
At the laboratory in Casaccia, thousands of measurements have been performed between 24 March and 12 May 2016 to investigate correlations between the Centronic IG11 IC readouts with a Keithley 617 electrometer for a 226Ra source and various environmental conditions obtained with an AlphaGUARD monitor in the laboratory [8]. The results of the study show a significant correlation (ρ = 0.84) between the averaged IC currents and temperature, indicating that temperature variations of several degrees Celsius in the laboratory may be the primary cause of seasonal variations in the IC signals at ENEA. The impact of other environmental conditions, including ambient pressure, relative humidity, and radon concentration in air, was found to be lower (−0.2 < ρ < 0.2).
3.11. SCK CEN
In the frame of quality control of the γ-ray spectrometry service at the SCK CEN (Belgium), spectra of mixed 152Eu-241Am reference sources were collected on multiple HPGe spectrometers at a weekly rate. In previous work, data from 2008–2016 were analysed and a strong correlation was found in the annual cycles of characteristic lines of 152Eu and 241Am, however the amplitude of the cycles differed among the detectors [7, 10]. This was considered proof that the instabilities were of instrumental nature and not caused by 'variations in the decay constants due to solar neutrinos'. At that time, the detectors were kept in a temperature-controlled room, without humidity control. Through comparison with climate data from a weather station in Antwerp, evidence suggests that sensitivity of the spectrometers to ambient humidity was the most likely culprit for these seasonal deviations.
In the current work, data sets obtained with 14 HPGe detectors up to Oct 2017 have been (re)analysed. The amplitude of the annual cycle was determined for the peak areas of the 59 keV line of 241Am and for the sum of the 122 keV, 779 keV and 1408 keV peak areas of 152Eu. Weighted mean values for both nuclides are presented in figure 7, showing the amplitude height of the fitted annual cycle as a function of the correlation factor between the decay rates and ambient humidity. The highest annual cycles seem to appear in data sets with a relatively high correlation with humidity. Their amplitudes drop to a statistically insignificant level when the individual data are compensated for a hypothesised linear relationship with the average outdoor absolute air humidity at the day of measurement.

Figure 7. Fitted amplitudes of annual cycles in residuals to exponential decay deduced from one 241Am and three 152Eu peaks in γ-ray spectra of a reference source measured before Oct 2017 with various HPGe detectors in a temperature-controlled laboratory of the SCK CEN in Mol (Belgium). A few detectors show correlation with ambient air humidity causing annual cycles with power up to S = 10.5, but no significant cycle persists (S < 2.2) after linear compensation based on humidity.
Download figure:
Standard image High-resolution imageBy April 2019, the detectors have been moved to a new laboratory equipped with temperature and humidity control. The data sets since that date are less extensive, not necessarily more stable, but show no statistically significant annual cycles. The associated amplitudes remain almost invariant for humidity compensation (figure 8).

Figure 8. Fitted amplitudes of the annual cycle in residuals to exponential decay deduced from one 241Am and three 152Eu peaks in γ-ray spectra of a mixed reference source measured from Apr 2019 to Dec 2022 with various HPGe detectors in a temperature- and humidity-controlled laboratory of the SCK CEN in Mol (Belgium). No significant annual cycles are found (S < 2.5) and compensation for humidity hardly affects the amplitudes (S < 2.4).
Download figure:
Standard image High-resolution image3.12. JSI
The JSI (Slovenia) provided quality assurance measurements of 60Co and 109Cd on different HPGe detectors. Results from 5 detectors were combined for 60Co and 3 for 109Cd, and they were compared with weather data from Cerklje. No annual cycle or humidity effect could be identified.
3.13. IAEA
The IAEA environmental laboratory in Monaco conducted quality control measurements of three radionuclides (241Am, 137Cs, 60Co) on four HPGe detectors. Weather data were obtained from the Oceanographic Museum of Monaco and supplemented with data from the airport in Nice. The laboratory room was equipped with a dehumidifier, which effectively suppressed the inside humidity level whenever the ambient humidity exceeded 10 g m−3. Three detectors showed minimal annual cycles, while the measurement results of HPGe #15 exhibited indications of anti-correlation with ambient humidity. For this detector, a mean annual cycle of 0.33 (7)% amplitude was observed, which reduced to 0.17 (7)% after compensating for humidity.
3.14. PSI
The PSI reported severe instabilities in the percent range in decay rate series of 171Tm, 145Sm, and 44Ti measured on a HPGe detector with imperfect vacuum in the crystal housing [69, 70]. It was found that the variations in the count rates over the measurement campaign were highly correlated with the absolute humidity outside the laboratory. A correlation plot is shown in figure 9. The count rate variations went hand in hand with shifts in the energy calibration.

Figure 9. Correlation plot between a moving average of the absolute ambient humidity, as measured in a weather station at the PSI, and relative departures from exponential decay of the count rates in the γ-ray peaks at 68 keV and 78 keV from 44Ti decay, and at 1157 keV from 44Sc decay.
Download figure:
Standard image High-resolution image4. Discussion
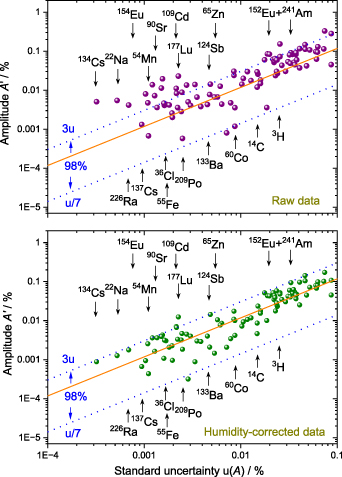
Table 1 summarises the amplitudes and powers of the fitted annual cycles to the residuals from exponential decay, before and after compensation for a humidity effect. Figure 10 illustrates the relationship between the amplitudes and their standard uncertainties. The lines in the graph represent the expected region in which the annual cycles in random noise data would appear, following a Rayleigh distribution. The findings indicate that several decay rate series generated a statistically significant annual cycle above the noise band. However, after compensating for a linear relationship with ambient humidity, the annual cycle in almost every data set decreased to a statistically insignificant value. While this may not provide conclusive evidence that ambient humidity was the underlying cause for the instability in all these measurements, it is a likely factor in many.
Figure 10. Amplitude of annual cycles in residuals to exponential decay as a function of their standard uncertainty, before (top) and after (bottom) a humidity correction. The solid line shows the expected median amplitude of noise data, and the dotted lines indicate the statistical boundaries where only 1% of noise data would cross either line.
Download figure:
Standard image High-resolution image
These results are remarkable given the crude compensation for humidity in the laboratory at the time of measurement. Meteorological data from a weather station located several kilometres away from the laboratories were used, and daily averaged values were employed instead of more precise values as a function of time. Additionally, the method did not account for specific conditions in the laboratory induced by (sometimes failing) heating and climate systems, and differences between day and night regimes, weekdays and weekends or holiday periods. A more rigorous treatment of the data would require characterisation of each measurement system for the response change as a function of environmental conditions as well as monitoring of those conditions during half-life determinations. Although that data was not available for this extensive dataset, the proxy data make a strong case that the studies to account for humidity effects are necessary and humidity effects must be excluded before more exotic explanations are considered reasonable.
Humidity can have a significant influence on IC measurements. On a hypothetical level, it can alter the dielectric properties of the medium surrounding the IC, which could affect the electric field within the chamber and thus influence the collection of ionisation charges. More importantly, humidity can affect the stability of the electronic components in the electrometer or voltmeter used to measure the ionisation current or voltage across a capacitor [71]. Moreover, it can increase the conductivity of air, leading to enhanced discharge of an external air capacitor over which the ionisation current is collected. This can lead to a change in the voltage measured across the capacitor for a given ionisation current. The air capacitor can also be discharged by radon and progeny alpha decays in air, so it is good practice to keep it shielded from environmental influences and ionising radiation, including the source in the IC. The IC can be shielded with materials such as lead to reduce the amount of external radiation (incl. secondary cosmic radiation) that reaches the chamber.
High-purity germanium (HPGe) detectors for gamma-ray spectrometry are very sensitive instruments that require a stable operating environment. Ambient humidity can impact the performance of HPGe detectors, particularly if the vacuum inside the crystal housing is not well-maintained. When the vacuum is inadequate, moisture in the air can enter the crystal housing and condense on the surface of the HPGe detector crystal. This moisture can create a thin film on the crystal's surface, which can act as an electrical conductor, thereby increasing the leakage current of the detector. This increase in leakage current can lead to higher baseline noise levels in the spectra, reducing the sensitivity and resolution of the detector. Furthermore, the condensed water can create additional electrical noise due to the formation of a capacitive circuit between the crystal and the grounding circuit, which can lead to spikes in the spectra. These spikes can make it more difficult to identify and quantify peaks in the gamma-ray spectrum.
Some techniques, e.g. liquid scintillation counting, alpha-particle counting with planar Si detectors, show no significant dependency on ambient humidity. The measurements discussed in this paper mostly refer to decay rates of the order of kBq, which are not highly sensitive to changes in the background event rate. Low-level activity measurements are more susceptible to various natural processes, such as radon emanation and cosmic muons interacting with Earth's atmosphere.
5. Conclusions
The influence of ambient humidity on radiation detectors has been investigated in numerous decay rate measurement series from 14 laboratories. Several data sets displayed annual cycles at various levels of statistical significance. For each data set, a linear relationship was derived from a correlation plot between the residuals from exponential decay and the average daily ambient humidity values from nearby weather stations. The corresponding offset and slope were used to compensate the residuals in the activity measurements for the assumed humidity effect. As a result, the annual cycles dropped to a statistically insignificant level in virtually all tested decay series and the validity of the exponential-decay law could be confirmed with an accuracy on the amplitude ranging from 0.0003% to 0.1%. The present analysis demonstrates that annual cycles observed in radioactivity measurements may be attributed to environmental factors such as humidity and temperature variations that affect the performance of the measurement equipment. It leaves less room for alternative theories such as the hypothesis of solar neutrinos influencing the radioactive decay process itself. Radionuclide metrology can gain additional confidence in measurements by characterising the sensitivity of measurement systems to environmental conditions and by monitoring and controlling those conditions that have a significant impact.
6. Disclaimer
Certain commercial equipment, instruments, or materials are identified in this report to foster understanding. Such identification does not imply recommendation by the authors' institutes, nor does it imply that the materials or equipment identified are necessarily the best available for the purpose.
Acknowledgments
This work has been presented at the 23rd International Conference on Radionuclide Metrology and its Applications in Bucharest, Romania in 2023.