

Abstract
We have developed a broadband and high-precision terahertz (THz) frequency counter based on a semiconductor-superlattice harmonic mixer (SLHM). Comparison of two THz frequencies determined using two independent counters and direct measurement of frequency-stabilized THz-quantum cascade lasers by a single counter showed a measurement uncertainty of less than 1 × 10⁻¹⁶ over a four-octave range from 120 GHz to 2.8 THz. Further extension of this measurable range was indicated by the research regarding the higher-harmonics generation of a local oscillator for the SLHM. This compact and easy-to-handle THz counter operating at room temperature is available for high-resolution spectroscopy of ultracold molecules proposed for detecting temporal changes in physics constants as well as many THz applications requiring a wide measurement range without a bulky cryogenic apparatus.
Export citation and abstract BibTeX RIS

Original content from this work may be used under the terms of the Creative Commons Attribution 4.0 licence. Any further distribution of this work must maintain attribution to the author(s) and the title of the work, journal citation and DOI.
1. Introduction
The technological growth in various scientific and industrial fields has been sustained by exploiting a variety of electromagnetic-wave frequencies. Recently, the terahertz (THz) frequency band (0.1 THz–10 THz) has been rapidly developed for a wide area of applications [1, 2], including high-speed wireless communications with a wide spectral bandwidth [3], sensing and imaging for quality control and security screening [4, 5], biology and medicine using biomolecules spectroscopy [6], and astronomy based on characteristic molecular fingerprints [7]. A frequency standard in the THz band will be essential for allocation of the spectrum among various THz users and calibration of distinct types of THz spectrometers with establishing metrological traceability to the SI second. The THz frequency standards are continuous-wave (CW) oscillators whose emitted radiation is stabilized to the quantum transition frequencies of atoms or molecules in the THz band. Among them, a THz molecular clock referencing to the vibrational transition frequency in ultracold 174Yb6Li molecules is theoretically proposed as an ultra-accurate THz standard with an attainable uncertainty of less than 10−15 level [8], which enables us the verification of fundamental physics by searching for variations of the electron-to-proton mass ratio [9]. Because its absolute frequency and instability must be measured with sufficient accuracy during the development process and operation phase, a THz frequency counter with high precision and wide measurable range plays a significant role in not only diverse THz applications mentioned above but also the establishment of such THz standard.
Several THz counters have been demonstrated for the operation and studied for their measurement uncertainties. A photocarrier-THz frequency comb [10–12], which is created by a difference frequency generation in a semiconductor photoconductive antenna (PCA) irradiated with a femtosecond-pulse (fs) laser optical comb, can determine the absolute frequency νTHz of a CW–THz source by the measurement of the heterodyne-beat frequency fbeat against the nearest kth-mode of the PCA–THz comb; νTHz = kfrep + fbeat, where frep is the mode spacing of the THz comb. Although the best measurement uncertainty of the PCA–THz comb reached 1.4 × 10⁻¹⁷ at 300 GHz under room temperature [13], such excellent uncertainty is difficult to be attained above 1 THz because of miscounting of fbeat owing to its insufficient signal-to-noise ratio (SNR); the power of the THz-comb mode rapidly decreases toward the higher frequency. The heterodyne-beat detection between the PCA–THz comb and a 2.5 THz source with 10 mW high power has been reported for only its frequency stabilization, even though the bandwidth of a transimpedance amplifier for converting the photocurrent beat signal into voltage one restricted the upper limit of fbeat, consequently the frequency control bandwidth [14]. Since the PCA-based THz time-domain spectroscopy (TDS) offers the broad spectral bandwidth over 20 THz [15, 16] thanks to the high photocarrier mobility and the reduced carrier lifetime in the semiconductor materials, the PCA technology likely has a potential for wide-range frequency measurement with the high precision.
The electro-optic (EO) sampling technique using a non-linear optical crystal can bridge widely separated THz and optical frequencies [17]. The fs-laser optical comb is phase-modulated by the electric field of THz radiation from the CW source via the EO effect in the non-linear crystal, so that a composition of beat signals between the carrier optical comb and the modulation-sideband combs can be obtained for phase-locking the CW–THz source to the optical comb without a bulky liquid-helium-cooled detector [18]. This technique was also applied to count νTHz at 2.5 THz in spite of the need of the severe phase matching condition of fs-pulse light and THz radiation in the crystal [19]. However, the heterodyne-beat detection with high SNR at room temperature would be challenge against higher νTHz than the optical spectrum width of the fs laser, where the nearest one mode of the THz comb to νTHz can only contribute to producing the beat signal. The THz–TDS using the EO sampling technique has been demonstrated for the direct frequency measurement at 28 THz with the accuracy of 0.2 MHz [20], although there existed inevitable low sensitivity ranges around the optical phonon resonances. The EO sampling technique is capable of measuring the broadband THz frequency, nevertheless the technique is unlikely suitable for compact applications because of the fs-laser system.
A harmonic mixer exploiting the non-linear properties of a semiconductor device is an alternative path to approach to the THz domain. It can downconvert from νTHz to fbeat in the accessible radio-frequency (RF) range by mixing the THz radiation with a harmonic of a local oscillator (LO) signal in the microwave band. Besides, this manner facilitates to maintain the traceability to a cesium microwave frequency standard defining the present SI second. A Schottky barrier diode has been employed as a frequency multiplier for generating THz radiation as harmonics of the input microwave signal [21]. The Schottky diode has also been applied as a frequency mixer for producing the RF beat signal from νTHz up to 2.9 THz [22, 23]. On the other hand, a semiconductor-superlattice electron device (SLED) with negative differential conductivity at room temperature, which was predicted by Esaki and Tsu in the early 1970s [24], has been demonstrated for THz-wave generation [25–27] and THz-frequency downconversion [28–30] while competing with the Schottky diode. The SLED is a compact, easy-to-use, and room-temperature operational device. Moreover, it was revealed to possess a higher conversion efficiency from the microwave LO signal into its harmonics than the Schottky diode as shown by comparative investigations [31, 32]. The SLED has already been employed as a key device for many THz researches such as direct molecular spectroscopy [33] or the heterodyne spectrometer by using a quantum cascade laser (QCL) in the THz band, which is phase-locked to a microwave reference [34]. The SLED as a harmonic mixer has a potential to become a THz frequency counter indispensable for various THz applications as well as for the development of THz molecular clocks. However, the comprehensive characterization of such THz counter based on a semiconductor-superlattice harmonic mixer (SLHM) has not been addressed yet from the viewpoint of the measurable frequency range and precision.
In this paper, we present the development of a broadband and high-precision THz counter based on the SLHM. Its frequency uncertainty and instability over a four-octave THz range were evaluated by complementary methods: comparison of two independent counters and direct frequency measurement of phase-stabilized THz–QCLs by a single counter. Additionally, detailed research and analysis of the relative power spectrum of LO harmonics created in the SLHM imposed the limitation on the maximum frequency potentially measured by our THz counter under room temperature.
2. Measurement principle
The intrinsic uncertainty and instability of the SLHM-based THz counter can be investigated by two methods: comparison of two THz frequencies determined using two independent counters and direct measurement of a known frequency generated from a highly stabilized THz–QCL by a single counter. The former, or what is called the dual-counter frequency difference method, is suitable when a CW–THz source with a low-frequency jitter becomes available; such a situation is likely satisfied for less than 1 THz. Whereas the latter, or the phase-locked THz–QCL method, allows the counter characterization at typically above 1 THz, where powerful THz–QCLs with the established phase-locking technology exist.
2.1. Dual-counter frequency difference method
Figures 1(a) and (b) illustrate the schematic and block diagram of the dual-counter frequency difference (DCFD) method. Its concept has been adopted for the characterization of various frequency counters in the THz to visible-light region [13, 35, 36]. The DCFD method is composed of one CW–THz source and two independent SLHM-based THz counters. The THz radiation emitted from the CW–THz source at νTHz is split into two beams. They are introduced into the horn antennas of SLHM1 and SLHM2, respectively. They can downconvert νTHz to the intermediate RF-beat signals at  by heterodyne-mixing with the nearest ki
th harmonics of microwave LO signals. The LO signals are produced by a common RF synthesizer1 with a frequency fRF1 through independent frequency multipliers with the multiplication factors mi
; the LO frequency becomes mi
fRF1. Since the SLHM behaves as a THz-comb generator whose mode spacing is mi
fRF1, fbeati
in figure 1(b) is written as
by heterodyne-mixing with the nearest ki
th harmonics of microwave LO signals. The LO signals are produced by a common RF synthesizer1 with a frequency fRF1 through independent frequency multipliers with the multiplication factors mi
; the LO frequency becomes mi
fRF1. Since the SLHM behaves as a THz-comb generator whose mode spacing is mi
fRF1, fbeati
in figure 1(b) is written as

where ntoti is the sum of the equivalent frequency noise originating from the shot noise (nshoti ), thermal noise of SLHM (nthi ) and electronic noise of amplifier (nei ). The difference between two beat frequencies, Δfbeat, is given by

which represents canceling out the instabilities of νTHz and fRF1 as common-mode noise when k1 m1 = k2 m2. Accordingly, the DCFD method can reveal the intrinsic noise of the SLHM-based THz counter, which consists of quantum, thermal and technical noises. One practical drawback of this method is the paucity of THz sources oscillating at above 1 THz with the sufficient output power for the precise frequency measurement.

Figure 1. Schematic and block diagrams of the dual-counter frequency difference method (a), (b) and the phase-locked THz–QCL method (c), (d). SLHM: semiconductor-superlattice harmonic mixer; PLL: phase-locked loop; ν: THz frequency; f: frequency; P: output power; m: RF multiplication factor; k: harmonic number; D: frequency–voltage converter; H: voltage–frequency converter; n: equivalent frequency noise; v: voltage noise.
Download figure:
Standard image High-resolution image2.2. Phase-locked THz–QCL method
Figures 1(c) and (d) shows the schematic and block diagram of the phase-locked THz–QCL (locked-QCL) method. This method is comprised of a CW–THz source phase-locked to a stable THz frequency reference and one SLHM-based THz counter. The THz–QCL is a promising CW–THz source for counter characterization above 1 THz owing to the prominent milliwatt-order output power; other CW–THz sources emit lower power in typically tens of microwatts [1]. However, the THz–QCLs often have a large frequency jitter of several MHz, which is caused by the mechanical vibration from a Stirling refrigerator; it is necessary to cool the THz–QCL to cryogenic temperature to achieve the population inversion between the two inter-subbands. In the locked-QCL method, this jitter noise is suppressed to a nonsignificant level for the absolute frequency measurement of the THz–QCL.
To decrease the miscounting rate in the precise measurement of fbeat4 yielded by SLHM2, the free-running THz–QCL at νQCL must be stabilized to the k1th LO harmonic at k1
m1
fRF1 produced in SLHM1. Their heterodyne beat signal at fbeat3 is phase-locked to an output signal at fRF2 from RF synthesizer2. The control signal extracted by using a mixer is fed back to the THz–QCL to modulate νQCL after appropriate filtering and amplification in the phase-locked loop (PLL) servo. The resultant frequency  in figure 1(d) is calculated as
where Gop ≡ D1 H1 is an open-loop gain of the PLL, and D1 and H1 represent a frequency–voltage and a voltage–frequency converter, respectively. nd1 is an equivalent frequency noise attributable to D1, and vh1 is an input noise voltage of H1. Using equation (3) on the assumption of Gop ≫ 1 and k1 m1 = k2 m2, fbeat4 can be written as

where  . The first term on the right side of equation (4) indicates the suppression of frequency fluctuation from THz–QCL by the PLL gain; consequently, the contribution to the fbeat4 measurement is negligible. The second term, which represents a phase-locked beat frequency, is also insignificant because the fluctuation of fRF2 is at least three orders of magnitude smaller than those of the LO harmonics. As a result, the fluctuation of fbeat4 is dominated by
  in equation (4), and then the evaluation of fbeat4 can be regarded as almost equivalent to measuring Δfbeat by the DCFD method. The locked-QCL method serves to verify the measurement accuracy of the SLHM-based THz counter above 1 THz, where the powerful THz–QCLs are available.
3. Experimental setup
3.1. Dual-counter frequency difference method
Figure 2 shows the experimental setup for the DCFD method. Two measured νTHz by the inline and perpendicular-THz counters were compared to obtain Δfbeat on the computer. The CW–THz sources employed are frequency multipliers (Virginia diodes, AMC303 and WR2.8 × 3R5) with low-noise RF synthesizer0 (Agilent, E8251A) and a frequency-multiplied Gunn oscillator (Radiometer Physics GmbH) phase-locking to a reference frequency from the synthesizer. The frequency multipliers extend the microwave signal from the synthesizer0 into the THz radiation ranging from 88 GHz to 360 GHz. On the other hand, the Gunn oscillator can provide THz signals from 618 GHz to 654 GHz. Their output powers measured at the specific frequencies are summarized in table 1.
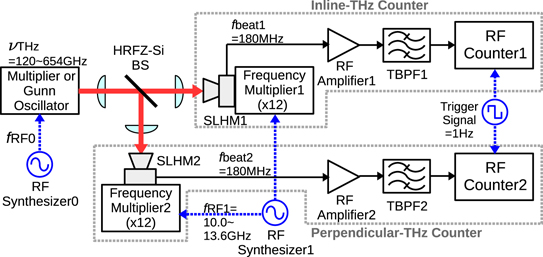
Figure 2. Experimental setup for DCFD method. SLHM: semiconductor-superlattice harmonic mixer; HRFZ-Si BS: silicon beam splitter; TBPF: tunable band-pass filter; ν: THz frequency; f: frequency.
Download figure:
Standard image High-resolution imageTable 1. Major experimental parameters for CW–THz sources, microwave local oscillator and heterodyne beat signals. Three types of THz sources oscillating at νTHz were employed. The measured values including the output power PTHz of THz sources are written in roman, whereas the nominal values from the data sheet are written in italics. Each frequency fRF1 of RF synthesizer1 was multiplied by the common multiplication factor m of 12 to produce the microwave LO signal at mfRF1. Each beat signal at the frequency fbeat was obtained by hererodyne-mixing with νTHz and the nearest kth harmonic of the LO signal at kmfRF1. The signal-to-noise ratio (SNRk) of the beat signals for the inline and perpendicular-THz counters was obtained using an RF spectrum analyzer with the resolution bandwidth of 100 kHz.
| νTHz/GHz | 120 | 246.78 | 324.18 | 618 | 654 | 2020.39892 | 2828.16764 |
|---|---|---|---|---|---|---|---|
| Source | RF multiplier | Gunn oscillator | QCL | ||||
| PTHz/μW | 19031 | 334 | 946 | 128 | 68 | 150 | 2000 |
| fRF1/GHz | 10.015 | 10.275 | 13.5 | 12.87875 | 13.62875 | 12.02544 | 13.09279 |
| k | 1 | 2 | 2 | 4 | 4 | 14 | 18 |
| fbeat/MHz | 180 | 180 | 180 | 180 | 180 | 125 | 125 |
| SNRk /dB | |||||||
| Inline | 30.2 | 36.8 | 38.0 | 29.8 | 31.2 | 33.3 | 40.0 |
| Perp. | 31.1 | 33.6 | 37.6 | 41.5 | 35.0 | 26.4 | 32.0 |
The radiation emitted from the CW–THz sources was collimated by a Tsurupica lens and divided into two orthogonal directions by a high-resistivity float zone silicon (HRFZ-Si) beam splitter with 1 mm thickness. Each radiation was focused by a lens to maximize the coupling efficiency to the SLHM through a diagonal horn antenna. Apart from the horn for THz-signal input, the SLHM device has a microwave LO input port and an intermediate frequency output port [32]. The microwave LO signal is provided to the SLED via a WR-06 rectangular waveguide to convert the LO power into the harmonics current in the THz band. The LO signals were generated from another metrology-grade RF synthesizer1 (Agilent, E8247C) using two independent amplifier/multiplier chains with a multiplication factor m of 12 (Virginia Diode, WR6.5AMC-I). The LO frequency can be tuned from 110 GHz to 170 GHz with a typical output power of 16 mW. The intermediate beat frequencies at fbeat1 and fbeat2 from a coaxial connector of each SLHM were set to be 180 MHz. Each beat signal was amplified by a multistage RF amplifier (RFA) with a power gain of 60 dB and a noise figure of 2.9 dB (mini-circuits). After transmitting tunable-bandpass filters with 5% bandwidth of the center frequency for the signal conditioning (TBPF1, TBPF2), fbeat1 and fbeat2 were measured by independent Π-type RF counters (Pendulum, CNT-91). The beat signal measured had to attain the SNR of more than 25 dB with a 100 kHz resolution bandwidth (RBW) to prevent the RF counter from miscounting the beat frequency. Two RF counters were synchronously operated in the external arming mode by a common square-wave trigger signal at 1 Hz with 99% duty cycle. Such operation allows the conservation of the phase coherence between the two beat signals registered; the common-mode noise can be rejected from Δf through data analysis. Although there exists the measurement dead time of 10 ms during 1 s gate time for every frequency counting, the instability of the measured signal in the Allan deviation is degraded by only 1% in the case of the white phase noise [37]. The RF synthesizers and counters employed here were externally referenced to a hydrogen maser frequency standard (Anritsu, RH401A).
3.2. Phase-locked THz–QCL method
The experimental setup for the locked-QCL method is depicted in figure 3. Although the configuration of the perpendicular-THz counter was identical to that for the DCFD method, the inline system was modified to be engaged in the PLL for the THz–QCL. Two THz–QCLs were employed for this method. One was a third-order distributed-feedback laser with an output power of 150 μW at νQCL of 2020 GHz. The other was a Fabry–Perot laser with 2 mW output power at 2828 GHz. Both oscillated at single frequencies with linear polarization and TEM00 mode (Longwave Photonics). These lasers were placed in a vacuum chamber and cooled to 50 K using a Stirling refrigerator. The beam irradiated from the THz–QCL was focused by a silicon-meniscus lens and subsequently separated into two beams by an HRFZ-Si beam splitter. The inline beam was received by a diagonal horn of the SLHM1 to transfer to its SLED. The νQCL was downconverted to fbeat3 by mixing with the appropriate kth harmonic of the microwave LO signal. The microwave signal was the frequency-multiplied output from RF synthesizer1. Table 1 summarizes the output frequencies from RF synthesizer1 and the multiplication factor m as well as the harmonic numbers k. To obtain an error signal for the PLL, fbeat3 was compared with an output signal at 125 MHz from RF synthesizer2 using a double-balanced mixer (DBM). The error signal was filter-amplified by PLL-servo electronics and afterward directly added to the laser current via a resistive summer to shift the laser frequency from νQCL to  . Its control bandwidth was about 5 MHz, which was restricted by the phase delay caused by the servo electronics. The typical continuous phase-locking time was within several hours, which arose from the reversed sign of the error signal during the operation [30].

Figure 3. Experimental setup for the phase-locked THz–QCL (locked-QCL) method. SLHM: semiconductor-superlattice harmonic mixer; PLL: phase-locked loop; DBM: double-balanced mixer; HRFZ-Si BS: silicon beam splitter; TBPF: tunable band-pass filter; ν: THz frequency; f: frequency.
Download figure:
Standard image High-resolution image4. Results
4.1. Frequency instabilities and uncertainties
Figure 4 plots the typical RF spectra of fbeat2 and fbeat4 obtained by the perpendicular-THz counters in the DCFD and locked-QCL methods. The spectra of fbeat1 for the inline-THz counter in the DCFD method and fbeat3 as an inloop signal of the PLL in the locked-QCL method showed similar shapes to the related spectra in figure 4. The narrow spectra of fbeat2 regarding the frequency multipliers with the RF synthesizer0 in figures 4(a)–(c) reflected its low phase noise, while the broad ones associated with the Gunn oscillator in figures 4(d) and (e) were originated from its intrinsically wide linewidth. The sidelobes next to fbeat4 at 125 MHz in figure 4(g) were generated by the slightly distorted signal at the RFA1 output. The measured beat signals had SNR of more than 26.4 dB with a 100 kHz RBW as summarized in table 1. This satisfies the empirically imposed requirement on the beat SNR for precisely counting the frequencies by RF counters. The observed linewidth of 1 Hz for each beat spectrum was limited by the RBW of the RF spectrum analyzer. In particular, such a narrow linewidth of fbeat4 indicated that the PLL suppressed well the jitter noise on νQCL.
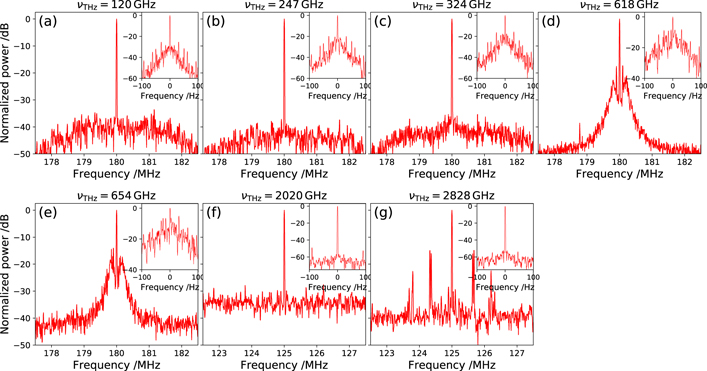
Figure 4. RF spectra of the typical heterodyne beat signals (fbeat2, fbeat4) between the CW–THz radiations at νTHz and the nearest LO harmonics in the SLHM2. These were registered with the RBW of 10 kHz and video bandwidth (VBW) of 3 kHz. The insets show each spectrum in higher resolution with 1 Hz RBW and VBW. The frequency offset was subtracted for readers' convenience.
Download figure:
Standard image High-resolution imageThe Allan deviations for νTHz from 120 GHz to 654 GHz, which were measured by the inline and perpendicular-THz counters, are plotted with triangles and squares in figures 5(a2)–(e2). Two instabilities at each νTHz were equivalent and restricted by the instabilities of RF synthesizers used in the experiment, as represented by dash-dot lines. The instabilities corresponding to one THz counter are plotted with circles. They were obtained from Δfbeat for each νTHz, which eliminated the instabilities of RF synthesizers as the common-mode noise. The THz-counter instabilities had a 1/τ dependence and dropped to 1 × 10⁻¹⁶ within the averaging time τ of 10 000 s. To clarify the noise source dominating the instabilities, we evaluated the equivalent frequency instability  of the RFA as a function of the beat SNR; a sinusoidal test signal at 180 MHz was amplified by the RFA with changing the SNR of its output signal between 30 dB and 41 dB, then the measured instability of the output signal with each SNR derived
  . The dashed lines in figure 5 represent the RFA instabilities calculated from the measured SNR of fbeat1 and fbeat2. They were in good agreement with the instabilities of the THz counter, whereas the influences of other noise sources were estimated to be negligible at present. The measurement limit
  of the RF counter was determined to be
  , which was also lower than the THz-counter instabilities. It should be noted that only 15% power of the whole 120 GHz radiation detected was coupled to the SLED through the horn antenna owing to its higher cut-off frequency; the coaxial cable for the intermediate-frequency output behaved as a more efficient antenna for the 120 GHz-signal detection. Nevertheless, the SLHM worked as a fundamental frequency mixer with a low instability at 120 GHz.
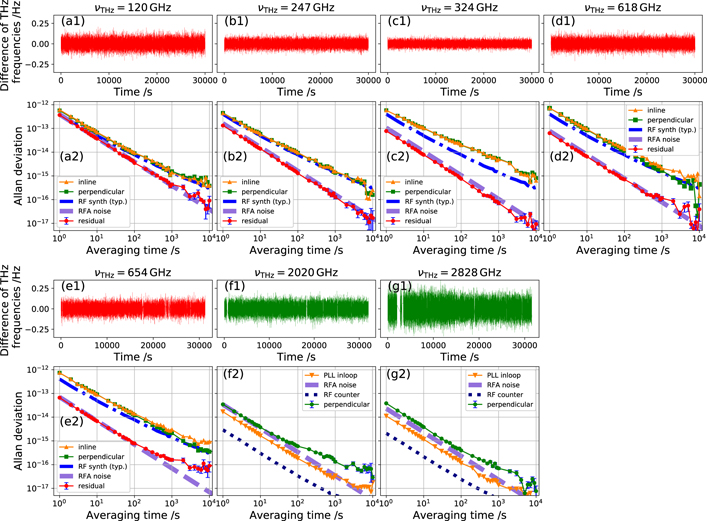
Figure 5. (a1)–(e1) Difference between two THz frequencies Δfbeat measured by two independent THz counters in the DCFD method. (f1), (g1) Absolute frequencies of stabilized THz–QCLs measured by the one THz counter in the locked-QCL method. The frequency offset corresponding to the correct  is subtracted from them. The data during unlocked states of the PLL are omitted. (a2)–(g2) Measured and calculated fractional frequency instabilities as given by the Allan deviation σy
. The (orange) triangles and (green) squares in (a2)–(e2) represent the instabilities for νTHz measured by the inline and perpendicular-THz counters, respectively. The (blue) dash-dot lines illustrate the instabilities of metrology-grade RF synthesizer. The (red) circles show the instabilities of one THz counter, which were computed from the corresponding frequency time series in (a1)–(e1). The (purple) dashed lines illustrate the equivalent instabilities
is subtracted from them. The data during unlocked states of the PLL are omitted. (a2)–(g2) Measured and calculated fractional frequency instabilities as given by the Allan deviation σy
. The (orange) triangles and (green) squares in (a2)–(e2) represent the instabilities for νTHz measured by the inline and perpendicular-THz counters, respectively. The (blue) dash-dot lines illustrate the instabilities of metrology-grade RF synthesizer. The (red) circles show the instabilities of one THz counter, which were computed from the corresponding frequency time series in (a1)–(e1). The (purple) dashed lines illustrate the equivalent instabilities  of the RFA. The (orange) upside down triangles in (f2), (g2) show the relative instabilities of phased-locked THz–QCLs to the LO harmonics as the references. The (green) circles show the genuine instabilities of the THz–QCL, that were measured by the independent perpendicular-THz counter and calculated from the frequency time series in (f1), (g1). The (blue) dotted lines indicate the measurement limit
  of the RF counter.
Download figure:
Standard image High-resolution imageThe relative instabilities of phase-locked THz–QCLs to the LO harmonics as the THz frequency reference are plotted by upside down triangles in figures 5(f2) and (g2). They achieved a lower instability than the RFA noise level as represented by the dashed lines; this occurs in the feedback loop, where the RFA noise is suppressed together with the νQCL fluctuation. The genuine instabilities of the THz–QCLs are shown by circles. They were computed from the frequency time series in figures 5(f1) and (g1), which were measured by the perpendicular-THz counter; the missing data at early times are due to the exclusion of frequency time series during unlocked states of the PLL, where the recorded frequency largely deviates from the correct one. As explained in section 2.2, the genuine instabilities of the THz–QCLs correspond to the instability of the THz counter. They plunged into the 10−17 level within 2000 s. The excursions from a 1/τ dependence were accompanied by the cycle slips in the PLL and the fbeat4 miscountings owing to the time-varying low SNR. The instability of the THz counter between 2020 GHz and 2828 GHz was also limited by the RFA noise. The THz-counter instability can be improved substantially by increasing the amplitude of the beat signal or by decreasing the electronic noise from the RFAs. Such further improvements will reveal the intrinsic noise of SLED and lead to a better understanding of the miniband electron transport in the semiconductor superlattice. The Allan deviations of the THz counter at 1 s averaging time are summarized in figure 6(a). Accordingly, the instability of the SLHM-based THz counter developed was found to be restricted by the RFA noise at the wide THz band between 120 GHz and 2.8 THz.
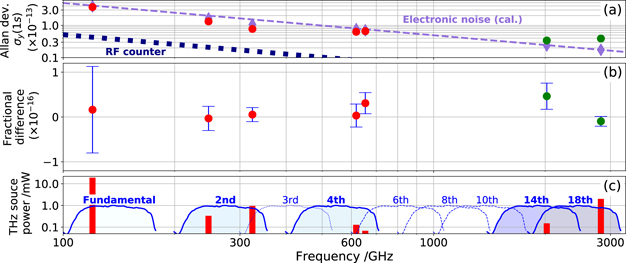
Figure 6. (a) Summary of fractional frequency instabilities at 1 s averaging time for SLHM-based THz counter (circles) and RFA (diamonds). The electronic noise level of the RFA against the beat signal SNR of 30 dB and the measurement limit of the RF counter are shown by dashed and dotted lines, respectively. (b) Measurement uncertainties of THz counter from 0.12 THz to 2.8 THz. The points are the mean of frequency difference measurements and the deviations of measured absolute frequency from the correct νTHz. The error bar on each point indicates the standard error. (c) Output powers of CW–THz sources employed in our experiment (bars). The broadband spectra denoted by the ordinal numbers represent the expected spectral coverage of the corresponding LO harmonics k. Note that their powers are uncalibrated.
Download figure:
Standard image High-resolution imageThe mean of the fractional frequency difference and the standard error at each νTHz were computed to be less than 4.6 × 10⁻¹⁷ and below 9.6 × 10⁻¹⁷, respectively (figure 6(b)). They were obtained from 30 data sets, where each data set comprised of 1000 data points with a sampling rate of 1 Hz. The statistical error was regarded as the standard error, although the instability of the THz counter indicated not random processes but phase-coherent process with white phase noise, which has a 1/τ dependence in the Allan deviation. No systematic frequency offset were confirmed within the standard error except for the results at 654 GHz and 2020 GHz; we attribute their slight offset to the unbalanced noise sidebands around the carrier RF-beat signals, which enforce a deviation from the correct νTHz. Even though there exists such an offset at the specific νTHz, the SLHM-based THz counter, which is referenced to a future optical SI second with the uncertainty of 10−18 level [38], is capable of determining the absolute THz frequency with an uncertainty of less than 1 × 10⁻¹⁶ over the four-octave THz range. This is because the potential measurement limit of the THz counter below 1 THz, which was revealed to have the above stated uncertainty by the DCFD method, can be achieved beyond the present limit by employing an LO signal generated from such future SI-traceable reference with enough accuracy and stability instead of the RF synthesizer1; consequently the absolute frequency measurement with the stated uncertainty. Similarly, the locked-QCL method has verified the comparable potential limit of the THz counter over 1 THz by the effective rejection of common noise mainly associated with the RF synthesizer1, as explained in section 2.2. It is worth mentioning that the relatively large uncertainty at 120 GHz as shown in figure 6(b), which restricts the overall measurement uncertainty of the THz counter, is attributed to not only the lower νTHz affecting the dominating RFA instability  but also the lower beat SNR due to the inferior coupling efficiency of 120 GHz radiation into the SLED through the horn antenna. Owing to the paucity of suitable CW–THz sources, thorough research on the wide measurable spectrum of the developed THz counter was difficult to be carried out. This sparsely left several uninvestigated bands, which can be covered with third and some even LO harmonics as depicted in figure 6(c). The presence of those LO harmonics is reasonable in accordance with the previous reports regarding the harmonics generation by the SLED [39]. Therefore, the THz counter developed is expected to work in the broad THz band with measurement uncertainties comparable to the νTHz investigated.
Table 2 shows the uncertainty budget of the THz counter developed. The total uncertainty of 6.9 × 10⁻¹⁷ except for the contribution from the LO-phase noise is the potential measurement limit and agrees well with the measured uncertainty of the developed system. The uncertainty of the electric noise caused by the RFA is the main contribution to the potential measurement limit. This uncertainty is owing to the fbeat measurement with the practical beat SNR after the signal amplification. The RF-counting standard error represents the statistical uncertainty arose from the frequency measurement using the RF counter, that is related to its measurement limit  . The PLL servo error gives the possibility of the deviation of the THz–QCL frequency from the reference LO harmonic, which was evaluated from fbeat3 in the PLL for the THz–QCL; this contributes to only the locked-QCL method. The LO-phase noise represents the phase noise of the frequency-multiplied output of the RF synthesizer1, and thus the uncertainty originated from its phase noise is adopted here; the uncertainty of the hydrogen maser as the external LO reference is not included in that of the LO-phase noise. Each uncertainty for the RFA electric noise, RF-counting standard error, PLL servo error and LO-phase noise was computed from independently acquired 30 data sets, where each data set was composed of 1000 data points with 1 Hz sampling. The estimated uncertainties for the thermal and shot noise of the SLHM are negligibly small contributions (<1 × 10⁻²⁰). Note that these uncertainties depend on the averaging time because of the random effect. No inherent frequency offset is expected for all uncertainty sources listed.
Table 2. Typical uncertainty budget of the SLHM-based THz counter. The uncertainty contributions from the electronic noise caused by RFA, RF-counting standard error due to RF counter, PLL servo error for the frequency stabilization of THz–QCL and LO-phase noise originated from RF synthesizer1 were computed from independently acquired data for them. These uncertainties depend on the averaging time of 30 000 s. The contributions for the thermal and shot noise of the SLHM (<1 × 10⁻²⁰) were estimated to be negligible at current level of experimental precision. The total uncertainty without the contribution from the LO-phase noise is the potential measurement limit of the THz counter developed.
| Uncertainty source | Fractional uncertainty | Description |
|---|---|---|
| (10−18) | ||
| Electronic noise | 67.9 | Originated from RFA |
| RF-counting standard | 10.9 | Due to RF counter |
| error | ||
| PLL servo error | 5.7 | Based on stabilizing THz-QCL |
| frequency | ||
| Thermal noise | <0.01 | Originated from SLHM |
| Shot noise | <0.01 | Originated from SLHM |
| Total (potential limit) | 69.0 | |
| LO-phase noise | 509.8 | Due to RF synthesizer1 |
| Total (present limit) | 514.5 |
4.2. Power spectrum of LO harmonics
Apart from the measurement at 120 GHz, even LO harmonics were utilized for the other νTHz measurements with the various THz sources, as summarized in table 1. This is because the higher SNR of the heterodyne beat signal was always achieved by mixing with the even harmonics rather than the adjacent odd ones. Further study of the amplitude of LO harmonics generated in the SLHM is worth pursuing to determine the upper limit of the measurable spectrum. The power of the kth LO harmonics  relative to that of the THz radiation
  coupled into the horn antenna of the SLHM can be obtained from the following equation:

where SNRk
is the measured SNR of a beat signal between the kth harmonics and the THz source, Pnoise is the total noise power that appeared in the beat measurement; actually, Pnoise can be replaced with the electronic noise power of the RFA in our experiment. A0 is assumed as a constant coefficient for the sake of simplification. Note that  is not the original power from a THz source in table 1 but the compensated power for the path loss in the air due to water absorption and the optics, and the coupling efficiency that is defined by a ratio of the effective aperture area of the horn antenna to the spot size of the THz beam on the aperture. Figure 7(a) plots
  as a function of the LO harmonic number k. The LO power was changed from 0.71 mW to 16 mW for each measurement in order to maximize the SNRk
. The overlapped spectral coverage of the adjacent LO harmonics enabled their power measurement with the identical THz sources. Nevertheless, the harmonics contained in the gray area have no information because of the lack of proper THz sources oscillating near the corresponding harmonics frequencies. Obviously, the power of even harmonics exceeds those of adjacent odd harmonics. This implies that the conversion efficiency of even harmonics from the LO signal was superior to that of odd ones. Such a power distribution could be caused by the Esaki–Tsu current–voltage characteristic with antisymmetry: the induced current in the SLED by the LO voltage forms a rectangular wave with bumps in the positive and negative amplitudes, which are originated from the negative differential conductivity [25, 40, 41]. The envelope of the even harmonics' power had a k−3.4 dependence up to k = 20, which was almost consistent with the characteristics of the SLED-based frequency multipliers [31, 32]. The power of the higher harmonics, however, declined more steeply with a k−37 dependence. The harmonics with k > 23 were difficult to observe under our experimental condition. Thus, the maximum possible frequency to be measured by our THz counter is approximately 3.7 THz when the highest 22th harmonic is generated from the LO signal at 170 GHz. Further extension of the measurable range up to 4.7 THz is expected by the cryogenic cooling of the SLHM because of the reduced scattering of miniband electrons by acoustic and polar optical phonons, consequently increasing the electron drift velocity in the semiconductor superlattice [42].
as a function of the LO harmonic number k. The LO power was changed from 0.71 mW to 16 mW for each measurement in order to maximize the SNRk
. The overlapped spectral coverage of the adjacent LO harmonics enabled their power measurement with the identical THz sources. Nevertheless, the harmonics contained in the gray area have no information because of the lack of proper THz sources oscillating near the corresponding harmonics frequencies. Obviously, the power of even harmonics exceeds those of adjacent odd harmonics. This implies that the conversion efficiency of even harmonics from the LO signal was superior to that of odd ones. Such a power distribution could be caused by the Esaki–Tsu current–voltage characteristic with antisymmetry: the induced current in the SLED by the LO voltage forms a rectangular wave with bumps in the positive and negative amplitudes, which are originated from the negative differential conductivity [25, 40, 41]. The envelope of the even harmonics' power had a k−3.4 dependence up to k = 20, which was almost consistent with the characteristics of the SLED-based frequency multipliers [31, 32]. The power of the higher harmonics, however, declined more steeply with a k−37 dependence. The harmonics with k > 23 were difficult to observe under our experimental condition. Thus, the maximum possible frequency to be measured by our THz counter is approximately 3.7 THz when the highest 22th harmonic is generated from the LO signal at 170 GHz. Further extension of the measurable range up to 4.7 THz is expected by the cryogenic cooling of the SLHM because of the reduced scattering of miniband electrons by acoustic and polar optical phonons, consequently increasing the electron drift velocity in the semiconductor superlattice [42].

Figure 7. (a) Relative power spectrum of the LO harmonics in the semiconductor superlattice. The power  of the kth LO harmonics are plotted as a function of the LO harmonic number k. (b) Required THz-source power
  for 25 dB SNR of the beat signal in the precise frequency measurement. The areas masked in gray have no data owing to the lack of a proper THz source for this investigation.
Download figure:
Standard image High-resolution image
Figure 7(b) shows the  required for 25 dB SNR of the beat signal with 100 kHz RBW; this SNR must be satisfied to prevent fbeat from being miscounted by conventional RF counters. The required
  against the sets of even or odd LO harmonics is given by
According to equation (6), a CW–THz source oscillating at 3.7 THz must have an output power of more than 1.9 mW for the frequency measurement by our THz counter.
5. Conclusion
We have developed a broadband and high-precision THz frequency counter based on an SLHM. Its measurable spectrum ranged over four octaves from 0.12 THz to 2.8 THz. The fractional frequency instability and measurement uncertainty of the THz counter reached 1 × 10⁻¹⁶ in the entire spectrum range. Besides, the research regarding the LO harmonics generation inside the SLHM showed that the maximum measurable frequency of our THz counter was approximately 3.7 THz at room temperature. The SLHM-based THz counter developed is simple, easy to use and operational at room temperature with a wide measurable spectrum and low uncertainty. Thus, it will be an indispensable tool for diverse THz applications including THz molecular clocks, which can potentially verify fundamental physics by detecting time variations of the electron-to-proton mass ratio.
Acknowledgments
The authors would like to thank Y Irimajiri for providing useful advice and kindly lending a Gunn oscillator and a 2 THz–QCL, and N Sekine for meaningful discussion about the SLED.