


Abstract
In the present work, we have deduced the fluorescence (ω1, ω2, ω3) and Coster–Kronig (CK)(f12, f13, f23) yields for Sn (Z = 50) and Sb (Z = 51) from the Li (i = 1–3) sub-shell x-ray intensities measured using the energy tunable synchrotron radiation employing the selective photoionization method. For both the elements, yields have been obtained using two sets of theoretical photoionization cross sections based on the non-relativistic Hartree–Fock–Slater (HFS) model and the self-consistent Dirac–Hartree–Fock (DHF) model. In case of Sb, we have obtained a third set of measured yields also by using the experimental photoionization cross sections evaluated from independent measurements of the mass-attenuation coefficients. The experimental yields for Sb are reported for the first time by us. We have compared the present deduced fluorescence and CK yields with the Dirac–Hartree–Slater model based values, the semi-empirical values tabulated by Krause and the earlier reported values. In case of Sn, using the DHF and the HFS model based photoionization cross sections, two sets of present measured L1 sub-shell fluorescence yields (ω1) are found to be 0.039 ± 0.007 and 0.036 ± 0.003, and the CK yields (f13) are found to be 0.428 ± 0.107 and 0.405 ± 0.028, respectively. In case of Sb, using three sets of the photoionization cross sections (DHF, HFS and recent experimental values), the ω1 values are measured to be 0.042 ± 0.007, 0.040 ± 0.004 and 0.047 ± 0.005, and the CK yields are measured to be 0.343 ± 0.085, 0.297 ± 0.021 and 0.247 ± 0.022, respectively. The comparison of these present measured yields with the theoretical values provided a reliable experimental evidence indicating cut-off of the intense L1–L3M4,5 CK transitions at Z = 50.
Export citation and abstract BibTeX RIS
1. Introduction
Photon induced Li (i = 1–3) sub-shell vacancies can decay through radiative, Auger and the Coster-Kronig (CK) transitions. The Auger transitions are inter-shell non-radiative transitions, whereas the CK transitions are intra-shell non-radiative transitions and these, being faster than the radiative transitions, alter the primary vacancy distribution in an atomic inner-shell. The number of Li (i = 1–3) sub-shell x-rays produced per Li sub-shell vacancy decay defines the sub-shell fluorescence yield (ωi ). The probability of a primary vacancy transfer from the Li (i = 1, 2) sub-shell to the Lj (j = 2, 3) sub-shell with simultaneous emission of an outer-shell electron defines the CK yield (fij ). Accurate and reliable data on the ωi and fij yields are required for applications [1–3] including radiation shielding, radiation transport, radiation dosimetry, and for the quantitative elemental analysis using x-ray emission techniques (EDXRF and PIXE).
Energy calculations [4] for the Li (i = 1–3) sub-shell CK transitions revealed that different CK transitions are energetically allowed only in certain specific atomic regions and these transitions represent the most dominant decay channel, when allowed energetically [5]. The sharp cut-off (energetically forbidden) or onset (energetically allowed) of different CK transitions at specific atomic numbers are expected to result in abrupt changes in the values of fluorescence and CK yields. A set of theoretical ωi and fij yields was reported by Puri et al [6] for all the elements with 25 ⩽ Z ⩽ 96. These yields were evaluated using the Dirac–Hartree–Slater (DHS) model based radiative rates [7] and the non-radiative transition rates [5] available for limited elements considering the cut-off and onset of different CK transitions as depicted by respective transition energy calculations [4]. A scan of these theoretical yields [6] for medium-Z elements (45 ⩽ Z ⩽ 55), revealed an abrupt change in the L1 sub-shell fluorescence and CK yields at Z = 50 which occurred due to the predicted [4] cut-off of the intense L1–L3M4,5 CK transitions at Z = 50. A set of semi-empirical fitted values of ωi and fij for all elements with 12 ⩽ Z ⩽ 110 was tabulated by Krause [8] based on the experimental data available till 1979.
The ωi and fij yields can be deduced by measuring the intensity of x-rays emitted from decay of vacancies in each of the Li (i = 1–3) sub-shells with the knowledge of corresponding Li sub-shell photoionization cross sections. A synchrotron radiation source provides an energy tunable photon flux enabling the selective Li sub-shell photoionization leading to a reliable method for measuring all the Li sub-shell fluorescence and CK yields. There are only a few reports [9–12] on measurements of the ωi and fij yields for medium-Z elements with 45 ⩽ Z ⩽ 55 using the synchrotron radiation induced selective Li sub-shell photoionization. Ménesguen et al [12] reported all the measured Li (i = 1–3) sub-shell yields for Ag, whereas, Scofield [13] measured the Li (i = 1–3) sub-shell CK yields for Pd using a high resolution crystal spectrometer. Later on, Chantler [14] reported the Li (i = 1–3) sub-shell fluorescence and the CK yields for Mo, Pd, Au and Pb bearing an error ∼15%–30% in the measured values. Recently, Ménesguen et al [12] reported two independent data sets of experimental fluorescence and CK yields for Sn measured at the PTB laboratory, BESSY-II, Berlin, Germany and the LNHB, France, respectively. According to the formalism employed in both these measurements [12] the reported fij values strongly depended upon the experimentally deduced fluorescence yields and the experimental f13 CK yield deduced using same formalism but two different beam line setups exhibited noticeable difference. To the best of our knowledge, experimental data on the Li sub-shell fluorescence and CK yields for Sb are not available in the literature. It may be recalled that the atomic region around Z = 50 is important because of the predicted cut-off [4] of the L1–L3M4,5 CK transitions which is initiated at this atomic number and results in an abrupt discontinuity in smoothly varying ωi and fij values as a function of atomic number.
In the present work, the Li sub-shell fluorescence (ω1, ω2, ω3) and CK (f12, f13, f23) yields for Sn and Sb have been deduced from the Li (i = 1–3) sub-shell x-ray intensities measured at different incident photon energies across their respective Li absorption edge energies. Two sets of theoretical photoionization cross sections based on the non-relativistic Hartree-Fock-Slater (HFS) model calculations by Scofield [13] and the self-consistent Dirac–Hartree–Fock (DHF) model calculations by Chantler [14] have been employed for determination of these yields, whereas, in case of the Sb an additional set of the Li (i = 1–3) sub-shell photoionization cross sections deduced from the independent measurements of mass attenuation coefficients [15] were also used. Comparison of the present deduced fluorescence and CK yields for both the elements with the theoretical [6], semi-empirical [8] and the earlier measured [12] values provided reliable evidence for cut-off of the L1–L3M4,5 CK transitions.
2. Experimental setup
The present measurements have been performed at the x-ray fluorescence beam-line of ELETTRA synchrotron radiation facility [16]. A block diagram showing experimental set up at the XRF beam line used for present measurements is shown in figure 1. A Si (111) double crystal monochromator (DCM) provided monochromatic photon beam in the range (3.7–14.0) keV with resolving power ∼1.4 × 10⁻⁴. The size of x-ray beam spot at the target position is controlled using exit slits and was adjusted during present experiment to be ∼ 200 × 100 µm2. The measurements were performed by placing the target at 45° with respect to the incident x-ray beam direction under ultra-high vacuum (UHV) conditions. The UHV chamber is equipped with seven-axis manipulator [16] for precise alignment of the target orientation with respect to the incident beam and detector axis. The monochromatic beam passes through a 12 µm thick (nominal value) diamond detector before reaching the target in order to monitor any possible fluctuations in the incident photon beam intensity. The transmitted (with target) and incident (without target) x-ray photon intensities were recorded using a Si-photodiode (SXUV100; area 100 mm2; OPTO Diode Corp., USA) placed behind (downstream) the target position.
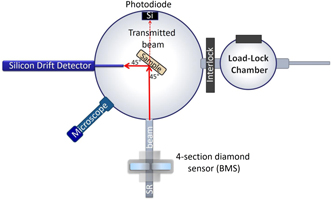
Figure 1. A block diagram of the experimental set up at the XRF beam line of Elettra synchrotron used for present measurements.
Download figure:
Standard image High-resolution imageA spectroscopically pure thin target of Sb (nominal thickness ∼10.50 ± 0.53 µg cm−2) deposited on a 3.5 µm thick mylar foil backing (Micro Matter, USA) and a thin self-supporting metallic foil of Sn (thickness ∼5.57 ± 0.08 mg cm−2) were used as experimental targets. It may be noted that an independent evaluation of the Sb target areal density was carried out using a certified multi-elemental thin sample (RMX10) procured from (AXO, Dresden, GmbH) by performing fluorescence measurements with incident photon energies between (10–14) keV. The value of 10.85 ± 0.54 µg cm−2 deduced by means of the software package PyMca [17] with XrayLib [18] database included therein was found to be in excellent agreement with the nominal value quoted by Micro Matter, USA. The mass thickness of the Sn foil was determined gravimetrically and was validated through independent transmission measurements using 10 keV photons (energy much higher than the L1 edge energy of Sn). The value of 5.34 ± 0.27 mg cm−2 obtained by using the mass attenuation coefficient for Sn at 10 keV taken from XCOM [19] was found to be in good agreement with that determined gravimetrically. The target L x-rays were produced using the incident monochromatic x-ray beam by varying its energy in small steps over the range (4.0–5.0) keV across the Li (i = 1–3) absorption edge energies of both the elements. The x-rays emitted from the target were detected using a silicon drift detector (SDD) (XFlash 5030: 30 mm2 × 450 µm, FWHM ∼131 eV at 5.89 keV, equipped with a super light element window (SLEW), Bruker Nano GmbH, Germany) coupled to a digital pulse processor (Bruker Nano GmbH, Germany) providing detector bias supply, pile up rejection, input/output rate meter, dead time correction using an internal 'zero' peak and selectable shaping time constants in the range (0.89–6.1) µs. The details of the data acquisition and control systems have been presented elsewhere [20]. During the x-ray fluorescence measurements at each of the different incident photon energies, a column area of the target comprising 11 vertically arranged pixels [1 pixel = 200 (H) ×100 (V) µm2 and it refers to the incident beam spot size] was scanned and the averaged intensities were used to evaluate the fluorescence and CK yields thereby minimizing the error due to the local non-homogeneity of both the targets.
Typical L x-ray spectra of Sb recorded at different incident photon energies (Es) are shown in figures 2(a)–(c). The figure 2(a) depicts different L3 sub-shell x-ray components, namely, Ll, Lα, Lβ6, Lβ2,15 produced at 4.250 keV incident photon energy (EL3<Es < EL2; EL2 and EL3 represents the L2 and L3 sub-shell absorption edge energies, respectively). The figure 2(b) exhibits the L2 sub-shell x-ray components, namely, Lη, Lβ1 and Lγ1,5 along with the L3 sub-shell x-ray components produced at 4.450 keV incident photon energy (EL2< Es < EL1). The figure 2(c) displays the L1 sub-shell x-ray components, namely, Lβ3,4 and Lγ2,3,4 along with the L2 and L3 sub-shell x-rays produced at 4.900 keV incident photon energy (Es > EL1). Care was taken to collect sufficient counts under different L x-ray components in the spectra recorded at different incident photon energies so as to minimize the statistical uncertainty in the measurements.
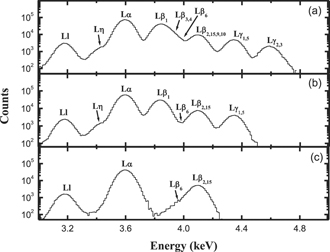
Figure 2. Typical spectra of thin 51Sb target (a) at incident photon energy 4.900 keV (Einc > EL1) depicting the characteristic L1, L2 and L3 sub-shell x-rays (b) at incident photon energy 4.450 keV (EL2 < Einc < EL1) depicting the characteristic L2 and L3 sub-shell x-rays (c) at incident photon energy 4.250 keV (EL3 < Einc < EL2) depicting the characteristic L3 sub-shell x-rays.
Download figure:
Standard image High-resolution image3. Basic formalism
Radiative decay of the Li
(i = 1–3) sub-shell vacancies results in emission of x-ray series comprising several lines in each case as depicted in figure 3. Accordingly, the L3 sub-shell x-ray series includes the Ll(L3–M1), Lα1(L3–M5), Lα2(L3–M4), Lβ2(L3–N5), Lβ5(L3–O4,5), Lβ6(L3–N1), Lβ7(L3–O1), and Lβ15(L3–N4) lines; the L2 sub-shell x-ray series includes the Lη(L2–M1), Lβ1(L2–M4), Lγ1(L2–N4), Lγ5(L2–N1), Lγ6(L2–O4), and Lγ8(L2–O1) lines and the L1 sub-shell series comprises the Lβ3(L1–M3), Lβ4(L1–M2), Lβ9(L1–M5), Lβ10(L1–M4), Lγ2(L1–N2), Lγ3(L1–N3), and Lγ4(L1–O2,3) lines. The experimental cross sections,  , for production of the Lp
(p = l, α, η, β6, β1, β3,4, β2,15,7
γ1,5, γ2,3.4) x-rays at an incident photon energy (Es
) can be evaluated using the relation
, for production of the Lp
(p = l, α, η, β6, β1, β3,4, β2,15,7
γ1,5, γ2,3.4) x-rays at an incident photon energy (Es
) can be evaluated using the relation

where  represents the Lp
photo-peak area in a recorded spectrum, t is live time for each spectrum,
represents the Lp
photo-peak area in a recorded spectrum, t is live time for each spectrum,  Lp is the detector efficiency at the Lp
x-ray energy, G represents the fraction of solid angle that the center of target views the detector aperture,
Lp is the detector efficiency at the Lp
x-ray energy, G represents the fraction of solid angle that the center of target views the detector aperture,  is instantaneous photocurrent recorded by the diamond detector placed before the target,
  represents the total accumulated charge for each recorded spectra, m is the areal density of the specific element in the target and
  is the self-absorption correction factor which accounts for the absorption of the incident and emitted photons within the target.

Figure 3. Energy level diagram showing electron transitions allowed by selection rules (Δn ⩾ 1, Δl = ±1 and Δj = 0, ±1) resulting in emission of different Li (i = 1–3) sub-shell X-rays.
Download figure:
Standard image High-resolution imageIn terms of the fundamental physical parameters characterizing the atomic inner-shell vacancy creation and decay processes, the cross sections for production of the Lp (p = l, α, β6, β2,7,15) x-rays originating following decay of the L3 sub-shell vacancies created (single and multi-step processes) at different incident photon energies, Es (s = 1–3), can be expressed as
where  (i = 1–3) represents the Li
sub-shell photoionization cross sections at energies, Es
(s = 1–3), satisfying (
(i = 1–3) represents the Li
sub-shell photoionization cross sections at energies, Es
(s = 1–3), satisfying ( ;
;  and
and  ); ELi/EK represent the Li sub-shell/K-shell absorption edge energy), fij
denotes the Li sub-shell CK yields, ω3 represents the L3 sub-shell fluorescence yield and F3p
denotes the fractional rate for emission of the Lp
x-ray line originating following decay of the L3 sub-shell vacancies. Further, the cross sections for production of the Lp
(p = η, β1, γ1,5) x-rays originating following decay of the L2 sub-shell vacancies created at different incident photon energy, Es
(s = 2, 3) can be expressed as
); ELi/EK represent the Li sub-shell/K-shell absorption edge energy), fij
denotes the Li sub-shell CK yields, ω3 represents the L3 sub-shell fluorescence yield and F3p
denotes the fractional rate for emission of the Lp
x-ray line originating following decay of the L3 sub-shell vacancies. Further, the cross sections for production of the Lp
(p = η, β1, γ1,5) x-rays originating following decay of the L2 sub-shell vacancies created at different incident photon energy, Es
(s = 2, 3) can be expressed as

where respective symbols have a similar meaning as explained above. Similarly, the cross sections for production of the Lp (p = β3, β4, β9,10, γ2,3,4) x-rays originating following decay of the L1 sub-shell vacancies created at different incident photon energies (E3) can be expressed as

The CK yield, f12, can be deduced from intensities of the L2 sub-shell x-rays measured at incident photon energies, Es (s = 2, 3), by using the following expression derived from equations (1) and (3) as

The CK yield, f23, can be deduced from intensities of the L3 sub-shell x-rays measured at incident photon energies, Es (s = 1, 2), by using the following expression derived from equations (1) and (2) as

The CK yield, f13, can be deduced from intensities of the L3 sub-shell x-rays measured at incident photon energies, Es (s = 1, 3) by using the following expression derived from equations (1) and (2) as
In equation (7) values of the CK yields, f12 and f23, determined using the equations (5) and (6), respectively, can be used. In the present work, the f12 yield have been deduced by using measured intensities of the Lγ1,5 and Lβ1 x-rays at energies, E2 and E3, in equation (5); f23 yield from measured intensity of the Lα x-rays at energies, E1 and E2, in equation (6); f13 yield from measured intensity of the Lα x-rays at energies, E1 and E3, in equation (7). It is worth noting that the equations (5)–(7) used in the present work to evaluate the CK yields are independent of the geometry factor (G), the efficiency of x-ray detector (Lp
) for the Lp
X-rays and the theoretical x-ray emission rates (Fip
).
The fluorescence yields (ωi ) can be deduced from the total Li (i = 1–3) sub-shell x-ray intensity measured at an incident photon energy, Es (s = 1–3), using the expression
Where, different symbols have the same meaning as explained above. It is worth noting that equation (8) is independent of the theoretical x-ray emission rates because the sum of fractional x-ray emission rates for all the x-ray lines from a given Li sub-shell reduces to one, i.e. ∑Fip = 1, (p = β4, β3, β9,10, γ2,3, γ4 for i = 1; p = η, β1, γ1,5 for i = 2; and p = l, α, β6, β2,15, β7 for i = 3). It may be mentioned that in case of the weak Lη, Lβ7, Lβ9,10, Lγ5 and Lγ4 x-ray peaks which cannot be easily resolved by spectrum fitting procedures, the contribution (<3%) of each of these x-ray components to the total Li sub-shell x-ray intensity measured at a given incident photon energy has been obtained from theoretical physical parameters as explained elsewhere [21].
4. Evaluation procedure
The Li
(i = 1–3) sub-shell CK (fij
) and fluorescence (ωi
) yields for Sb and Sn have been determined using the equations (5)–(7) and (8), respectively. In these evaluations, the values of the self-absorption correction factor,  , have been calculated for different Lp x-rays using the relation
where m represents the areal density of the target; θ1 and θ2, respectively, represent the angle of incidence for the incident photon beam and angle of emission for the target characteristic x-ray photons with the positive normal to the target surface;  and μemit corresponds to the mass attenuation coefficients (cm2 g−1) for the target element at the incident (Es
) and the emitted Lp
x-ray energies, respectively. These were found to be ∼0.991 and ∼0.075–0.104 for Sb and Sn, respectively. In these evaluations, the values of the mass-attenuation coefficients (μ) at different photon energies obtained from computer code XCOM [19] and those tabulated by Chantler [14] were used. These two sets of
and μemit corresponds to the mass attenuation coefficients (cm2 g−1) for the target element at the incident (Es
) and the emitted Lp
x-ray energies, respectively. These were found to be ∼0.991 and ∼0.075–0.104 for Sb and Sn, respectively. In these evaluations, the values of the mass-attenuation coefficients (μ) at different photon energies obtained from computer code XCOM [19] and those tabulated by Chantler [14] were used. These two sets of  values at different photon energies have been found to agree with each other within ∼3%.
The Lp x-ray peak area,  , in spectra recorded at different incident photon energies, Es
(s = 1–3) were evaluated using the software package ORIGIN 6.0 in which a non-linear least squares fitting routine based on the Marquardt's algorithm [22] has been implemented. In this code, different photo-peaks can be fitted using a multi-Gaussian function with the option of varying peak centroids, the FWHM as a function of energy and the background under the photo peak. The peak areas for different L x-ray components of Sb and Sn were obtained by resolving these using fitting procedures [23, 24] employing currently determined FWHM calibration of the SDD x-ray detector. For this calibration, the L x-ray spectra from different targets of Sn, Sb, Dy, Re were recorded at incident photon energies (Es
) satisfying, EL2<Es
< EL1, for each target element. In these spectra, the fitting was done for the well resolved Ll and Lγ1 x-ray peaks by keeping the peak centroids fixed to their known energy values [25] and allowing the FWHM to vary. The FWHM for the Lγ1 (most intense peak of the Lγ group of x-rays) and the Ll x-rays corresponding to the single transitions (L2−N4) and (L3−M1), respectively, have been considered and were least-squares fitted assuming E1/2 dependence (figure 4(a)). Further, the peak fitting for the different L x-ray components was performed by fixing both, the peak centroids to their known values [25] and the FWHM values interpolated from the least-squares fitted calibration curve. Fitting of the different Lp (p= l, α, η, β6, β1, β3,4, β2,7,15, γ1,5, γ2,3.4) x-rays for the Sb target at incident photon energies of 4.5 keV (EL2 < Es
< EL1) and 5.0 keV (Es
> EL1) is shown in figures 4(a) and (b). The observed Lγ and Lβ peak shapes are well reproduced by following the above fitting procedure. It may be mentioned that the observed widths of different L x-ray peaks are mainly due to Gaussian response of the x-ray detector and has mild dependence on the intrinsic Lorenzian width of the x-ray line. The FWHM for the Lorentzian broadening [26] of the L x-rays is ∼(4–12) eV as compared to the ∼(100–114) eV for the Gaussian response function of the x-ray detector in the energy region of L x-rays of Sn and Sb. In the present fitting procedure, the intrinsic width of the L x-ray lines has been taken into account to a limited extent as the FWHM calibration was obtained using Gaussian peak shape only. The smoothly varying Lorentzian tails can affect the background estimation under the weak x-ray peaks lying in vicinity of strong peaks, which may lead to some error in the area evaluation of these weak x-ray components. However, it may be recalled that the contribution of different weak L x-ray components such as Lγ5, Lβ9,10 and Lγ4 is estimated to be <3% to the total Li
(1–3) sub-shell x-ray intensity used in equation (8), which in turn, may lead to an additional error of <1% in the final result. For example, the antimony (Sb) Lγ5 (L2−N1) x-ray line of energy 4.229 keV lying on the low energy tail of Lγ1 x-ray line has the Lorentzian width ∼6 eV. Because of the small contribution of this component to the total L2 sub-shell x-ray intensity, even an error of ∼10% in the Lγ5 x-ray peak area will lead to an error <0.5% in the final result.
, in spectra recorded at different incident photon energies, Es
(s = 1–3) were evaluated using the software package ORIGIN 6.0 in which a non-linear least squares fitting routine based on the Marquardt's algorithm [22] has been implemented. In this code, different photo-peaks can be fitted using a multi-Gaussian function with the option of varying peak centroids, the FWHM as a function of energy and the background under the photo peak. The peak areas for different L x-ray components of Sb and Sn were obtained by resolving these using fitting procedures [23, 24] employing currently determined FWHM calibration of the SDD x-ray detector. For this calibration, the L x-ray spectra from different targets of Sn, Sb, Dy, Re were recorded at incident photon energies (Es
) satisfying, EL2<Es
< EL1, for each target element. In these spectra, the fitting was done for the well resolved Ll and Lγ1 x-ray peaks by keeping the peak centroids fixed to their known energy values [25] and allowing the FWHM to vary. The FWHM for the Lγ1 (most intense peak of the Lγ group of x-rays) and the Ll x-rays corresponding to the single transitions (L2−N4) and (L3−M1), respectively, have been considered and were least-squares fitted assuming E1/2 dependence (figure 4(a)). Further, the peak fitting for the different L x-ray components was performed by fixing both, the peak centroids to their known values [25] and the FWHM values interpolated from the least-squares fitted calibration curve. Fitting of the different Lp (p= l, α, η, β6, β1, β3,4, β2,7,15, γ1,5, γ2,3.4) x-rays for the Sb target at incident photon energies of 4.5 keV (EL2 < Es
< EL1) and 5.0 keV (Es
> EL1) is shown in figures 4(a) and (b). The observed Lγ and Lβ peak shapes are well reproduced by following the above fitting procedure. It may be mentioned that the observed widths of different L x-ray peaks are mainly due to Gaussian response of the x-ray detector and has mild dependence on the intrinsic Lorenzian width of the x-ray line. The FWHM for the Lorentzian broadening [26] of the L x-rays is ∼(4–12) eV as compared to the ∼(100–114) eV for the Gaussian response function of the x-ray detector in the energy region of L x-rays of Sn and Sb. In the present fitting procedure, the intrinsic width of the L x-ray lines has been taken into account to a limited extent as the FWHM calibration was obtained using Gaussian peak shape only. The smoothly varying Lorentzian tails can affect the background estimation under the weak x-ray peaks lying in vicinity of strong peaks, which may lead to some error in the area evaluation of these weak x-ray components. However, it may be recalled that the contribution of different weak L x-ray components such as Lγ5, Lβ9,10 and Lγ4 is estimated to be <3% to the total Li
(1–3) sub-shell x-ray intensity used in equation (8), which in turn, may lead to an additional error of <1% in the final result. For example, the antimony (Sb) Lγ5 (L2−N1) x-ray line of energy 4.229 keV lying on the low energy tail of Lγ1 x-ray line has the Lorentzian width ∼6 eV. Because of the small contribution of this component to the total L2 sub-shell x-ray intensity, even an error of ∼10% in the Lγ5 x-ray peak area will lead to an error <0.5% in the final result.
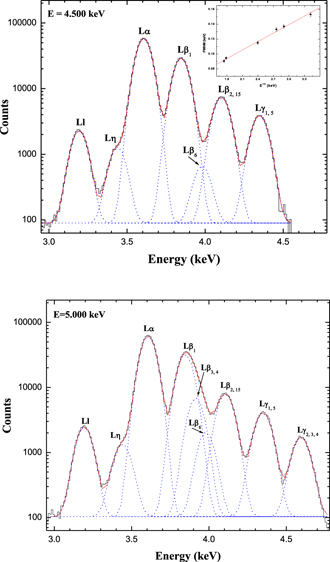
Figure 4. (a). A typical plot of spectra of the fitted X‐ray components for Sb target at incident photon energy 4.5 keV (EL2 < Es < EL1). The black (line) curve represents the measured spectra, red (bold) curve represents total fitted spectrum and green (dotted) represents different fitted peaks. The plot of FWHM for the SDD x-ray detector as a function of square root of photon energy is shown as inset. (b) A typical plot of spectra of the fitted x-ray components for 51Sb target at incident photon energy 5.0 keV (Es > EL1). The black (line) curve represents the measured spectra, red (bold) curve represents total fitted spectrum and green (dotted) represents different fitted peaks.
Download figure:
Standard image High-resolution imageFor determination of the geometry factor, G, a thin multi-elemental target (RMX10) composed of Al, Ti, Cr, Ni and Cu thin successive layers (areal density ∼10 µg cm−2 for each element) prepared on the 200 nm thick Si3N4 membrane procured from AXO, Dresden GmbH was used [16]. The factor, G, was obtained by measuring the K x-ray yields from different elements present in this target employing the same geometrical set up as the one used for recording the Lp x-ray spectra from Sn and Sb targets by using the relation

where m is the areal density of the specific element in the multi-elemental target and the other symbols have the same meaning as explained above. In these evaluations, the theoretical K x-ray production (XRP) cross sections for different elements were taken from reference [27]. In this manner the G value was obtained experimentally and the measured value ∼(1.55 ± 0.06) × 10−3 found to agree with that geometrically calculated value within 2%.
The efficiency () of the SDD x-ray detector was evaluated over the energy region (3–10) keV using the relation
Where, tpoly, tAl, tSi,grid and tSi,cryst represent the thickness of polymer window, the Al layer, the Si grid and the Si detector crystal, respectively and A is the open area. The values of different layers have been taken as explained elsewhere [16]. The mass-attenuation coefficients for polymer window, Al and Si obtained from XCOM [19] were used. The detector efficiency over the energy region (3–10) keV calculated using equation (11) is almost constant (∼0.76–0.77) and is mainly defined by the manufacturing features of the Si grid open area (A) and is almost insensitive to the Si grid and other layer's thicknesses [16].
In the present evaluation of experimental ωi
and fij
yields using equations (5)–(8), two sets of the Li
(i = 1–3) sub-shell photoionization cross sections based on the self-consistent DHF model [14] and the non-relativistic HFS model [13] have been used. The corresponding sets of the present measured CK and fluorescence yields are denoted as fij
(exp)Ch and ωi
(exp)Ch; fij
(exp)Sc and ωi
(exp)Sc, respectively. The DHF model based Li
(i = 1–3) sub-shell photoionization cross sections  for Sb and Sn over the energy region (4–5) keV across their Li
edge energies have been derived from the total photoelectric mass attenuation coefficients (
for Sb and Sn over the energy region (4–5) keV across their Li
edge energies have been derived from the total photoelectric mass attenuation coefficients ( ) tabulated by Chantler [14] using the concept of absorption-edge jump ratios (JLi
) as explained in our earlier reference [25]. The non-relativistic HFS model based photoionization cross sections tabulated by Scofield [13] are available only at limited energies above the Li
(i = 1–3) edge energies of Sb and Sn. These cross sections at the required incident photon energies have been interpolated/extrapolated from the tabulated values by using the logarithmic interpolation method considering an energy dependence of the form (aEb
) for a given element as explained elsewhere [25]. These two sets of the theoretical Li
(i = 1–3) sub-shell photoionization cross sections
) tabulated by Chantler [14] using the concept of absorption-edge jump ratios (JLi
) as explained in our earlier reference [25]. The non-relativistic HFS model based photoionization cross sections tabulated by Scofield [13] are available only at limited energies above the Li
(i = 1–3) edge energies of Sb and Sn. These cross sections at the required incident photon energies have been interpolated/extrapolated from the tabulated values by using the logarithmic interpolation method considering an energy dependence of the form (aEb
) for a given element as explained elsewhere [25]. These two sets of the theoretical Li
(i = 1–3) sub-shell photoionization cross sections  and
and  for Sn and Sb are found to differ up to ∼10% (figure 5).
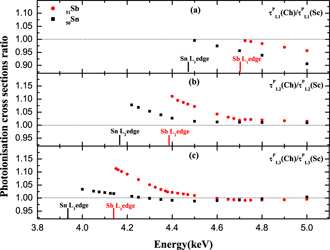
Figure 5. Comparison of two theoretical sets of (a) the L1 sub-shell (b) the L2 sub-shell (c) the L3 sub-shell photoionization cross sections for 50Sn and 51Sb at energies ranging (4.0–5.0) keV tabulated by Scofield [13] and Chantler [14]. The dotted line is plotted to guide the eye.
Download figure:
Standard image High-resolution imageIt may be noted that the validity of the absorption edge jump ratio method to deduce partial photoionization cross sections from total photoelectric attenuation coefficients has been checked by comparing the ratios ( ,
,  ,
,  calculated from the Li
(i = 1–3) sub-shell photoionization cross sections for Sb at different energies across its Li
edge energies deduced from total photoionization attenuation coefficients taken from XCOM [19] employing the absorption edge jump ratio (JLi
)XCOM method [28] with the corresponding ratios deduced from the Li
(i = 1–3) sub-shell photoionization cross sections interpolated from tables of Scofield [13] (figure 6). Two sets of ratios are found to match within 4%. It may be recalled that the total photoionization attenuation coefficients provided by the computer code XCOM [19] are those tabulated by Scofield [13]. A good agreement between these two sets of ratios over short energy intervals in vicinity of the Li edge energies of Sb justifies the use of absorption edge jump ratio method [28] employed in present work to deduce the DHF model [14] based Li
(i = 1–3) sub-shell photoionization cross sections,
calculated from the Li
(i = 1–3) sub-shell photoionization cross sections for Sb at different energies across its Li
edge energies deduced from total photoionization attenuation coefficients taken from XCOM [19] employing the absorption edge jump ratio (JLi
)XCOM method [28] with the corresponding ratios deduced from the Li
(i = 1–3) sub-shell photoionization cross sections interpolated from tables of Scofield [13] (figure 6). Two sets of ratios are found to match within 4%. It may be recalled that the total photoionization attenuation coefficients provided by the computer code XCOM [19] are those tabulated by Scofield [13]. A good agreement between these two sets of ratios over short energy intervals in vicinity of the Li edge energies of Sb justifies the use of absorption edge jump ratio method [28] employed in present work to deduce the DHF model [14] based Li
(i = 1–3) sub-shell photoionization cross sections,  , at different incident photon energies over a limited range (4.0–5.0) keV.

Figure 6. A comparison of the ratios of different Li (i = 1–3) sub-shell photoionization cross sections (a) τL2/τL1 (b) τL3/τL1 and (c) τL3/τL2 for 51Sb at energies across its Li edge energies deduced from total photoionization attenuation coefficients taken from XCOM [19] using edge jump ratio method with those taken from Scofield [13] tabulations.
Download figure:
Standard image High-resolution image5. Results and discussion
The present deduced two sets of the Li (i = 1–3) sub-shell CK [fij (exp)Sc, fij(exp)Ch] and fluorescence [ωi (exp)Sc, ωi (exp)Ch] yields for Sn and Sb along with the theoretical [6], semi-empirical [8] and the earlier measured [12] values are listed in tables 1 and 2, respectively. In case of Sb the third set of CK [fij (exp)SK] and fluorescence [ωi (exp)SK] yields deduced using the Li (i = 1–3) sub-shell photoionization cross sections determined from independently measured [12] mass attenuation coefficients is also included in table 2. The average values of experimental yields deduced from spectra recorded at four different incident photon energies above each of the Li (i = 1–3) edge energies of Sb and Sn are listed in these tables. Care was taken not to choose incident energies in immediate vicinity of the Li (i = 1–3) edges to avoid the influence of the fine structure (XANES) and the resonant Raman scattering (RRS) processes on the present measurements. The estimated overall error in the present measured CK and fluorescence yields has been obtained as the quadrature sum of errors in different parameters as listed in table 3. The uncertainties in ωi and fij values based on the DHS model [6] and those tabulated by Krause [8] have also been mentioned in this table. It may be mentioned that if contribution of all the diagram lines from a given Li sub-shell is included in equations (5)–(7) as proposed by Kolbe et al [11] then uncertainty (including error introduced during deconvolution of overlapping lines) in the observed intensity of each contributing line will propagate to enhance the overall uncertainty in the measured CK yield values.
Table 1. The Li (i = 1–3) sub-shell fluorescence (ωi ) and CK (fij ) yields for Sn.
| Fluorescence/CK yields | Present measured values | Theoretical/semi-empirical values | Earlier measurements | |
|---|---|---|---|---|
| DHS [6] | Krause [8] | |||
| f12 | 0.144 ± 0.023 | 0.188 | 0.17 | 0.068 ± 0.003 |
| 0.070 ± 0.004 | 0.072 ± 0.005 | |||
| f23 | 0.155 ± 0.025 | 0.167 | 0.157 | 0.18 ± 0.03 |
| 0.118 ± 0.006 | 0.17 ± 0.05 | |||
| f13 | 0.428 ± 0.107 | 0.323 | 0.270 | 0.85 ± 0.036 |
| 0.405 ± 0.028 | 0.29 ± 0.015 | |||
| ω1 | 0.039 ± 0.007 | 0.036 | 0.037 | 0.034 ± 0.002 |
| 0.036 ± 0.003 | 0.038 ± 0.005 | |||
| ω2 | 0.066 ± 0.011 | 0.068 | 0.065 | 0.060 ± 0.002 |
| 0.070 ± 0.006 | 0.071 ± 0.005 | |||
| ω3 | 0.066 ± 0.011 | 0.070 | 0.064 | 0.068 ± 0.003 |
| 0.067 ± 0.006 | 0.072 ± 0.003 | |||
aPresent measured values deduced using photoionization cross sections tabulated by Chantler [14]. bPresent measured values deduced using photoionization cross sections tabulated by Scofield [13]. cMeasurements done at LNHB [12]. dMeasurements done at PTB [12].
Table 2. The Li (i = 1–3) sub-shell fluorescence (ωi ) and CK (fij ) yields for Sb.
| Theoretical/semi-empirical values | |||
|---|---|---|---|
| Fluorescence/CK yields | Present measured values | DHS [6] | Krause [8] |
| f12 | 0.161 ± 0.026 | 0.190 | 0.170 |
| 0.079 ± 0.004 | |||
| 0.106 ± 0.008 | |||
| f23 | 0.206 ± 0.033 | 0.169 | 0.156 |
| 0.124 ± 0.006 | |||
| 0.129 ± 0.009 | |||
| f13 | 0.343 ± 0.085 | 0.325 | 0.280 |
| 0.297 ± 0.021 | |||
| 0.247 ± 0.022 | |||
| ω1 | 0.042 ± 0.007 | 0.038 | 0.039 |
| 0.040 ± 0.004 | |||
| 0.047 ± 0.005 | |||
| ω2 | 0.079 ± 0.013 | 0.073 | 0.069 |
| 0.084 ± 0.008 | |||
| 0.078 ± 0.009 | |||
| ω3 | 0.077 ± 0.012 | 0.075 | 0.069 |
| 0.081 ± 0.008 | |||
| 0.076 ± 0.009 | |||
aPresent measured values deduced using photoionization cross sections tabulated by Chantler [14]. bPresent measured values deduced using photoionization cross sections tabulated by Scofield [13]. cPresent measured values deduced using experimental [15] photoionization cross sections.
Table 3. Estimation of uncertainties in the present measured Li (i = 1–3) sub-shell fluorescence and CK yields and those tabulated by Krause.
| f12 | f23 | f13 | ωi (i = 1–3) | |
|---|---|---|---|---|
| Peak area | ∼3% (Lγ1,5 x-ray) | ∼1% (Lα x-ray) | ∼1% (Lα x-ray) | ∼1%–4% |
| <2% (Lβ1 x-ray) | ||||
| Chi2 | ∼5–7 | |||
| R2 | 0.99 | |||
| Residue | Always between ±2σ | |||
| Peak width (FWHM) | (100–114) eV in the energy region (3.0–4.8) keV | |||

| ||||
| Sn foil | ∼4% | ∼4% | ∼4% | ∼4% |
| Sb target | <1% | <1% | <1% | <1% |
Theoretical  values values | ||||
| Chantler [14] | ∼15% | ∼15% | ∼15% | ∼15% |
| Scofield [13] | ∼1% | ∼1% | ∼1% | ∼1% |
| Exp [12] | ∼6% | ∼6% | ∼6% | ∼6% |
Incident flux 
| <1% | <1% | <1% | <1% |

| — | — | — | <5% |
| Areal density (m) of target | — | — | — | |
| Sn foil | <2% | |||
| Sb target | ∼5% | |||
| Error in present measured f12 and f23 values | — | — | ∼5% and ∼16% | — |
| ∼5% and ∼15% | ||||
| ∼7% and 7% | ||||
| Over all uncertainty in measured values | ∼5% in (f12)Sc | ∼5% in (f23)Sc | ∼7% in (f13)Sc | ∼9% in (ωi )Sc |
| ∼16% in (f12)Ch | ∼16% in (f23)Ch | ∼25% in (f13)Ch | ∼17% in (ωi )Ch | |
| ∼7% in (f12)SK | ∼7% in (f23) SK | ∼9% in (f13) SK | ∼11% in (f12) SK | |
| Uncertainty in values tabulated by Krause [8] | ∼20% | ∼20% | ∼15% | ∼5%–20% |
| Uncertainty in DHS model [6] based values | ∼2% | ∼2% | ∼2% | ∼2% |
aComputational error. bUncertainty due to convergence precision and additional structure (XAFS/solid state effects). cUncertainty in values deduced from experimental mass attenuation coefficients.
At first, it can be observed from tables 1 and 2 that for both Sb and Sn, the ωi (DHS) (i = 1–3) [6] values differ by ∼3%–9% from the ωi (Kr) [8] values. Two sets of the present deduced experimental ωi (exp)Sc and ωi (exp)Ch (i = 1–3) yields match well, within experimental error, with each other for both the elements and are also found to agree well with the two sets of tabulated values, ωi (DHS) [6] and ωi (Kr) [8]. These values for Sn are also found to agree with those reported earlier [12]. Further, in case of Sb the third set of present deduced ωi (exp)SK (i = 1–3) values are found to be in general agreement with the other two sets of present deduced ωi (exp)Sc (i = 1–3) and ωi (exp)Ch values as well as with the two sets of tabulated [6, 8] values.
Concerning the CK yields, it is obvious from tables 1 and 2 that the CK yields, fij (DHS) [6], differ by 6%–20% from the fij (Kr) [8] values for both Sb and Sn. In case of Sb, the present measured two sets of CK yields, f13(exp)Sc, and f13(exp)Ch, are found to agree well, within experimental error, with each other and also with the f13(DHS) [6] and f13(Kr) [8] values. However, the f13(exp)SK value is lower by 31% and 13% than the f13(DHS) [6] and f13(Kr) [8] values, respectively. In case of Sn, the present measured two sets of CK yields, f13(exp)Sc and f13(exp)Ch, are found to agree well with each other but are significantly higher than the tabulated values [6, 8]. It may be noted that two sets of earlier reported [12] values of f13 for Sn differ by a factor of three and are also found to differ significantly from the present measured f13(exp)Sc, and f13(exp)Ch values. The present measured f12(exp)Sc and f12(exp)Ch values for both the Sn and Sb, are found to differ significantly from each other. However, the present deduced f12(exp)Ch yields bearing an uncertainty of ∼16% exhibited general agreement with the tabulated yields [6, 8] for both these elements. On the other hand, the present deduced f12(exp)Sc value for Sn match well with earlier reported values [12] and this value for Sb is more closer to the f12(exp)SK value deduced in the present work from the experimental photoionization cross sections [12]. Similarly, the present measured f23(exp)Ch and f23(exp)Sc values are found to differ considerably from each other for both the investigated elements, whereas, the present measured f23(exp)Sc and f23(exp)SK values for Sb are found to be in excellent agreement with each other. The present deduced f23(exp)Ch values are found to be in general agreement with the tabulated values [6, 8] for both the elements.
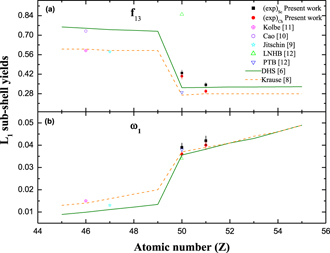
The earlier measured [9–11], semi-empirical [8] and the DHS [6] model based L1 sub-shell fluorescence and CK yields for Pd, Ag, In and Sn are listed in table 4 for comparison purpose. All these values along with the present measured L1 sub-shell fluorescence and CK yields have been plotted as a function of atomic number in figure 7. It may be noted from table 4 and figure 7 that the DHS model [6] based ω1 value increases by factor of ∼2.7 from In to Sn, whereas the CK yield, f13, decreases by a factor of ∼2.3 from In to Sn. Similarly, the semi-empirical [8] ω1 value increases by factor of ∼1.8 from In to Sn, whereas the CK yield, f13, decreases by a factor of ∼2.2 from In to Sn. The sudden changes in values from Z = 49 to Z = 50 can be understood considering the theoretically predicted [4] cut-off of the L1–L3M5 CK transition at Z = 50. It may be recalled [6] that the fluorescence and CK yields are calculated from radiative and non-radiative transition rates using relations [ωi
= ΓR(Li
X)/Γ(Li
); X = Lj
, M, N, O, j > i] and [ ]; ΓR, ΓA and Γ represents the radiative, Auger and total level width. The cut-off of the intense L1–L3M5 CK transition at Z = 50 results in considerable decrease in the L1 level width [
![${\Gamma}\left({\text{L}}_{1}\right)\left. \right]$](https://content.cld.iop.org/journals/0026-1394/58/3/035002/revision3/metabe988ieqn27.gif) and hence leads to the sudden change in the L1 sub-shell yields (ω1, f12 and f13) for Sn. It is clear from figure 7 that the earlier [9–12] and the present measured L1 sub-shell yields for different elements show an abrupt change in value at Z = 50, thereby providing an experimental evidence for cut-off of the intense L1–L3M4,5 CK transitions for Sn.
and hence leads to the sudden change in the L1 sub-shell yields (ω1, f12 and f13) for Sn. It is clear from figure 7 that the earlier [9–12] and the present measured L1 sub-shell yields for different elements show an abrupt change in value at Z = 50, thereby providing an experimental evidence for cut-off of the intense L1–L3M4,5 CK transitions for Sn.
Table 4. Measured, semi-empirical and theoretical values of the L1 sub-shell yields for different elements.
| Element | ω1 | f13 | f12 | |||
|---|---|---|---|---|---|---|
| 46Pd | 0.015 ± 0.001 [11] | 0.0099 [6] | 0.730 ± 0.039 [10] | 0.750 [6] | 0.047 ± 0.001 [10] | 0.065 [6] |
| 0.014 [8] | 0.589 ± 0.131 [11] | 0.600 [8] | 0.080 ± 0.008 [11] | 0.100 [8] | ||
| 47Ag | 0.013 ± 0.002 [9] | 0.011 [6] | 0.580 ± 0.05 [9] | 0.740 [6] | 0.140 ± 0.03 [9] | 0.068 [6] |
| 0.016 [8] | 0.590 [8] | 0.100 [8] | ||||
| 49In | — | 0.013 [6] | — | 0.728 [6] | — | 0.074 [6] |
| 0.020 [8] | 0.590 [8] | 0.100 [8] | ||||
| 50Sn | 0.039 ± 0.007 | 0.036 [6] | 0.428 ± 0.107 | 0.323 [6] | 0.144 ± 0.014 | 0.188 [6] |
| 0.036 ± 0.003 | 0.037 [8] | 0.405 ± 0.021 | 0.270 [8] | 0.070 ± 0.002 | 0.170 [8] | |
aPresent measured values deduced using photoionization cross sections tabulated by Chantler [14]. bPresent measured values deduced using photoionization cross sections tabulated by Scofield [13].
Figure 7. Plot of the (a) L1 sub-shell CK yield and (b) L1 sub-shell fluorescence yield as a function of atomic number. Two sets of present measured fluorescence [ω1(exp)Sc (black), ω1(exp)Ch (red)] and CK [f13(exp)Sc (black), f13(exp)Ch (red)] yields, earlier reported values [9–12] along with the DHS [6] model based values and those tabulated by Krause [8] have been included in this plot.
Download figure:
Standard image High-resolution image
6. Conclusions
The present measured Li (i = 1–3) sub-shell fluorescence yields for Sn and Sb have been found to agree well with the tabulated [6, 8] as well as earlier reported values [12]. The present deduced CK yields, f13(exp)Sc and f13(exp)Ch, values have been found to agree well with each other for both the investigated elements. In case of Sb, these present deduced values exhibited good agreement with both the, f13(DHS) [6] and the f13(Kr) [8] values. The present measured f12(exp)Ch and f23(exp)Ch yields with an uncertainty ∼16% are found to be in general agreement with the tabulated yields [6, 8] for both the Sn and Sb. It may be noted that the attenuation data tabulated by Chantler [14], particularly at energies in proximity to the absorption edge energies, are claimed to be based on more refined IPA model calculations. Further, it may be recalled that the equation (8) used to deduce the fluorescence yields is independent of the x-emission rates and the equations (5)–(7) used to deduce the CK yields are independent of both the x-ray emission rates and the fluorescence yields contrary to the formalism used in earlier reported values [12]. Moreover, the CK yields (fij ) have been deduced in the present work using the most intense x-ray component among the Li (i = 1–3) sub-shell x-rays rather than using all the components thereby reducing the uncertainty in contrast to earlier reported values [12]. The trend of measured fluorescence and CK yields for different elements with Z = 46–50 (table 4 and figure 7) in comparison to the tabulated values [6, 8] clearly provided the experimental evidence for cut-off of the intense L1–L3M4,5 CK transitions at Z = 50 as predicted by the CK transition energy calculations [4].
It may be stated that the present deduced CK yields strongly depend on the ratios of Li (i = 1–3) sub-shell photoionization cross sections at different incident photon energies across the Li (i = 1–3) edge energies of both the investigated elements. These cross sections based on the independent particle approximation (IPA) models [13, 14] have been used in the present work. The IPA models completely ignore the many body effects [29, 30] including the electron correlations which are expected to become significant at the incident photon energies in the vicinity of Li edge energies. Therefore, the theoretical values of the Li sub-shell photoionization cross sections based on the IPA models incorporating the many body effects and the solid state effects are highly desirable to apprehend the observed differences between measured and theoretical yields.
Acknowledgments
Sandeep Kaur duly acknowledges the financial support by CSIR, New Delhi in form of Junior Research fellowship (JRF). The financial support provided by the International Atomic Energy Agency (IAEA), Vienna, Austria to Sanjiv Puri in form of a research project (Contract No. 18259) is duly acknowledged. We also wish to thank Dr. Werner Jark at Elettra Sincrotrone, Trieste, Italy for providing technical support during the beam time.