

Abstract
General lighting is undergoing a revolutionary change towards LED-based technologies. To provide firm scientific basis for the related colorimetric and photometric measurements, this paper presents the development of new white-LED-based illuminants for colorimetry, and their evaluation to recommend a new reference spectrum for calibration of photometers. Spectra of 1516 LED products were measured and used to calculate eight representative spectral power distributions for LED sources of different correlated colour temperature categories. The suitability of the calculated representative spectra for photometer calibration was studied by comparing average spectral mismatch errors with CIE Standard Illuminant A, which has been used for decades as the reference spectrum for incandescent standard lamps in calibration of photometers. It was found that in general, when compared with Standard Illuminant A, all the potential LED calibration spectra reduced spectral mismatch errors when measuring LED products. Out of the potential LED calibration spectra tested, the white LED spectrum with correlated colour temperature of 4103 K was found to be the most suitable candidate to complement Standard Illuminant A in luminous responsivity calibrations of photometers. When compared with Standard Illuminant A, employing the 4103 K reference spectrum reduced the spectral mismatch errors, on average, by approximately a factor of two in measurements of LED products and lighting. Furthermore, the new LED reference spectrum was found to reduce the spectral mismatch errors in measurements of daylight, and many types of fluorescent and discharge lamps, indicating that the proposed reference spectrum is a viable alternative to Standard Illuminant A for calibration of photometers.
Export citation and abstract BibTeX RIS

Original content from this work may be used under the terms of the Creative Commons Attribution 3.0 licence. Any further distribution of this work must maintain attribution to the author(s) and the title of the work, journal citation and DOI.
1. Introduction
The advantages of white LED lamps as photometric calibration sources have been considered [1], as incandescent lighting is being phased out and superseded by solid-state lighting products [2–6]. Still, photometers used for measuring modern LED products are commonly calibrated using tungsten filament incandescent standard lamps with Standard Illuminant A spectrum [7–11], defined by the International Commission on Illumination (CIE) in 1931 [12]. This inevitably leads to spectral mismatch between the calibration source and the LED product under test, which results in increased uncertainty in the quantities measured using the calibrated photometer. Previously, it has been shown that the maximum errors due to spectral mismatch could be reduced by a factor of three by using two LED-based calibration sources instead of an incandescent one [1].
In addition to the spectral mismatch issue, future availability of incandescent calibration sources for photometry is also under question [1]. Furthermore, tungsten filament standard lamps have far more limited operational lifetime and are mechanically more fragile when compared with LEDs [13–17]. LED lamps can be built to maintain their luminous flux output and correlated colour temperature (CCT) within one percent for the operational periods of up to 25 000 h [17].
The aim of this paper is to analyse and propose a set of new LED illuminants for colorimetry [18], and to select one of these illuminants to complement Standard Illuminant A as the reference spectrum for calibration of photometers. Currently, the official illuminants used in colorimetry have been published in CIE Technical Report No. 15: colorimetry [19]. The published set of illuminants includes spectral data for daylight of different types, and for various incandescent, fluorescent, and discharge lamps. LED illuminants are required to allow accurate colorimetric analysis of light and materials in LED lighting conditions. To achieve this, in this paper, eight representative spectral power distributions (RSPDs) are determined from the amassed spectral data of 1516 white LED sources to represent products of eight different CCT categories for colorimetry. Then, using spectral responsivity data of 107 photometers, the most suitable RSPD for photometer calibration is selected by determining the one producing the smallest spectral mismatch errors when measuring different types of light. Compatibility with existing practices, methods, and equipment used in colorimetry and photometry is considered in the analysis.
2. Methods
2.1. Collection of white LED spectra
For the study, the relative spectral power distributions of 1516 LED products of different types were measured; including AC- and DC-operated bulbs, spots, tubes, street lamps, LED strips, downlight luminaires, prints and textures by a large number of manufacturers. Measurements of the products were carried out in various laboratories, including manufacturers of LED products, test laboratories, and National Metrology Institutes (NMIs). The products included in the study were manufactured in the timespan of 2009–2016. Throughout the measurements, the products were operated in stable operating conditions using regulated voltage sources. The spectral data were measured using integrating spheres, goniometers, and optical rails, equipped with scanning or array spectroradiometers, in the wavelength range of at least 360–830 nm. The vast majority of the data were measured in  geometry. Table 1 lists the percentages of the spectra collected per type of the system used for the measurement.
Table 1. The systems used for acquisition of the spectral data.
| Method | Spectroradiometer | Share ( ) ) |
|---|---|---|
| Sphere | Array | 36.5 |
| Sphere | Scanning | 6.1 |
| Goniometer | Scanning | 30.2 |
| Goniometer | Array | 20.9 |
| Bench | Array | 6.3 |
The CCTs of the products were calculated using the minimum search method [18, 20], which determines the black body temperature that results in the smallest difference between the chromaticities of the light source and the point in the Planckian locus. Figure 1 shows the CCT distribution of the spectra collected for this study. Nine lamps with CCTs of over 20 000 K were marked off as outliers since they cannot be considered suitable for regular lighting purposes. The CCTs of the remaining lamps ranged from 1705 K to 17437 K with the median being 3149 K. The rightmost bin in figure 1 includes 22 spectra from 8100 K onwards and the leftmost bin contains three spectra below 1900 K. These spectra were retained because sources with such CCTs may turn up as LED products to be measured. However, removing these spectra from the analysis would still yield the same representative spectra.
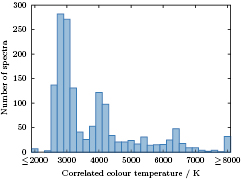
Figure 1. Correlated colour temperature distribution of the spectra measured for the study.
Download figure:
Standard image High-resolution imageDue to the fact that the vast majority of the products were based on luminophore-converted blue LEDs, or blue-pumped white LEDs, this LED technology was chosen as the basis for the analysis of the RSPDs. Furthermore, luminophore-converted blue LEDs were considered most suitable for actual calibration sources due to the good availability, relatively simple design, and well behaving ageing characteristics compared with other white LED technologies.
2.2. Spectral mismatch errors
Figure 2 shows the differences between the spectra of a luminophore-converted blue LED and Standard Illuminant A. Despite having similar CCTs, 2850 K and 2856 K respectively, the two spectral power distributions are disparate. The two local maxima in the LED spectrum are the peak caused by the blue LED element of the lamp, at 455 nm, and the broad luminophore peak, at 604 nm. Also plotted in the figure is the curve, CIE  , representing the spectral sensitivity of the human eye [21].
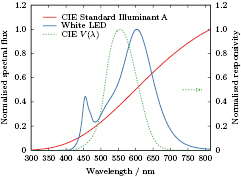
Figure 2. Normalised spectra of Standard Illuminant A (2856 K) and a white LED (2850 K), plotted together with  curve, representing the normalised spectral sensitivity of the human eye.
Download figure:
Standard image High-resolution imageIn photometric measurements, the deviating spectral shapes of the lamp under test, or device under test (DUT), and the calibration source need to be taken into account using spectral mismatch correction factor F. This correction factor can be calculated using the equation [22]

where  and
and  are the spectral power distributions of the DUT and the calibration source, respectively, and
  is the relative spectral responsivity of the photometer.
Equation (1) shows that if  , then F = 1, and thus the spectral mismatch correction is not required. Having an ideal photometer with
  would render the correction redundant as well. If no spectral data for the DUT are available, spectral mismatch errors must be included as a part of the measurement uncertainty budget.
For the comparison of different calibration spectra in the spectral mismatch analysis, the relative spectral responsivity data for 107 photometers were used. These data represent real photometers that are used in photometric measurements at NMIs, industrial test laboratories, and in the field. The spectral responsivities of the photometers were measured during a time period of several years. The dataset includes commercial instruments from eight different manufacturers ranging from handheld illuminance meters to laboratory grade photometer heads. The filter technologies of the detectors included mosaic, stacked glass, and thin-film interference filters. The general  mismatch indices
  [23] of these photometers ranged from 0.005 to 0.088, with the average being 0.032. Figure 3 shows the mean of spectral responsivities of the photometers along with the range of responsivity values measured at each wavelength. The responsivities have been normalized to unity at 555 nm. The figure also shows the deviation of the mean responsivity from the ideal
  curve.
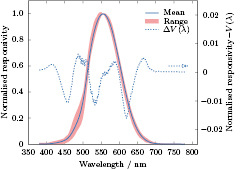
Figure 3. The blue solid line is the mean of the spectral responsivities of the 107 photometers used in this study. The shaded area illustrates the range of the responsivities measured for these photometers at each wavelength. The dotted line shows the difference between the mean curve and  .
.
Download figure:
Standard image High-resolution imageFor the LED spectrum in figure 2 as  and the 107 photometers, the spectral mismatch errors (F − 1) would range from
  to 1.46
 when using Standard Illuminant A as
  . This indicates the magnitude of spectral mismatch errors that can arise despite the similar CCT values of the DUT and the calibration spectrum.
2.3. Representative white LED spectral power distributions
In order to determine the new candidate LED illuminants, the collected LED spectra were first used to calculate the representative spectral power distributions for different CCT categories. Out of the collected spectral data, 1119 blue-pumped white LED spectra were normalised and binned according to their CCTs into eight bins based on American National Standards Institute (ANSI) standard C78.377.2011 [24]. The bins corresponded to the CCT categories of 2700 K, 3000 K, 3500 K, 4000 K, 4500 K, 5000 K, 5700 K, and 6500 K.
First, for each CCT bin, the centroid spectral power distribution (CSPD) was determined by finding the closest spectrum to all the other spectra in the bin. The closeness score C, quantifying the cross-similarity between the spectra of a bin, was calculated using equation
where  represents the bin, i and j are the indices of the spectra in the bin, and d is the distance function defined as
Distance function d gives the Euclidean distance between the two spectra. The eight CSPDs were the spectra with the highest closeness score C in their bin. The step of l in the summation is 1 nm.
For the purpose of not favouring any specific commercial LED product in selection of the representative spectra, several different methods of averaging multiple spectra were tested [25]. Averaging a CSPD with the nine spectra closest to it in the bin was found to be the most suitable for obtaining a spectrum with feasible spectral features. Before the averaging, the spectral data were corrected for the bandwidths of the spectroradiometers employed in the measurements by applying Wiener deconvolution.
Finally, the eight spectra obtained by averaging each CSPD with the nine closest spectra, were smoothed using Savitzky–Golay filter [26] to reduce any ripples due to measurement noise. To avoid distorting the spectra in the wavelength range of 430–470 nm, corresponding to the blue peaks of the spectral distributions, smoothing of the averaged spectra was reduced in this region. This was done by combining the filtered and unfiltered spectral data by using gradual transition between each two datasets in the vicinity of the blue peaks. To further reduce errors in the lower wavelength regions caused by noise, and stray light in single grating spectroradiometers, the spectra were linearly extrapolated below 410 nm based on the filtered, logarithmically scaled data of the wavelength region from 410 nm to 430 nm.
The eight RSPDs obtained as the result are shown in figure 4. The RSPDs were submitted to CIE Division 1 technical committee TC 1-85, in charge of updating CIE Technical Report No. 15: colorimetry [19]. Five of these RSPDs are considered to be included in the upcoming CIE technical report. These RSPDs correspond to the CCT bins of 2700 K, 3000 K, 4000 K, 5000 K, and 6500 K. In figure 4, they are presented using solid lines. Because the CCTs of the obtained spectral power distributions naturally deviate from the nominal CCTs of the bins, for this article, the RSPDs are named using BL prefix, describing their type (blue-pumped LED), followed by the first two digits of the CCT bin, e.g. BL27 for 2700 K.
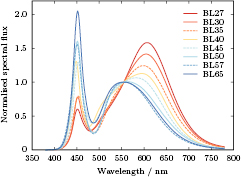
Figure 4. The representative spectral power distributions (RSPDs) determined from the collected LED spectra. Those five RSPDs considered to be included in the upcoming CIE technical report are shown using solid lines.
Download figure:
Standard image High-resolution imageTable 2 shows the colorimetric characteristics of the five RSPDs potentially to be used as LED illuminants in colorimetry. In the table, x and y are the chromaticity coordinates of CIE 1931 colour space [19], and Ra and Rf are the CIE defined colour rendering and colour fidelity indices [27, 28], respectively.
Table 2. Colorimetric properties of the representative spectral power distributions determined from the collected LED spectra.
| Name | CCT (K) | x | y | Ra | Rf |
|---|---|---|---|---|---|
| BL27 | 2733 | 0.4560 | 0.4078 | 82 | 84 |
| BL30 | 2998 | 0.4357 | 0.4012 | 83 | 84 |
| BL40 | 4103 | 0.3756 | 0.3723 | 85 | 85 |
| BL50 | 5109 | 0.3422 | 0.3502 | 77 | 77 |
| BL65 | 6598 | 0.3118 | 0.3236 | 80 | 80 |
2.4. White LED reference spectrum for calibration of photometers
The five RSPDs considered for use in colorimetry were taken as the starting point for selecting a potential LED reference spectrum for calibration of photometers. To determine the RSPD which would on average produce the smallest spectral mismatch errors, the average spectral mismatch correction factors were calculated for the five RSPDs using equation (1), with each candidate RSPD in turn as  , the 1507 measured LED spectra as
  , and the 107 spectral photometer responsivities as
  . In addition to calculating the spectral mismatch errors once for every DUT, RSPD, and photometer combination, the DUT spectra were grouped according to their CCTs, and the groups were weighted to see the impact of different CCT distributions of lighting products available on the market. Furthermore, the possibility of having two or three calibration spectra of different CCTs was studied, including the effects of operator mistakes when selecting the optimal calibration factor for the instrument based on an estimate of the CCT of light being measured. The suitability of each RSPD for calibrating photometers measuring non-LED light was also investigated.
In the case of a single calibration spectrum, the spectral mismatch correction factors were calculated for every  and
and  combination, while each RSPD, in turn, was acting
  . The mean absolute spectral mismatch errors (MAE) were obtained for each candidate RSPD using

where i is the index of the RSPD, j is the index of  and
and  combination, and N is the total number of these combinations (
 ). For comparison, the analysis was repeated using Standard Illuminant A as the calibration spectrum
  .
.
Due to the fact that the CCT distribution of the spectral data collected for the study did not necessarily represent the average market share of LED products, the data in each CCT bin were weighted by the market share data [29] published by the US Department of Energy. Figure 5 shows the CCT occurrence frequency for all LED products in the United States (red bars) and for industrial lighting only (green bars). The figure also shows the original distribution of the collected spectral data grouped into the respective five bins (blue bars). The uniform distribution, shown using purple bars, was used in the study to give further indication of the sensitivity of the final results to the weighting. The weighted spectral mismatch errors were calculated by randomly picking DUT spectra from the five CCT bins, which were selected according to the proportions of the bins for 'All products', Industrial, and the uniform distributions. The mean absolute spectral mismatch errors were then calculated for these DUTs using the five candidate RSPDs and the spectral responsivity data of the 107 photometers.
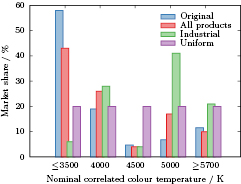
Figure 5. Weighting distributions used in the spectral mismatch analysis: unweighted (blue), all LED products in the US (red), industrial lighting only (green), and the uniform distribution (purple).
Download figure:
Standard image High-resolution imageIn addition to using just one available calibration spectrum at a time, the analysis was repeated by allowing the combinations of two and three calibration spectra to be used for calibration of each photometer. When calculating the spectral mismatch correction for a DUT, the calibration spectrum was chosen based on the closeness of its CCT to the one of the DUT. In practical measurements, the operator would need to estimate the CCT of light being measured in order to select the calibration factor for the instrument.
Besides using the spectral responsivity data of the 107 photometers and the spectral data of individual DUTs, an alternative approach was also employed. In this approach, spectral mismatch index M was calculated for every combination of the five candidate reference spectra and all the eight RSPDs shown in figure 4. The spectral mismatch index was calculated using the equation
where  and
and  are the indices of the candidate spectra and all the RSPDs, respectively. Qualitatively, this resembles having one representative spectrum as the calibration source and another one as the DUT. For comparison, the spectral mismatch index was also calculated for Standard Illuminant A against the eight representative distributions. In this approach each CCT category was weighted equally.
To study the effect of using LED-calibrated photometers in measurements of light sources other than LEDs, the analysis of spectral mismatch errors was repeated using the CIE Technical Report No. 15: colorimetry [19] illuminants as DUTs. These illuminants include spectral data for daylight (Standard Illuminant D65 and illuminants C, D50, D55, D75), incandescent (Standard Illuminant A), fluorescent (illuminants FL1–12), and high-pressure discharge (illuminants HP1–5) sources.
3. Results
3.1. Single calibration spectrum
Figure 6 shows the mean absolute spectral mismatch errors for the five candidate RSPDs. By weighting the CCT bins of the DUT data by the 'All products' distribution, shown in figure 5, the BL40 calibration spectrum resulted in the smallest mean absolute spectral mismatch error of 0.30 (red bars). This distribution of 'All products' should be considered the most significant one. Calibrating the photometers using the BL40 spectrum would also, on average, produce the smallest absolute spectral mismatch error (0.28
 ) if the CCTs of the DUTs were uniformly distributed (purple bars).

Figure 6. Mean absolute spectral mismatch errors produced by the five LED-based calibration spectra and Standard Illuminant A (Ill.A) for the relative spectral responsivities of the 107 photometers and the 1507 LED spectra weighted using the four distributions of figure 5.
Download figure:
Standard image High-resolution imageThe BL30 RSPD produced the smallest mean absolute spectral mismatch error of 0.27 when no weighting was used (blue bars in figure 6). This is due to the dominance of low CCT spectra in the measured LED products as seen in figure 5. Out of the five candidate RSPDs, the BL40 spectrum also produced the smallest maximum absolute error of 6.33
 . The maximum absolute errors for the other candidate RSPDs ranged from 7.03
 to 7.71
 .
.
Because high CCT values are preferred in industrial lighting, calibration spectra with higher CCTs yielded lower spectral mismatch errors in these applications. The BL50 calibration spectrum resulted in the smallest mean absolute spectral mismatch error of 0.25 when Industrial CCT distribution was used (green bars in figure 6).
Apart from one, all the candidate RSPDs and weighting distribution combinations produced smaller spectral mismatch than Standard Illuminant A. Depending on the utilised CCT weighting distribution, the most suitable LED-based calibration spectra reduced the mismatch error by approximately a factor of two or three when compared with Standard Illuminant A.
The impact of using a similar spectral shape for the calibration source as that of the DUT can be seen from the decrease in spectral mismatch errors when using the BL30 RSPD as the calibration spectrum while measuring the 2850 K LED of figure 2. For the 107 photometers, the range of the spectral mismatch errors decreased to  ... 0.35%, despite the increased difference in CCTs between the DUT and the calibration source, compared with the case of using Standard Illuminant A as the calibration source.
Figure 7 shows the results for the alternative approach of calculating the spectral mismatch indices M using equation (5). The figure shows the indices for the five candidate reference spectra and for Standard Illuminant A. This approach supports choosing the BL40 distribution as the reference spectrum, as it presented the lowest average and maximum spectral mismatch indices, 0.13 and 0.21 respectively. Standard Illuminant A, in turn, has the average and maximum index values 0.19 and 0.29, respectively. On average, all the five candidate RSPDs produced smaller spectral mismatch indices than Standard Illuminant A. The results of this approach are in line with those obtained by calculating spectral mismatch errors using equation (1) and uniform weighting distribution shown in figure 5.
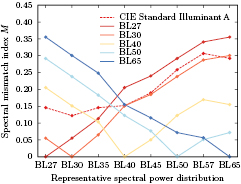
Figure 7. Spectral mismatch index M calculated for Standard Illuminant A and the five candidate representative spectral power distributions.
Download figure:
Standard image High-resolution image3.2. Multiple calibration spectra
Figure 8 shows the mean absolute spectral mismatch errors when all the combinations of two RSPDs were used as the calibration sources. The combination BL30/BL40 produced the best result (0.19 ) when the DUT data was weighted by the 'All products' distribution, although three other combinations of calibration spectra performed almost similarly. For the unweighted data, the smallest spectral mismatch error of 0.18
 was also given by the calibration spectra combination BL30/BL40. For the Industrial distribution, the smallest spectral mismatch error of 0.20
 was achieved by using the combination of BL40/BL50 calibration spectra. The combination of BL30/BL50 calibration spectra produced the smallest error of 0.22
 for the uniformly distributed data.
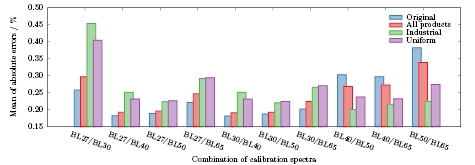
Figure 8. Mean absolute spectral mismatch errors produced by all combinations of the five LED-based calibration spectra for the relative spectral responsivities of the 107 photometers and 1507 LED spectra weighted using the four distributions of figure 5.
Download figure:
Standard image High-resolution imageIn the case of two calibration spectra, employing Standard Illuminant A as the second source would not reduce spectral mismatch errors compared with the case of having just one LED-based calibration source. The smallest mean absolute spectral mismatch errors for Standard Illuminant A as the second calibration source were 0.31 , 0.33
 , 0.26
 , and 0.28
 for 'All products', Original, Industrial and the uniform distributions, respectively. Except for Industrial distribution, for which BL50/Standard Illuminant A produced the smallest spectral mismatch errors, BL40/Standard Illuminant A was the best combination of LED/incandescent calibration spectra.
When compared with the case of using just one calibration spectrum, the decrease in spectral mismatch error is on average 0.05–0.11 percentage points depending on the weighting distribution. The decrease in the error comes at the cost of more complex measurement procedure, where the operator has to choose the correct calibration factor for the instrument during measurements. For instance, for the DUT data weighted using 'All products' distribution, if the operator chooses the incorrect calibration spectrum in more than 48 of the cases, the benefits of using two spectrally different LED calibration sources are lost. Adding a third calibration spectrum would reduce the mean absolute spectral mismatch errors by additional 0.02–0.04 percentage points but would make estimating the CCT of light being measured even more complicated for the operator.
3.3. Compatibility with other types of lighting
Figure 9 shows the comparison of the mean absolute spectral mismatch errors for the BL40 calibration spectrum and Standard Illuminant A when using the CIE colorimetric illuminants [19] as DUTs. The illuminants employed in the analysis and presented in the figure are: standard Illuminant A (Ill.A), daylight (D and C), fluorescent lamp spectra (FL), and high-pressure discharge lamp spectra (HP). Out of the five candidate LED spectra, the BL40 distribution yielded the smallest mean absolute spectral mismatch errors when measuring light represented by these illuminants.

Figure 9. Comparison of the mean absolute spectral mismatch errors for CIE colorimetric illuminants as DUTs, when using Standard Illuminant A and LED calibration spectrum BL40 in photometer luminous responsivity calibrations.
Download figure:
Standard image High-resolution image
Except for HP1, HP2, and for Standard Illuminant A itself, the LED-based BL40 calibration spectrum resulted in considerably smaller spectral mismatch errors (average MAE = 0.45 ) than Standard Illuminant A (average MAE = 0.67
 ). For HP1, the performance of the two calibration spectra is similar, making HP2 the only non-incandescent-based source for which Standard Illuminant A results in notably smaller spectral mismatch errors. The latter result can be explained by larger differences between the
  weighted spectra of HP2 and BL40 than between HP2 and Standard Illuminant A. On average, all candidate RSPDs produced smaller mean absolute spectral mismatch errors than Standard Illuminant A, average of mean absolute spectral mismatch errors ranging from 0.45
 (BL40) to 0.60
 (BL27).
4. Discussion
The new LED illuminants, once available, will allow colorimetric analysis of light and materials using LED light of different types. This is a major step considering that LED lighting has been used for years, yet colorimetric calculations have been carried out using illuminants describing other conventional types of light, such as incandescent and fluorescent light. CIE Division 2 is currently considering starting a new technical committee that will develop and publish a new LED reference spectrum, which is possibly based on BL40, to complement Standard Illuminant A in photometer luminous responsivity calibrations. It must be emphasised that the LED reference spectrum discussed in this paper is intended for photometric calibrations only, and not for calibration of spectrometers that require emission in wide wavelength range.
It is important to study the technical properties, including repeatability and long-term stability, of potential LED standard lamp technologies to prove their capability to replace incandescent standard lamps in the future. The Consultative Committee of Photometry and Radiometry (CCPR) is already investigating possible standard lamp technologies for future key comparisons of photometry, as some of the previously available incandescent standard lamp types have become increasingly difficult to acquire—even by NMIs.
Once developed, LED standard lamps could be used in luminous responsivity calibrations of illuminance meters, thus ensuring reduction of spectral mismatch errors for the majority of modern light source types. This will benefit especially those who cannot apply the spectral mismatch correction, e.g. in field measurements of mixed light of different types, such as daylight and LEDs.
As in the case of using an incandescent source with broad spectral range for luminous responsivity calibration of photometers, possible ultraviolet (UV) and infrared (IR) leakages of  filters should be characterised to avoid spectral errors in measurements of light sources whose spectral range differs from that of the calibration source. Detailed information of the LED reference spectrum in the UV and IR regions should be known to allow estimation of measurement uncertainties. This is important especially if unfiltered precision detectors, such as predictable quantum efficient detector (PQED), are used at NMIs for measuring the reference illuminance of LED standard lamps [1].
5. Conclusions
In this study, the spectral data collected for over 1500 white LED products were used to calculate eight RSPDs for DUTs sorted according to their CCTs into 2700 K, 3000 K, 3500 K, 4000 K, 4500 K, 5000 K, 5700 K, and 6500 K bins. Five of these distributions, which were submitted to CIE for consideration to be included in a revision of CIE Technical Report No. 15: colorimetry, were further analysed to find an optimal LED reference spectrum that could complement, or eventually replace, Standard Illuminant A for photometer calibrations. This was done by studying spectral mismatch errors stemming from the deviations in the calibration and LED product spectra when spectral responsivity data of different photometers were used. The simulations were run by taking into account real market share data of LED products with different CCTs. In addition to this, the influence of using multiple calibration sources was studied.
It was found that, in general, all the five candidate RSPDs yielded smaller mean absolute spectral mismatch errors than Standard Illuminant A. The LED-based calibration spectrum BL40, which was derived from the 4000 K CCT bin, produced the smallest spectral errors in measurements of LED products of different types, reducing the spectral errors on average by a factor of two when compared to using Standard Illuminant A. While additional reductions in spectral mismatch errors can be obtained by using multiple calibration spectra, in practice this improvement could be outweighed by the more complex measurement procedure, particularly in the case of three calibration spectra.
In addition, out of the five candidate LED spectra, BL40 produced the smallest mean absolute spectral mismatch errors when measuring light other than LEDs, including daylight, fluorescent and high-pressure discharge lamps of different types. In most cases, with these conventional types of light sources, the BL40 calibration spectrum led to a considerable reduction in spectral mismatch errors when compared with Standard Illuminant A.
Besides the conclusions drawn on the basis of the performed spectral mismatch analysis, there are practical aspects which advocate the selection of an LED reference spectrum for calibration use. Obsolescence of incandescent lighting may lead to a shortage of tungsten filament standard lamps used in photometry. Moreover, LED-based calibration sources will bring the benefits of prolonged operational lifetime and increased robustness for transportation when compared with incandescent calibration lamps.
Acknowledgment
The work leading to this study is partly funded by the European Metrology Programme for Innovation and Research (EMPIR) Project 15SIB07 PhotoLED 'Future Photometry Based on Solid State Lighting Products'. The EMPIR initiative is co-funded by the European Union's Horizon 2020 research and innovation programme and the EMPIR Participating States. A Kokka acknowledges the funded position of Aalto ELEC doctoral school.