Abstract
Solar filaments, hypothermia and dense structures suspended in the solar corona are formed above the magnetic polarity inversion line. Polar crown filaments (PCFs) at high-latitude regions of the Sun are of profound significance to the periodic variation of solar activities. In this paper, we statistically analyze PCFs by using full disk Hα data from 1912 to 2018, which were obtained by Kodaikanal Solar Observatory (KODA, India), National Solar Observatory (NSO, USA), Kanzelhöhe Solar Observatory (KSO, Austria), Big Bear Solar Observatory (BBSO, USA), and Huairou Solar Observing Station (HSOS, China). We first manually identify PCFs from every solar image based on the centennial data, and record the latitude and other features corresponding to the PCFs. Then we plot the PCF latitude distribution as a function of time, which clearly shows that PCFs rush to the poles at the ascending phase of each solar cycle. Our results show that the filaments drift toward mid-latitude covering solar cycle 15 to 24 after the PCFs reach the highest latitudes. The poleward migration rates of PCFs are calculated in ten solar cycles, and the range is about 0.12 degree to 0.50 degree per Carrington Rotation (CR). We also investigate the north-south (N-S) asymmetry of migration rates and the normalized N-S asymmetry index.
Export citation and abstract BibTeX RIS
1. Introduction
Filaments are hypothermia and dense structures suspended in the solar corona. They are critical in studying the spatial and temporal evolution of large-scale solar magnetic field. Polar crown filaments (PCFs) are located above the polarity inversion lines along the boundary of the polar crown cavity at high latitudes, separating the polar magnetic region from a large-scale magnetic field at middle latitudes (Martin 1973; McIntosh 1980; Leroy et al. 1983; Tang 1987; Chatterjee et al. 2017; Xu et al. 2018). Filaments are divided into unequal categories according to filament latitude characteristics (Waldmeier 1973). On one hand, low-latitude filaments (latitude smaller than 40 degrees) are concentrated into the sunspot zone, and they migrate toward the equator parallel with the sunspot zone. On the other hand, high-latitude (latitude larger than 40 degrees) independently drift to the polar region at the high latitude zone, which shows the different solar activity (Waldmeier 1973; Hansen & Hansen 1975a,b). Solar filaments have similar periodic variation to sunspots concerning the timelatitude distribution (Maunder 1913, 1922). The low-latitude and mid-latitude filaments drift toward the equator, and inversely the high-latitude filaments drift toward polar regions of the Sun (Leroy et al. 1983; Li et al. 2001). PCFs are specific tracers of the evolutionary pattern of the magnetic flux that have relation to the disappearance and reformation of polar coronal holes (Webb et al. 1984). They are necessary to be served as one representative proxy (McIntosh 1972) to understand the evolution of the solar activity of polar regions.
Periodic migration and qualitative analysis of filaments have been reported in many previous studies (Riccò 1892; Hansen & Hansen 1975a,b; Leroy et al. 1983; Gopalswamy et al. 2018). Shimojo et al. (2006) analyzed the relationship between prominence activities and solar cycles, and found that high-latitude prominence drift toward the polar regions during the ascending period of solar cycle 23. Moreover, Shimojo et al. (2006) presented that the prominence drifts toward the equator after the polarity reversal of polar regions, which was once reported by Topka et al. (1982) and Altrock (1997). Gao et al. (2012) showed that poleward migration of latitude range from 50 to 70 degrees, in latitude by analyzing the latitude variation of solar filaments around the whole solar disk by using the Carte Synoptique catalogue solar filaments from 1919 to 1957. Hao et al. (2015) used automatic detection filaments data obtained by Big Bear Solar Observatory (BBSO) from 1988 to 2013, and demonstrated a signature of polarward migration, as noted in Cycle 23. Chatterjee et al. (2017) studied the solar activity variation for nine solar cycles by using the Hα filaments dataset taken by Kodaikanal Solar Observatory (KODA, India). They found an intimate relationship between the disappearance of PCFs and the evolution of the polar magnetic field. The migration speeds of PCFs migrate to the polar regions around 0.4 to 0.6 degrees per Carrington Rotation (CR) during the solar cycle 21 to 24 were calculated by Xu et al. (2018). Xu et al. (2021) also compared the variation of migration speeds as a function of time with sunspot numbers, magnetic reversal time, and latitude gradient of differential rotation in the northern and southern hemispheres. Makarov & Sivaraman (1983) used Kodaikanal Ca IIK and Hα data recorded on plates to study the poleward migration of magnetic neutral lines. Solar filaments of different latitudes distributed on the whole solar disk can be recognized by visually and outline the boundary of opposite polarity magnetic fields (Chatterjee et al. 2017; McIntosh 1972). The statistics of PCFs provide valuable insight into the characteristics of the polar magnetic fields and solar activity (Tlatova et al. 2020), and the characteristics were not described accurately and adequately in previous studies. There is also need to advance the extensive research about PCFs over a more extended period.
In the first paper in this series, Lin et al. (2020) constructed a centennial Hα dataset (1912-2018) that collected the original Hα data from five observatories around the world, in order to more comprehensively understand filaments, especially in relation to solar activities of multiple solar cycles. In this paper, the dataset is applied to study the properties of PCFs covering data from 1912 to 2018. PCFs can be identified visually as dark bars on the solar disk. We investigate the poleward migration of PCFs by visual identification and the statistical analysis of PCFs in the past ten solar cycles. In Section 2, we present the description and reduction of data utilized in this paper. In Section 3, we show the resulting poleward migration and periodic evolution of PCFs. Furthermore, we calculate the poleward migration rate and analyze the asymmetry of the PCF migration rates in the northern and southern hemispheres. Finally, the conclusion is described in Section 4.
2. Data Description
The observations of filaments analyzed in this study were derived from a new comprehensive dataset of solar filaments of one-hundred-year intervals (Lin et al. 2020). The dataset involve Hα full-disk data from five observatories, mainly obtained by Kodaikanal Solar Observatory of India (KODA, India), Kanzelhöhe Solar Observatory of Austria (KSO, Austria), Big Bear Solar Observatory (BBSO, USA), and Huairou Solar Observing Station (HSOS, China) from 1912 January to 2018 March. The centennial dataset of solar filaments can be downloaded via http://sun.bao.ac.cn/solarfilament/. Furthermore, we use a solar filament database management platform named the database management system of hundred years of solar filament archives (http://faste.ctgu.edu.cn) (Tao et al. 2021). For this data archive, we can quickly get the physical parameters of PCFs and Hα full-disk solar images. The data includes various characteristic parameters, such as centroid longitude and latitude, perimeter, area, length, and tilt angle in the standard JavaScript Object Notation (JSON). Here we give examples of solar images in Figure 1. PCFs are displayed in the rectangular box. Zhu et al. (2019) accurately recognized solar filaments and calculated the centroid latitude based on deep learning. At the same time, the automatic detection methods of filaments have been reducing the work time in recent years. This method possibly causes some uncertainties to consequence in the identification of PCF. For instance, it may be false identification and deems long segmented filaments as multiple independent individuals (Xu et al. 2018). Therefore, visual detection constitutes higher accuracy, particularly for segmented polar filaments. PCFs are explicitly identified by visual detection on the solar images. The identification criteria are as follows.
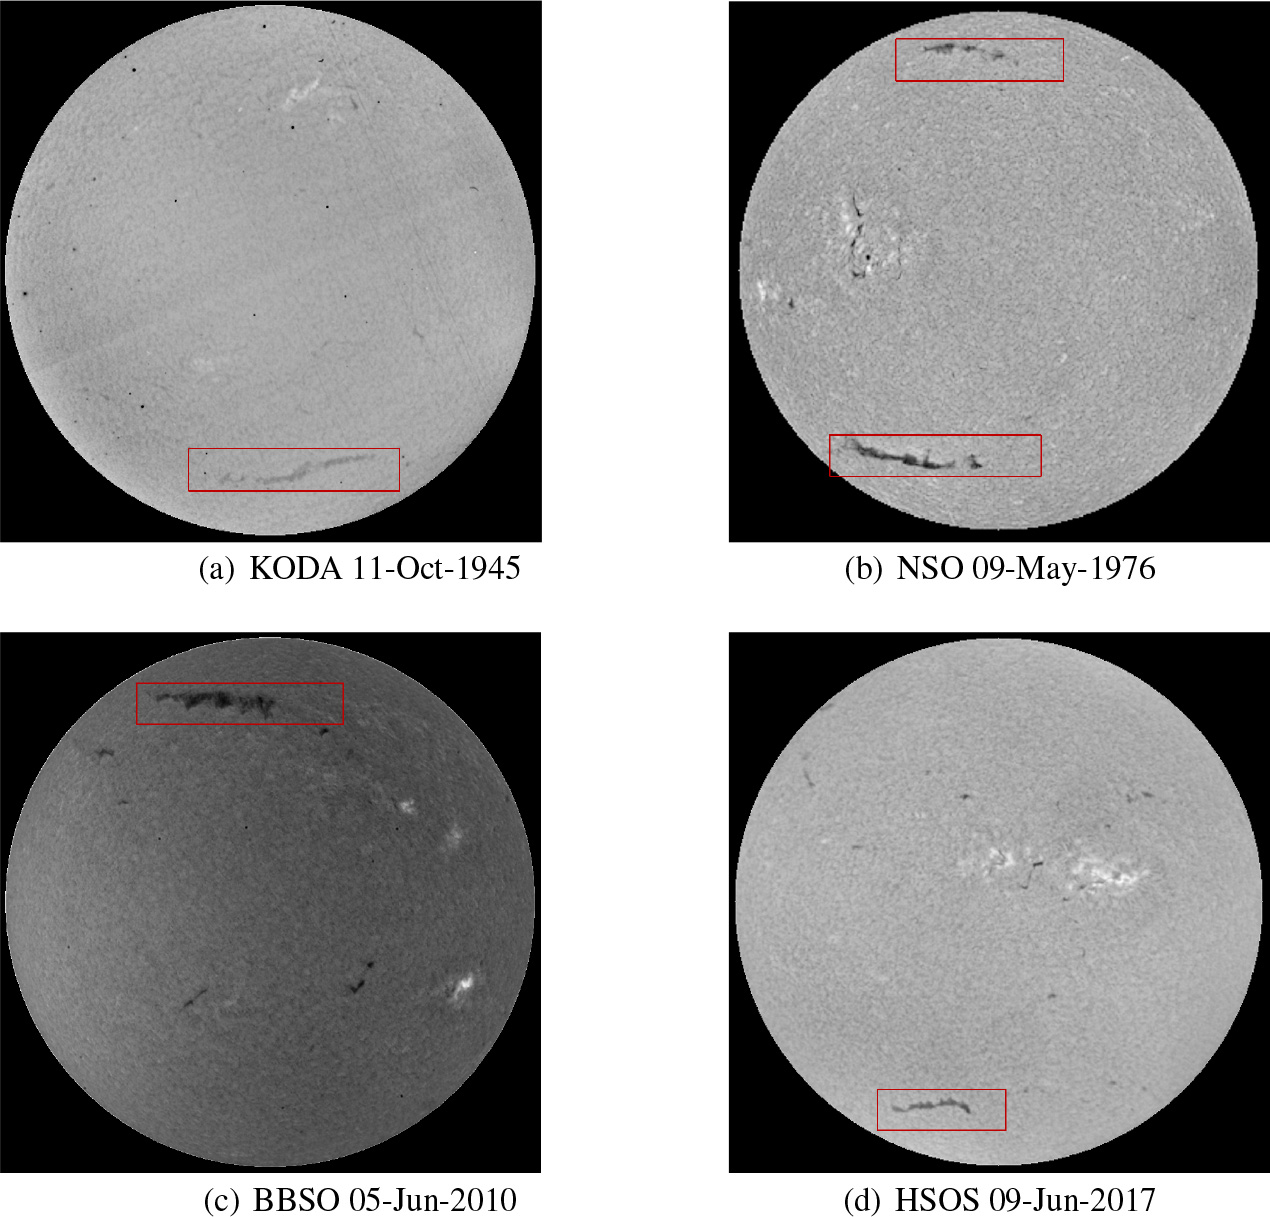
Fig. 1 Hα images of the Sun from KODA, NSO, BBSO, and HSOS.
Download figure:
Standard image1. Filaments above 40 degrees are taken into account (Babcock & Babcock 1955).
2. Tilt angle of PCFs is found to be near zero or negative (Tlatov et al. 2016), consistent with the nearhorizontal polarity inversion line (PIL) illustrated by Leroy et al. (1983).
3. Filaments anchored on active regions or apparently among two plage regions are excluded (Xu et al. 2018).
4. Especially for segmented and weak filaments, we monitor them to have an identification for several days.
According to the above four criteria, we acquire precise reduction data of PCFs by visual inspection of solar images. This process consumes plenty of time but provides more reliable and long-term identification data of PCFs, especially for weak, segmented, and false detection from automatic detection methods.
3. Analysis and Results
Based on the comprehensive dataset, this paper utilizes the visual detection method to identify PCFs from Hα solar images. Figure 2 shows the PCFs latitudes as a function of time (in the unit of CR) over ten solar cycles. The plot also illustrates the poleward migration begin from solar minimum to solar maximum, highlighted by the red lines. According to sunspot index, we can get the solar maximum, solar minimum, and different cycles through this website http://sidc.be/silso/cyclesmm (Sunspots Index and Longterm Solar Observations). As can be seen, explicitly periodic migration of PCFs are noticed in each solar cycle, which is consistent with the previous study (Xu et al. 2018; Gopalswamy et al. 2018). Besides, the periodic cyclic pattern of poleward migration by using the manual identification is more outstanding than the result of the automatic detection methods in the past ten cycles (Hao et al. 2015). Corresponding to each solar cycle in the northern and southern hemispheres, we can explicitly observe the migration of "rush to the poles". Furthermore, from Figure 2, there are also PCFs migrating towards the mid-latitude from the solar maximum to the years before the solar minimum, which was reported by Altrock (1997), and seemingly even clear in panel (b).

Fig. 2 Time-latitude distribution of PCFs. The green triangles and solid blue dots indicate the latitude distribution of PCFs. Cycle numbers are printed in black with blue solid vertical lines marking the beginning of solar cycles. The results of the polynomial fitting are shown as the red lines. Black dashed lines are drawn at the latitude of 40 degrees. (a) Temporal variation (1964–2018) of PCFs latitudes, covering solar cycles from 20 to 24. (b) Temporal variation (1912–1963) of PCFs latitudes, covering solar cycles from 15 to 19.
Download figure:
Standard imageWe use the first degree polynomial function to fit the latitude of PCFs and get the poleward migration speeds. We divide the migration into two stages, namely, poleward migration and drift toward mid-latitude. Table 1 lists the migration rates at the ascending phases of solar cycles, which are indicated in the slope of red trend lines in Figure 2. Corresponding to the descending phases of solar cycles, the migration rates are listed in Table 2. One such example is cycle 22 in Table 1, 0.48 degrees per CR of poleward migration in the northern hemisphere, almost 6.24 degrees for one year, and 18.72 degrees for the entire period of poleward migration in three years. Similarly, in the southern one, 0.50 degrees per CR of poleward migration, almost 6.5 degrees for one year, and 19.5 degrees for the entire period of poleward migration. It means that the southward migration rate is faster than the northward migration rates in cycle 22. Table 2 indicates that drift toward mid-latitude rates in the descending phase of solar cycle 22. There are 0.24 degrees per CR in the northern hemisphere and 0.14 degrees per CR in the southern hemisphere. The migration rates with relatively high rates in the rising phase compare to that in the descending phase of solar cycle 22. We also use the quadratic polynomial function to fit the latitude of PCFs poleward migration, demonstrated in Figure 3, The result shows that the two stages of the initial slow migration and the following fast migration do not exist in all solar cycles. For example, it is not obvious that there are two stages of the PCF migration in the southern hemisphere of solar cycle 24 in Figure 3.
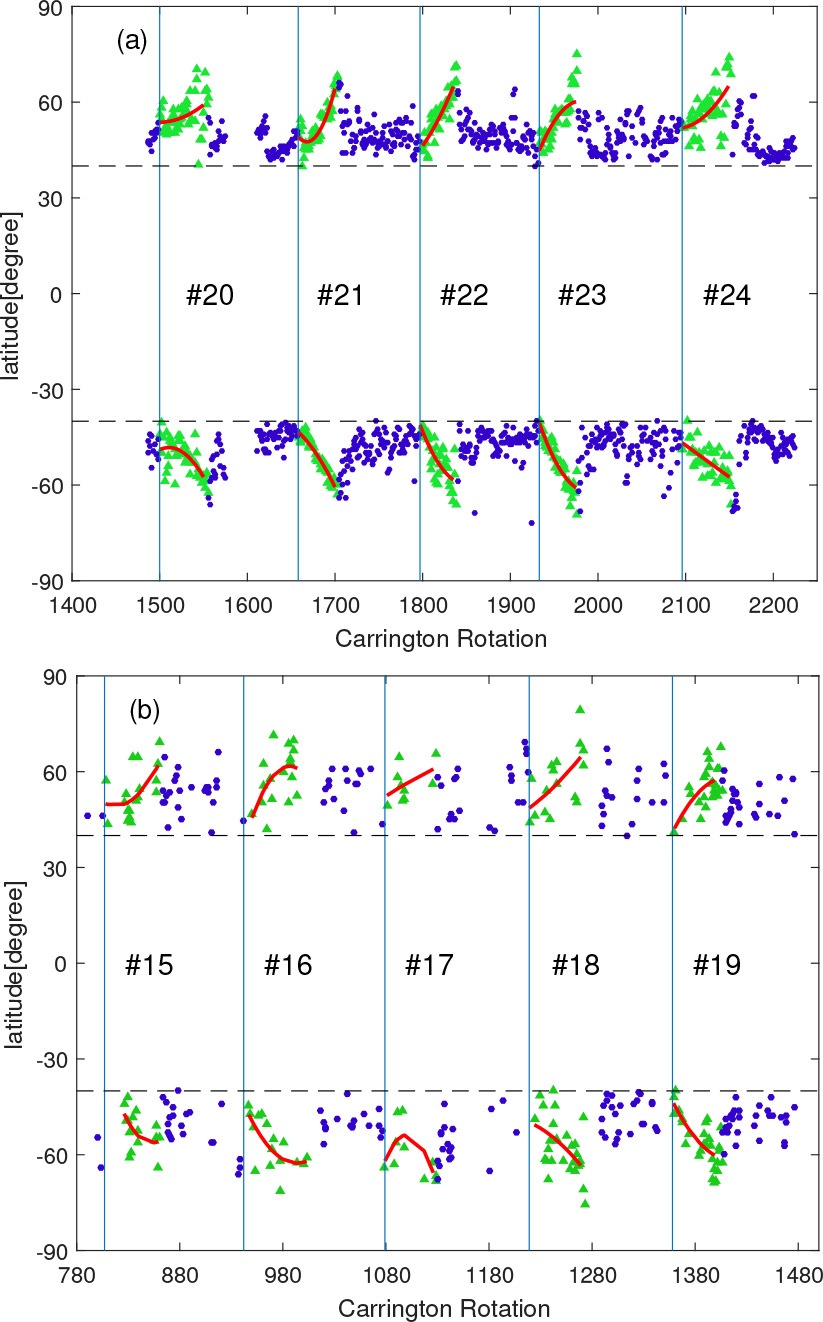
Fig. 3 Similar to Fig. 2, but for the poleward migration of PCFs fit by quadratic polynomial.
Download figure:
Standard imageTable 1. Migration Rates of PCFs Covering Solar Cycles from 15 to 24
| Cycle15 | Cycle16 | Cycle17 | Cycle18 | Cycle19 | Cycle20 | Cycle21 | Cycle22 | Cycle23 | Cycle24 | |
|---|---|---|---|---|---|---|---|---|---|---|
| deg/CR | deg/CR | deg/CR | deg/CR | deg/CR | deg/CR | deg/CR | deg/CR | deg/CR | deg/CR | |
| North Poleward | 0.28±0.23 | 0.39±0.18 | 0.12±0.24 | 0.31±0.27 | 0.31±0.19 | 0.12±0.09 | 0.40±0.09 | 0.48±0.10 | 0.32±0.10 | 0.25±0.10 |
| South Poleward | 0.23±0.25 | 0.28±0.20 | 0.22±0.19 | 0.30±0.21 | 0.37±0.13 | 0.20±0.09 | 0.48±0.09 | 0.50±0.12 | 0.44±0.08 | 0.19±0.08 |
| N-S Average | 0.26 | 0.34 | 0.17 | 0.31 | 0.34 | 0.16 | 0.44 | 0.49 | 0.38 | 0.22 |
| N-S Difference | 0.05 | 0.11 | –0.10 | 0.01 | –0.06 | –0.08 | –0.08 | –0.02 | –0.08 | 0.06 |
| N-S Normalized Difference | 0.09 | 0.16 | –0.29 | 0.01 | –0.08 | –0.25 | –0.09 | –0.02 | –0.15 | 0.13 |
Table 2. Migration Rates of PCFs (Drift toward Mid-latitude) Covering Solar Cycles from 15 to 24
| Cycle15 | Cycle16 | Cycle17 | Cycle18 | Cycle19 | Cycle20 | Cycle21 | Cycle22 | Cycle23 | Cycle24 | |
|---|---|---|---|---|---|---|---|---|---|---|
| deg/CR | deg/CR | deg/CR | deg/CR | deg/CR | deg/CR | deg/CR | deg/CR | deg/CR | deg/CR | |
| North | 0.05±0.15 | 0.20±0.17 | 0.24±0.26 | 0.35±0.39 | 0.15±0.15 | 0.33±0.11 | 0.20±0.08 | 0.24±0.08 | 0.14±0.09 | 0.33±0.10 |
| South | 0.22±0.28 | 0.24±0.16 | 0.12±0.22 | 0.34±0.24 | 0.15±0.10 | 0.37±0.13 | 0.23±0.06 | 0.14±0.09 | 0.24±0.09 | 0.37±0.13 |
| N-S Average | 0.14 | 0.22 | 0.18 | 0.35 | 0.35 | 0.15 | 0.22 | 0.19 | 0.19 | 0.35 |
| N-S Difference | –0.17 | –0.04 | 0.12 | 0.01 | 0.00 | –0.04 | –0.03 | 0.10 | –0.10 | –0.04 |
| N-S Normalized Difference | –0.62 | –0.09 | 0.33 | 0.01 | 0.00 | –0.05 | –0.06 | 0.26 | –0.26 | –0.05 |
Migration rates in Carrington Rotation are used as a unit. The migration rates are derived by fitting the PCF positions as a function of time.
Figure 4 and Figure 5 show the temporal evolution of migration speeds in northern and southern hemispheres in the rising and descending phases of the solar cycle, respectively, spanning solar cycles 15 to 24. We calculate the N-S difference and normalized difference of the migration speeds of PCFs. Plots in Figure 4 and Figure 5 are based on the results listed in Table 1 and Table 2.
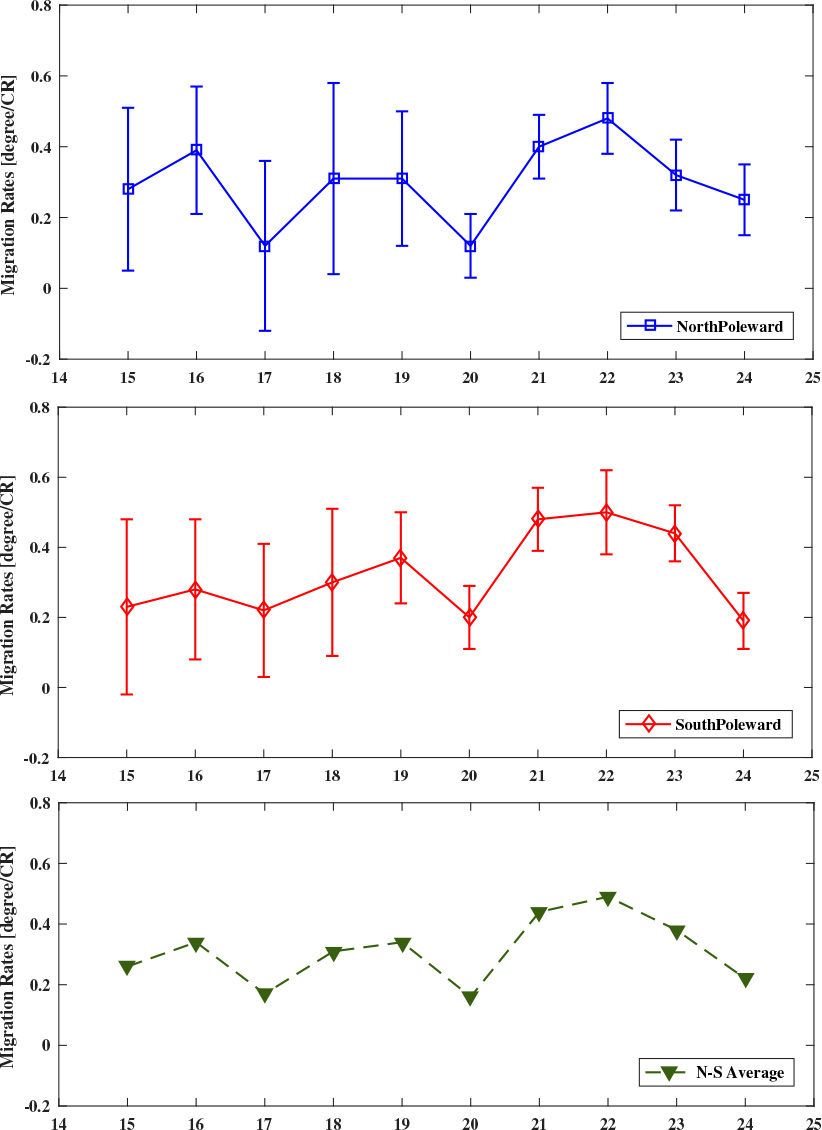
Fig. 4 Variation of polar migration rates with error bars (the unit is degree/CR) of PCFs in ten solar cycles. The upper, middle and lower panels indicate the migration rates of the northern and southern hemispheres, and the average migration rate, respectively.
Download figure:
Standard image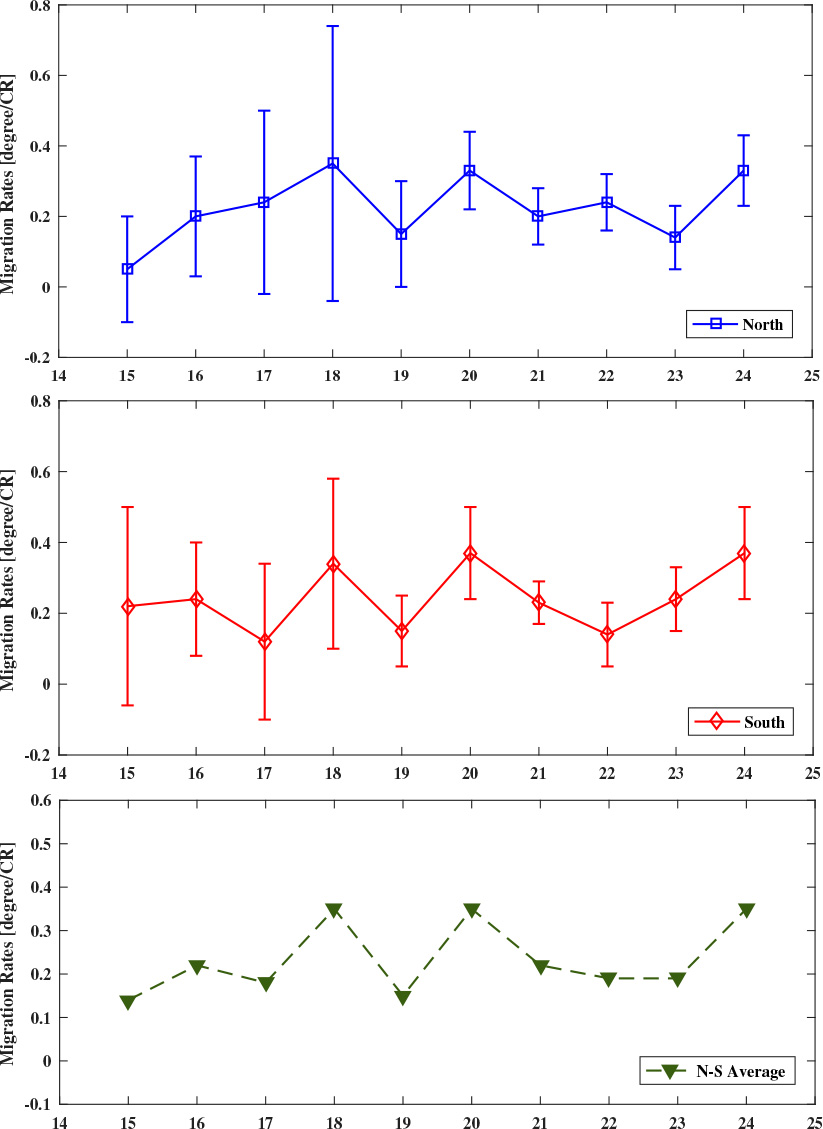
Fig. 5 Similar to Fig. 4, but for the variation of migration rates that PCFs drift toward mid-latitude from the north and south poles in ten solar cycles.
Download figure:
Standard imageFigure 6 plots the N-S difference and N-S normalized difference in migration speeds based on Table 1 and Table 2 respectively. The N-S normalized difference of filament migration has been calculated by the formulas  , in which AN
is the normalized N-S asymmetry index, N is the migration rates of PCFs in the northern hemisphere, and S is the migration rates of PCFs in the southern hemisphere. If AN
>0, it means that the northern hemisphere is the dominant hemisphere. In contrast, dominance is the southern hemisphere. The analysis of N-S asymmetry plays an essential role in investigating the correlation with between polar magnetic field and the drift activity of the PCFs.
, in which AN
is the normalized N-S asymmetry index, N is the migration rates of PCFs in the northern hemisphere, and S is the migration rates of PCFs in the southern hemisphere. If AN
>0, it means that the northern hemisphere is the dominant hemisphere. In contrast, dominance is the southern hemisphere. The analysis of N-S asymmetry plays an essential role in investigating the correlation with between polar magnetic field and the drift activity of the PCFs.

Fig. 6 The N-S asymmetry of migration rates of PCFs covering ten solar cycles. Panel (a) shows the northern and southern hemisphere difference and normalized asymmetry of poleward migration rates. Panel (b) indicates the northern and southern hemisphere difference and normalized asymmetry of migration rates PCFs drift toward mid-latitude.
Download figure:
Standard imageThe normalized asymmetry index and N-S difference of migration speed indicate that the southern hemisphere is the dominant in solar cycles 17, 20 and 23 from Figure 6(a). Figure 6(b) show the N-S asymmetric migrations at the descending phases of the ten cycles. The N-S difference in cycles 15, 17, 22 and 23 is larger than other cycles. As we see in Figure 6, the N-S asymmetry indices vary over time, but they are not dependent on solar cycles.
4. Conclusions
In this paper, PCFs are derived from a comprehensive dataset from 1912 to 2018 by the manual identification, covering solar cycles from 15 to 24. We plot the time-latitude distribution, and give poleward migration and drift toward mid-latitude of PCFs for consecutive ten solar cycles. We calculate the migration rates according to the trend of PCFs. Furthermore, the data refined by the artificial detection make the results more credible. In addition, the asymmetry of the northern and southern hemispheres is analyzed on migration speed. The main conclusions of this paper are summarized as follows:
- Table 1 presents the latitude migration degree of PCFs per CR. The average range of the poleward migration rates is about 0.12 to 0.50 degrees per CR. The migration speeds of drift toward mid-latitude is about 0.05 to 0.37 degrees per CR. In this paper, the calculation of migration speeds mainly focuses on the average speed of the whole migration process, which is the average value fitted by migration trend.
- As for the temporal evolution, there is a clear signature of the poleward migration of PCFs. PCFs almost reach the highest latitude until the following sunspot maximum. The latitude distribution of the 15th to 24th solar cycles shows the migration toward mid-latitude of PCFs in the descending phase of each solar cycle.
- The migration of northern PCFs significantly differs from that of the southern PCFs. The N-S asymmetry of the migrate speeds of PCFs is not dependent on the solar cycle.
The poleward migration of PCFs is clearly presented in every solar cycle. In the 15th to 24th solar cycles, we can see the migration trend of the southern and northern hemispheres drift toward the mid-latitudes, which was consistent with Gao et al. (2008), Li et al. (2008) and Hao et al. (2015). Altrock (2014) described the latitude change of the high-latitude filaments in the northern hemisphere in 2009 is about 4.6 degrees (about 0.35 degrees per CR) and the annual latitude change is about 7.5 degrees (about 0.57 degrees per CR) in 2010. Hao et al. (2015) show that the migration rates range from 0.695 to 1.992 m s−1 (about 0.13 to 0.38 degrees per CR), which are similar to the results in this paper. The PCF migration rates calculated by Xu et al. (2021) range from 0.12 degrees to 0.88 degrees. There are some differences between the average migration speeds in our paper and that in Xu et al. (2021). It may be caused by the different filament datasets and different statistical methods. The author analyzed PCFs by using the polarmost filaments whose latitude is the highest of all of the PCFs found before, for a given PCF. However, we study the PCFs by measuring the average migration of PCFs (Li et al. 2008; Kong et al. 2014). Hyder (1965) showed a change of polarity of the polar magnetic field along with a large number of filaments reach the highest latitudes (Xu et al. 2018). As a follow up work, the statistical analysis of the long term PCF variation provides essential clues to advance our understanding of solar cycles and solar dynamo.
Acknowledgements
We would like to thank all of the observers and the contributions of the team to build the database over the last hundred years. The data is available for the public via http://sun.bao.ac.cn/solarfilament/. We also thank the referee for the the constructive suggestions that improved this paper. The National Natural Science Foundation of China supports this work under Grant numbers U2031202, U1531247 and U1731124, the 13th Five-year Informatization Plan of Chinese Academy of Sciences under Grant number XXH13505-04, the special foundation work of the Ministry of Science and Technology of China under Grant number 2014FY120300.