Abstract
PMN J0218–2307 (4FGL J0218.9–2305) is classified as a blazar candidate with unknown type (BCU) in the fourth source catalog from the Fermi Large Area Telescope (Fermi-LAT). With the updated Fermi-LAT Pass 8 data, the γ-ray flaring activity toward PMN J0218–2307 is detected. The test statistic (TS) value of PMN J0218–2307 in energy band of 100 MeV–500 GeV is 133.893 with a significance level of 10.96σ. The maximum-likelihood photon flux is (8.131 ± 1.359) × 10−9 ph cm−2 s−1. A significant γ-ray flare in the period from 2008 August 4 to 2019 August 25 is found from the source. The spectral characteristics of GeV energy band of PMN J0218–2307 is similar to that of flat-spectrum radio quasars (FSRQs) in the local Universe.
Export citation and abstract BibTeX RIS
1. Introduction
Blazars, as a hot topic, are the most energetic subclass of active galactic nuclei (AGNs). Blazars are defined by flat radio spectra with large amplitude and rapid variability of non-thermal emission across the electromagnetic spectrum (Urry & Padovani 1995). Most blazars have Dopplerboosted relativistic jets that point toward the line of sight from observers (Blandford & Rees 1978; Urry & Padovani 1995).
Blazars are radio-loud AGNs, and their jets lead to high-energy emission from radio to γ-ray energy band for the Doppler beaming effect (Urry & Padovani 1995). The multi-band spectral energy distributions (SEDs) from blazars usually have two broad bumps. The first bump from the infrared to X-ray band is believed to be from the synchrotron emission of non-thermal electrons, and the second bump from X-ray to γ-ray band is considered to be from the inverse Compton Scattering (ICS) process. The seed photons of the ICS process can come from a dusty torus, broad line region (BLR) or low-energy synchrotron emission (e.g., Konigl 1981; Band & Grindlay 1985; Maraschi et al. 1992; Błażejowski et al. 2000).
Blazars are divided into two subclasses including flat-spectrum radio quasars (FSRQs) and BL Lac objects (BL Lacs) according to their optical spectra. FSRQs have broad and strong emission lines, while BL Lacs have weak or even no emission lines with equivalent widths < 5 Å from Stickel et al. (1991). It is widely recognized that strong radio sources associated with AGNs are likely powered by collimated relativistic energy flows (Rees 1966). Moreover, flat-spectrum radio sources are likely to be the main sources of blazars (Healey et al. 2007). Related researches have demonstrated that flat-spectrum radio sources strongly correlate with high-energy sources in the > 100 MeV sky (Mattox et al. 2001; Hartman et al. 1999; Sowards-Emmerd et al. 2005). For example, in the Fermi first-year AGN catalog that includes 796 sources with each source associated with a single counterpart, there are 314 BL Lacs and 285 FSRQs, which were classified according to their optical spectra (Abdo et al. 2010b).
The explorations about blazars can constrain the baryon density ΩB and the cosmological constant (Varshalovich et al. 2012). These researches also can provide some important clues about structure and evolution of galaxies and the whole Universe (Hopkins et al. 2006), so it is of great significance to explore the high-energy radiation characteristics and flare events from the flatspectrum radio sources, as a kind of common AGN candidate (e.g., Healey et al. 2007).
PMN J0218–2307 was initially mentioned by Griffith et al. (1994), who presented a catalog of radio sources discovered at a frequency of 4850 MHz from the Parkes-MIT-NRAO (PMN) Surveys. So far, four radio catalogs provide six data points for PMN J0218–2307 (Griffith et al. 1994; Condon et al. 1998; Healey et al. 2007; Murphy et al. 2010). The CRATES flat-spectrum radio source catalog provided the flux density of 23.1 mJy at 8.4 GHz for its likely counterpart CRATES J0218-2307 (Healey et al. 2007), and its type is marked as a flat-spectrum radio source in the NASA/IPAC Extragalactic Database 1 . However, there is no optical or X-ray band information including redshift in current research. We preliminarily analyzed the γ-ray radiation of the source by using approximately 11 years of Fermi-Large Area Telescope (LAT) Pass 8 data and found a significant and isolated flare from a light curve with 90 day bins. Motivated by the variability of the light curve with a timescale of 90 days from PMN J0218–2307, we carried out further research on γ-ray radiation of the source.
The paper contains the following sections: we describe the data preparation and related results about the GeV emission in Section 2, and the discussion and conclusion for the work are provided in Section 3.
2. Data preparation
We collected the Pass 8 Fermi-LAT data recorded from 2008 August 4 to 2019 August 25 and filtered the data with "Source" event class (evclass = 128 & evtype=3). The data with the energy band from 100 MeV to 500 GeV were selected, and the events with zenith angles > 90° were excluded to reduce contamination from Earth's limb. The region of interest (ROI) is a square area of 20° × 20° centered at the position of PMN J0218–2307 from SIMBAD 2 (R.A., Decl. = 34.668°, –23.120°). We adopted the Fermi-LAT Science Tools, v11r5p3 3 to perform the analysis. Also, the binned likelihood analysis method and the instrument response function (IRF) "P8R3_SOURCE_V2" were selected to fit the data 4 . Sources within ROI in the Fermi Large Area Telescope Fourth Source Catalog (4FGL; Abdollahi et al. 2020) were included in the model file. For the Galactic and isotropic backgrounds, we selected gll_iem_v07.fits and iso_P8R3_SOURCE_V2_v1.txt 5 , and we kept their normalizations as free parameters in the fitting process. Within a 5° region centered at the ROI, the normalizations and the spectral parameters of all sources were set as free. For the sources from 5° to 10° in the model file, we only set their normalizations as free. For other sources, we chose to fix all parameters.
2.1. Results
The test statistic (TS) map of the 5° × 5° region centered at PMN J0218–2307 by running gttsmap was generated, and a significant γ-ray source is found toward PMN J0218–2307 from 400 MeV to 500 GeV in Figure 1. We added a point source at the position of PMN J0218–2307 in the model file to describe the γ-ray excess instead of the position of 4FGL J0218.9–2305. The best-fit position of the source was (R.A., Decl. = 34.682°, –23.111°) with the 68% (95%) error radius of 0.052° (0.084°) recalculated by using gtfindsrc. The distance between PMN J0218–2307 and the best-fit position of the γ-ray excess is only 0.016°, which makes PMN J0218–2307 within the error radius of the 68% confidence level. The spatial association implies that PMN J0218–2307 is likely to be the counterpart of the γ-ray excess. The TS value of the global fit is 111.304 with a significance level of 9.91σ. Here the TS value is defined as TS = – 2(L0 – L1), where L0 and L1 are the logarithmic maximum likelihood values of the null hypothesis and tested model including the target source, respectively (Abdollahi et al. 2020).

Fig. 1 TS map with 0.1° pixel size of 0.4–500 GeV for a 5° × 5° region centered at the SIMBAD position of PMN J0218–2307 marked by a green cross.
Download figure:
Standard image2.2. Light Curve
To analyze the variability characteristic of the γ-ray source, we first produced the light curve with 90 day bins from 2008 August 4 to 2019 August 25 by utilizing the data with energy range from 0.1 to 500 GeV as displayed in Figure 2. The light curve presents a significant γ-ray flare in the period from Modified Julian Date (MJD) 57730 to MJD 57880, which was marked by a red dashed line in Figure 2. We found that the γ-ray emission of PMN J0218–2307 is weak before the explosion as depicted in Figure 2. Then, we divided the data into two different periods before and after the explosion and separately generated their TS maps as demonstrated in Figure 3. Before the explosion, the corresponding time lasts approximately 8 yr, which ranges from MJD 54682 (2008–08–04) to MJD 57740 (2016–12–18). We did not find any significant γ-ray emission from the location of PMN J0218–2307, and its TS value of the global fit is 14.226 as featured in the left panel of Figure 3. After the explosion, a significant γ-ray emission from MJD 57740 (2016–12–18) to MJD 58720 (2019–08–25) is detected at the position of PMN J0218–2307 as shown in the right panel of Figure 3, and its TS value of the global fit is 102.711.
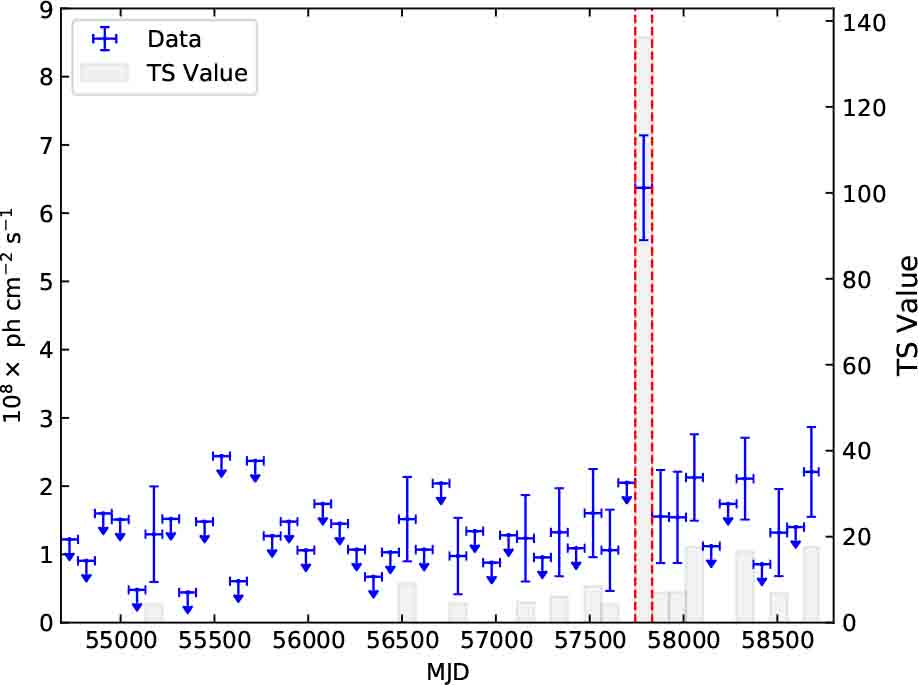
Fig. 2 Light curve of γ-ray emission toward PMN J0218–2307 between 0.1 and 500 GeV with 90 day bins. The gray shaded regions show the TS value of each time bin. For TS value less than 4, the 95% flux upper limit is calculated. The red dashed lines represent a significant flare from the light curve.
Download figure:
Standard image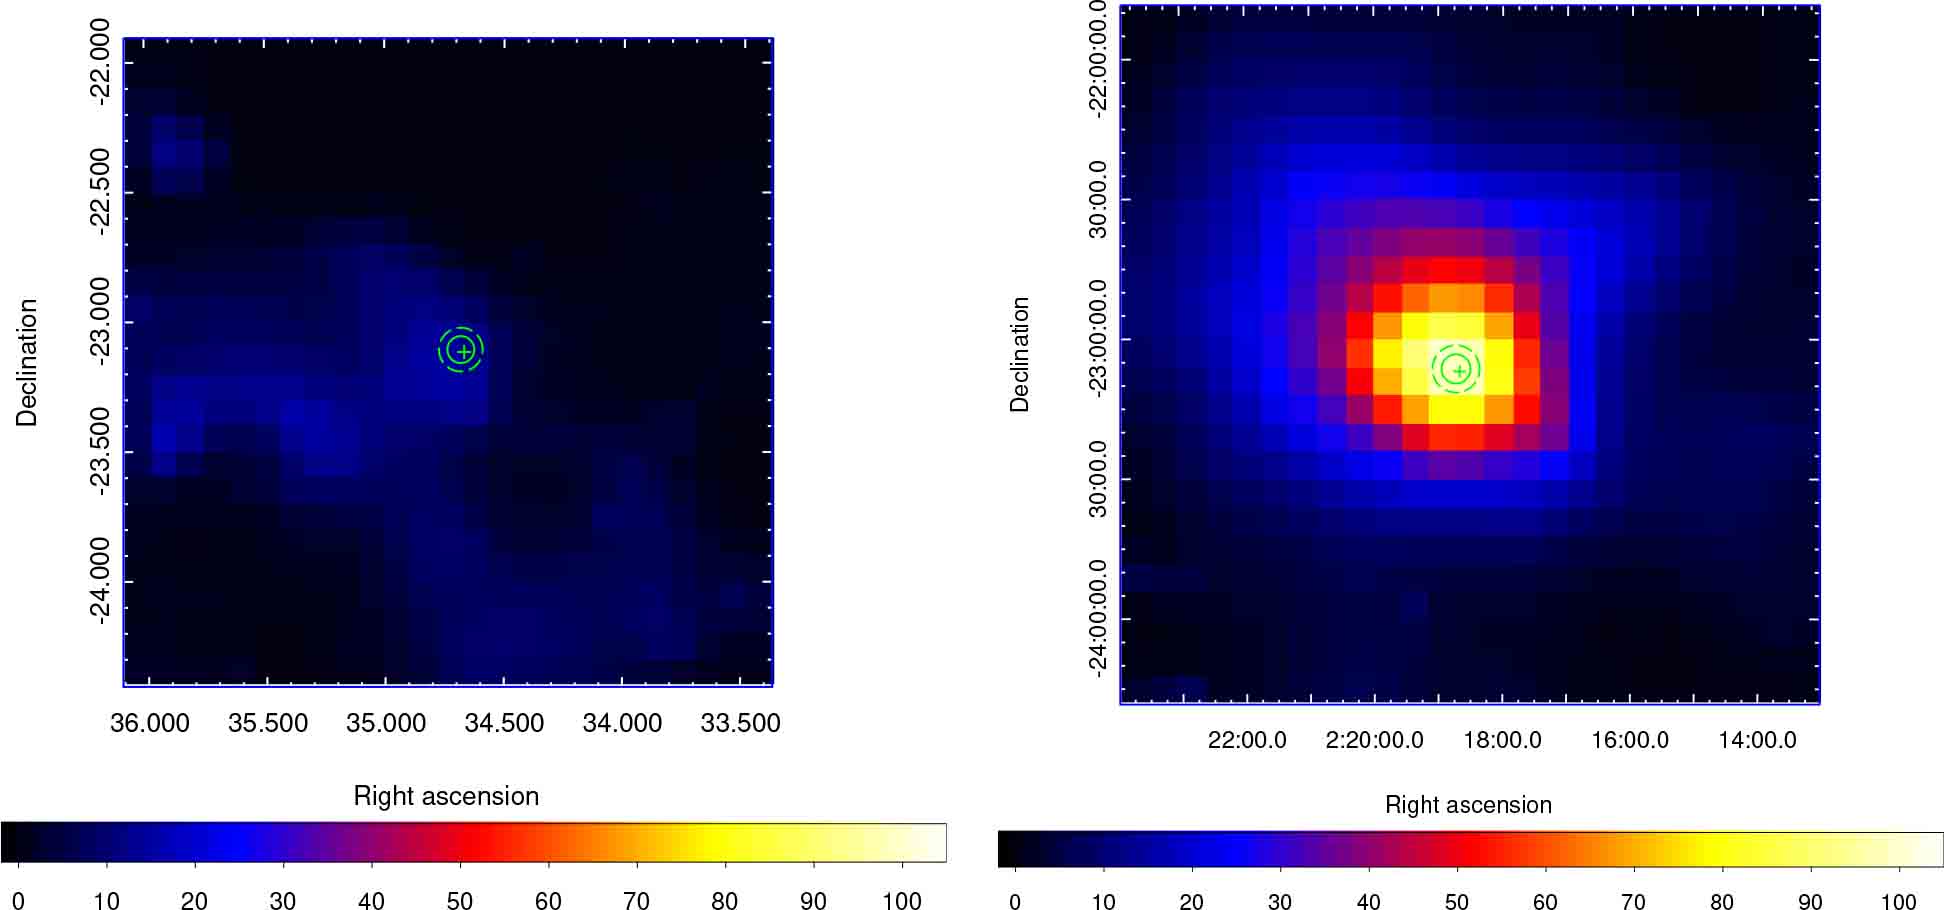
Fig. 3 TS maps with 0.1° pixel size of 0.4–500 GeV for a 2.5° × 2.5° region centered at PMN J0218–2307. The left panel displays the TS map before the explosion from 2008 to 2016. The right panel features the TS map after the explosion from 2016 to 2019. The green cross marks the SIMBAD position of PMN J0218–2307 and the green circles signify the 68% (inner) and 95% (outer) error regions of the best-fit position.
Download figure:
Standard imageTo investigate the evolution of the flare with finer time bins after the explosion, we generated the light curves covering 30 day, 15 day and 10 day bins, which range from MJD 57700 (2016–11–08) to MJD 58720 (2019–08–25). As depicted in Figure 4, we can see the three different binning cases during the period. We ascertained the flare of the period is still significant for the three binning cases. Moreover, we found a data point in the light curve with 10 day bins has a high flux and a large TS value marked with a green dashed line as displayed in the bottom panel of Figure 4, which is convincing evidence for the flare event during the period.
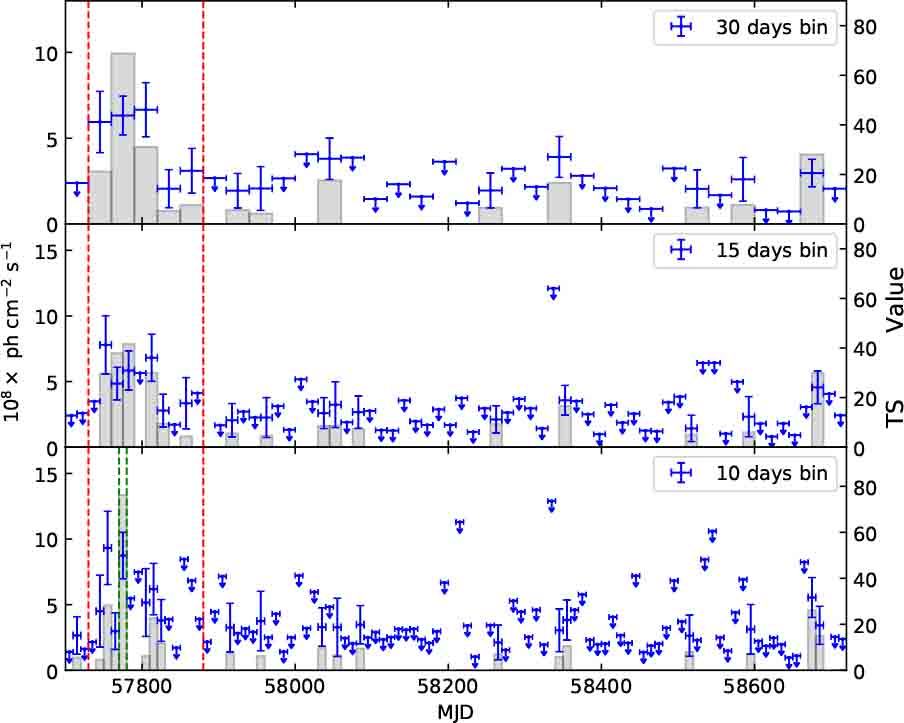
Fig. 4 Three light curves of PMN J0218–2307 from MJD 57700 to MJD 58720. The gray shaded regions show the TS values. The red dashed line represents the flare date defined by the light curve of 30 day bins. Top panel: the light curve of 30 day bins. Middle panel: that of 15 day bins. Bottom panel: that of 10 day bins.
Download figure:
Standard imageFor the light curve of 30 day bins, which has small statistical errors and high confidence level, we selected it to explore the evolution characteristic of the flare in detail. We tried to fit the peak structure in the different energy ranges as shown in Figure 5 by using the following formula (Rani et al. 2013)

where F0 is the value of the photon flux at t0, which approximately represents the amplitude of the flare, and Tf and Tr represent the decay and rise times, respectively.

Fig. 5 Light curves of PMN J0218–2307 for the data between MJD 57670 and MJD 57880 with the different energy ranges. The blue points are the data with 30 day bins. The red dashed lines indicate the flux value of the peak. The gray shaded regions show the TS values. The green solid lines represent the best-fit curve from formula (1). The black solid and dashed lines are the best-fit results and 1σ uncertainties for the data of TS value > 1 from a constant flux model, respectively.
Download figure:
Standard imageThe following parameter ξ is defined to describe the symmetry of the flare: which is in the range of –1 to 1 and indicates completely right (–1) and left (1) asymmetric flares, respectively.

The flaring time duration Tfl is defined as (Abdo et al. 2010a)

To compare the fitting result of Equation (1), we selected a constant flux model to fit the data of the flare with three different energy bands. Here we selected the data points with TS>1 to fit. For data points with TS<1, we chose to calculate their upper limits. The fitting results from them are given in Table 1, and we found that a reduced  obtained by a constant fit is higher than
  obtained by the formula (1) fit for the three light curves. The fitting result affirms that Equation (1) is more suitable to describe the flares of the three different energy bands, and t0, Tr, Td and Tfl have no statistical differences among them, which indicate that the structure of the flare is relatively stable in the three different energy bands. Also, the peak fluxes from the flare marked by the two red dashed lines in Figure 5 have a slight decrease with the decrease of the energy band.
Table 1. The Fitting Parameters of the Flare
| Energy Range | Peak Flux Density | t0 | Tr | Td | Tfl | ξ |

|

| TSpeck |
|---|---|---|---|---|---|---|---|---|---|
| 10−8ph cm−2 s−1 | d | d | d | d | |||||
| 200 MeV – 500 GeV | 2.300 ± 0.432 | 57772.972 ± 29.935 | 34.807 ± 23.829 | 29.475 ± 16.736 | 128.564 ± 58.238 | –0.083 ± 0.455 | 2.496 | 3.333 | 84.200 |
| 300 MeV – 500 GeV | 1.351 ± 0.274 | 57770.727 ± 33.657 | 35.252 ± 24.408 | 32.930 ± 20.006 | 136.364 ± 63.119 | –0.034 ± 0.463 | 0.672 | 2.933 | 76.887 |
| 400 MeV – 500 GeV | 0.975 ± 0.211 | 57771.378 ± 27.723 | 29.144 ± 20.482 | 26.481 ± 15.287 | 111.250 ± 51.116 | –0.048 ± 0.460 | 0.890 | 3.087 | 73.283 |
We calculated the variability index defined by Nolan et al. (2012) for checking the variability of photon flux from the three light curves of the different energy bands. For the light curve with seven time bins, the critical value of TSvar ≥ 16.81 is used to identify a variable source at a 99% confidence level. In the energy band of 200 MeV – 500 GeV, the variability index is TSvar = 70.48 with the corresponding significance level of 7.66σ, which implies a significant variability from the source. Furthermore, the TSvar values in the energy ranges of 300 MeV – 500 GeV and 400 MeV – 500 GeV are also high as shown in Figure 5, which indicate the flux variability of the flare is still significant in the high energy bands.
2.3. Spectral Energy Distribution
Energy Distribution The period from 57742 MJD to 58720 MJD was defined by us as the active state, and the period from 54683 MJD to 57742 MJD was defined as the quiescent state according to the light curve of 10 day bins. Later, we separately constructed the SEDs for the quiescent state and the active state to compare the variability of each energy bin from them. Here we divided the energy range of 100 MeV – 500 GeV into eight energy bins for the two periods, respectively. Each energy bin is separately fitted by following the binned likelihood analysis method, as was done in the global fit. The corresponding SEDs are displayed in Figure 6.
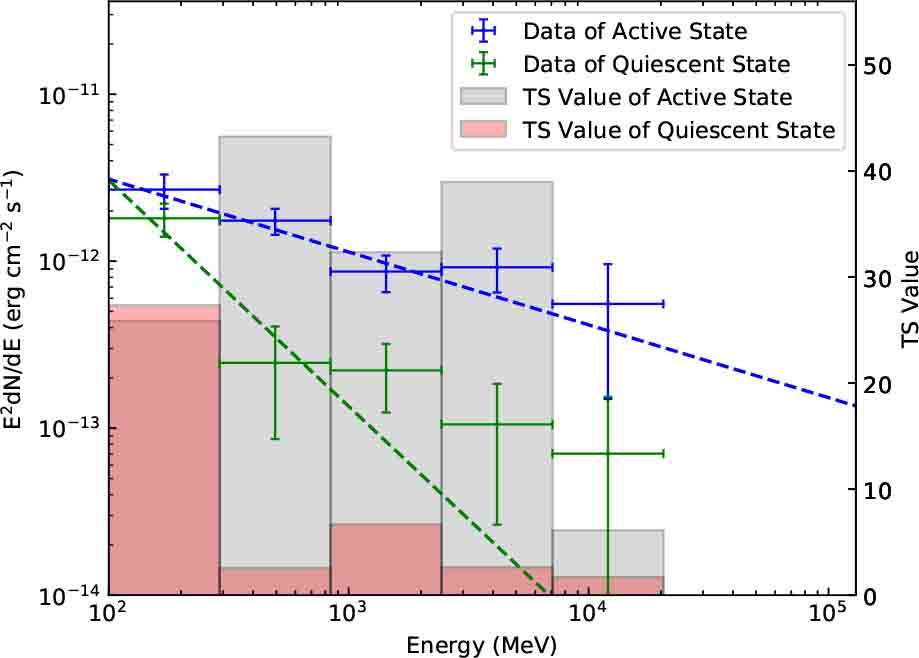
Fig. 6 The blue and green data points are from the active and quiescent states, respectively. The gray and red shaded regions indicate the corresponding TS values. The blue and green dashed lines represent the best-fit PL spectra from two different periods, respectively. Here we selected data points with TS value>1 to compare.
Download figure:
Standard image3. Discussion and conclusion
flat-spectrum radio source, PMN J0218–2307, was found to be the γ-ray source with an angular separation of 0.016° from the best-fit position. With the data collected from MJD 54682 to MJD 58720 in the energy range of 100 MeV – 500 GeV, the TS value of PMN J0218-2307 is 111.716 with a significance level of 9.93σ. The timing analysis with 90 day bins during the period indicates a significant flare with a photon flux of (9.749 ± 2.113) × 10−9 ph cm−2 s−1 and TS value of 73.283 in 0.1–500 GeV band. By further studying the characteristics of the flare, we found the flare is still significant in the cases of the finer time bin and different energy bands. Additionally, the high TSvar values of 30 day bins are calculated, and their variability significance levels are greater than 7σ in the different energy bands, which produce convincing evidence for variability of the source.
The results of the global fit of the power-law (PL) spectral model for the quiescent and active states show that the spectral index of the active state is harder than that of the quiescent state as expressed in Table 2 and Figure 6. The energy flux and TS value of each bin of the active state are higher than those of the quiescent state. Furthermore, the significance level of the global fit in the active state is around two times higher than that of the quiescent state.
Table 2. The Best-fit Parameters with PL Model for the Two Different Periods
| Source State | F100 | Model | Γ | TS value | Significance |
|---|---|---|---|---|---|
| 10−8 ph cm−2 s−1 | level | ||||
| active state | 0.813 ± 0.193 | PL | 2.436 ± 0.105 | 133.893 | 10.96σ |
| quiescent state | 1.349 ± 0.231 | PL | 3.354 ± 0.444 | 37.270 | 5.24σ |
The region of the γ-ray emission within 68% of the error radius has three other cross-identified objects besides PMN J0218–2307 from the different catalogs detected in the radio bands including 1.4 GHz, 5 GHz, 8 GHz, 8.4 GHz and 20 GHz as given in Table 3. As featured in Figure 7, we found that the positions of the three radio sources in Table 3 are within the 1σ error radius of the best-fit position, where they are highly coincident with the spatial position of the PMN J0218–2307, so we suggested that they are likely to be the same source and are the radio counterpart of the high-energy γ-ray source 4FGL J0218.9–2305 (e.g., Xing et al. 2016; Zhang et al. 2016; Yuan et al. 2018). Considering the association of PMN J0218–2307 and the γ-ray source, this will be the first time to identify the flare of the GeV γ-ray from it.
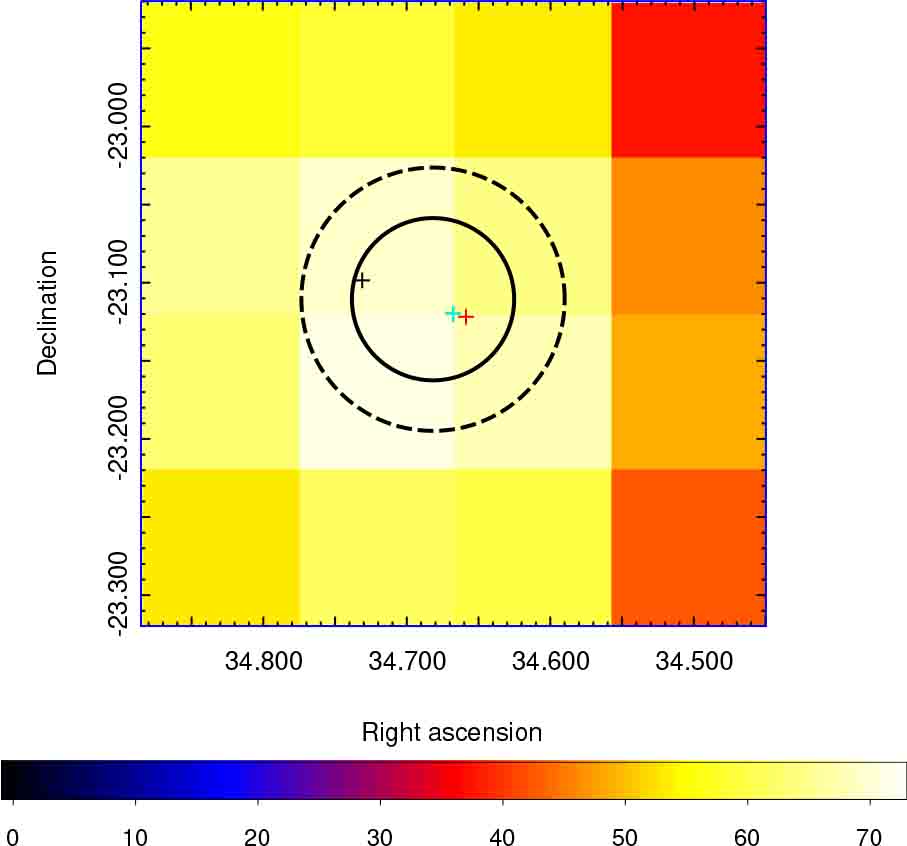
Fig. 7 TS map of 0.4° × 0.4° region with 0.1° pixel size in 400–500 GeV band centered at the best-fit position of PMN J0218–2307. Solid and dashed black circles represent the 68% and 95% error circles of the best-fit position of PMN J0218–2307, respectively. Cyan cross: CRATES J0218–2307; red cross: PMN J0218–2307; green cross: NVSS J021840–230711; blue cross: AT20G J021840–230712; black cross: 4FGL J0218.9–2305.
Download figure:
Standard imageTable 3. Data in Radio Band from PMN J0218–2307
| Object Name | Observed Passband | Flux density | Coord. targeted (J2000) | Angular separation | Reference |
|---|---|---|---|---|---|
| GHz | mJy | R.A. Decl. | deg | ||
| PMN J0218–2307 | 4.85 | 118 ± 12 | 02:18:38.10 -23:07:19.0 | 0.024 | Griffith et al. (1994) |
| CRATES J0218–2307 | 8.4 | 23.1 | 02:18:40.21 -23:07:12.4 | 0.016 | Healey et al. (2007) |
| NVSS J021840–230711 | 1.4 | 67.5 ± 2.1 | 02:18:40.26 -23:07:11.6 | 0.016 | Condon et al. (1998) |
| AT20G J021840–230712 | 5 | 39 ± 3 | 02:18:40.27 -23:07:12.1 | 0.016 | Murphy et al. (2010) |
| — | 8 | 36 ± 3 | 02:18:40.27 -23:07:12.1 | 0.016 | — |
| — | 20 | 55 ± 4 | 02:18:40.27 -23:07:12.1 | 0.016 | — |
The fifth column is angular separation from the best-fit position of the γ-ray source and the position of relevant radio source.
PMN J0218–2307 with a significant γ-ray flare makes it a likely blazar candidate (Healey et al. 2007). Considering its spectral index of Γ ≈ 2.4 in the flare period and being within the average index range 2.4–2.5 of Fermi-LAT γ-ray FSRQs (Ackermann et al. 2015), the result implies that its characteristic of GeV radiation is similar to that of FSRQs in the local Universe. More observations in the other energy bands are necessary to firmly verify the association of PMN J0218–2307 and the γ-ray source. It is also necessary to acquire optical data to distinguish the AGNs' type of PMN J0218–2307 in the future.
Acknowledgements
We sincerely thank the referee for his/her invaluable comments, and we gratefully acknowledge Prof. Zejun Jiang, Prof. Li Zhang, Pengfei Zhang, Jianeng Zhou, Zhongxiang Wang and Fangkun Peng for their generous help. In addition, we thank the support for this work from National Key R&D Program of China under grant No. 2018YFA0404204, the National Natural Science Foundation of China (NSFC, U1931113, U1738211 and U193110119), the Foundations of Yunnan Province (2018IC059, 2018FY001(-003)), the Scientific Research Fund of the Yunnan Education Department (2020Y0039) and the China Postdoctoral Science Foundation funded project (2019M661971).
Footnotes
- 1
- 2
- 3
- 4
- 5