Abstract
PSR J0742−2822 is known for its quasi-periodic changes in the observed pulse profile and spindown rate. In this paper, we analyzed 13 years of timing data obtained with the Nanshan 25-m radio telescope and the Parkes 64-m radio telescope. We found that the average values of the spin-down rate ( ) of this pulsar changed in four different states. We investigated the correlation between
  and W50, and ascertained that the correlation changed in different
  states. Moreover, not all the changes in
  states and correlation can be associated with glitch activities. We examined the long term evolution of γ-ray flux (0.1–300 GeV) and the pulse profiles corresponding to the four different states using Fermi-LAT Pass 8 (P8R3) data from 2008 August 5 to 2019 October 1. We did not detect a significant change in γ-ray flux or the pulse profile. Our results suggest that the connection between pulsar rotation and emission is more complex than previously reported for this pulsar.
Export citation and abstract BibTeX RIS
1. Introduction
Pulsars are the most stable rotators in the universe. They slow down gradually because their rotational energy converts into highly energetic particles and electromagnetic radiations. However, for many pulsars, their slow down is usually disturbed by timing noise, which manifests as a continuous irregular fluctuation in the timing residuals. Hobbs et al. (2010) analyzed the timing irregularities for 366 pulsars and found that the spin-down rates are correlated with the amplitude of timing noise. They also noted that the glitch recoveries usually dominate the timing noise in younger pulsars and a quasi-periodic time-correlated structure is seen in the residuals in many older pulsars. Lyne et al. (2010) studied the timing behaviors of 17 pulsars, which have quasi-periodic timing residuals and their spin-down rates switched between two or more states on a time scale from months to years. They demonstrated that the evolution of spin-down rates for six pulsars is correlated with the evolution of pulse profile. Such correlations indicate that the timing noise might be caused by changes in the magnetospheric state.
Although the spin-down rate ( , where
  is the pulsar spin frequency first time derivative) switching between two or more different states has been studied in many pulsars (e.g. Lyne et al. 2010; Kerr et al. 2016; Brook et al. 2016), the correlation between the changes of pulsar spin-down and pulse emission was rarely observed. Usually,
  changing from a low state (
 ) to a high state (
 ) can be triggered by pulsar glitch activities. For example, both the spin-down rate change of PSR J2037+3621 and the first spin-down rate increase of PSR J2021+4026 in October 2011 occurred after a pulsar glitch (Kou et al. 2018; Allafort et al. 2013). However, some pulsars experienced a state change without a glitch. For example, the spin-down rate of PSR J2043+2740 changed from
  state to
  state and remained in the
  state over about 1500 days; after this, it recovered to the
  state (Lyne et al. 2010). The spin-down rate of PSR J1001−5507 changed from
  state to
  state over about 800 days and no glitch was detected before this process (Chukwude & Buchner 2012). Similarly, the second spin down rate increase of PSR J2021+4026 occurred in February 2018 (Takata et al. 2020). Therefor, the spin-down change in these pulsars cannot be explained by the standard glitch model. In addition, the spin-down rate variation of these pulsars is related to the variation of pulse emission (Lyne et al. 2010; Chukwude & Buchner 2012; Allafort et al. 2013; Kou et al. 2018).
PSR J0742−2822 (B0740−28) was identified by the Bologna 408 MHz Pulsar Search Project (Bonsignori-Facondi et al. 1973). This is a radio loud γ-ray pulsar with rotation period P0 = 0.16676 s, rotation energy loss rate  and characteristic age τc
∼ 1.57 × 10⁵ yr. Eight glitches have been detected in this pulsar up to now (see the Jodrell Bank Pulsar Glitch Table
1
). Lyne et al. (2010) studied PSR J0742−2822 and found that
and characteristic age τc
∼ 1.57 × 10⁵ yr. Eight glitches have been detected in this pulsar up to now (see the Jodrell Bank Pulsar Glitch Table
1
). Lyne et al. (2010) studied PSR J0742−2822 and found that  and the pulse profile exhibit rapid oscillation. In addition, the spin-down and pulse shape change has a correlation. The Lomb-Scargle and wavelet spectral analyzes show highly periodic features (broader, less well-defined peaks). Keith et al. (2013) found no correlation between the observed pulse shape and spin-down rate for at least 200 days prior to a glitch at MJD 55020, following which the correlation became strong. These observations indicate that changes in emission state may be caused by the interaction between the interior of the neutron star and the magnetosphere of the pulsar.
In this paper, by combining data from Nanshan and Parkes radio telescopes, we obtained the long-term variation of the spin-down rate and the pulse profile of PSR J0742−2822 over 13 years of data span, and investigated the correlation between them. In addition, we also analyzed the variation of the γ-ray flux and pulse profile of this pulsar with Fermi-LAT data.
2. Observations and Analysis
2.1. Radio Dta
Timing data of PSR J0742−2822 from the Nanshan 25-m radio telescope were collected between October 2006 and January 2020 by a cryogenic receiver, which had a center frequency of 1540 MHz and a bandwidth of 320 MHz. Before 2010, the data were recorded by an analog filter bank (AFB), which had 2×128×2.5 MHz channels (see Wang et al. 2001). Since January 2010, a digital filter bank (DFB) has been employed to record timing data. The DFB has 8-bit sampling and 1024×0.5 channels (for details see Dang et al. 2020). The sub-integration times of the AFB and DFB are 1 minute and 30 seconds, respectively. The observing cadence of this pulsar is about three times per month and the integration time is 4 minutes for each observation.
Timing data from the Parkes 64-m radio telescope were acquired between July 2007 and April 2018 with a central observing frequency of 1369 MHz. The raw data were recorded by a series of DFBs (PDFB1/2/3/4). We obtained the Parkes timing data via the CSIRO Data Access Portal 2 (Hobbs et al. 2011).
After obtaining the data, we employed the psrchive software (Hotan et al. 2004) to excise radio-frequency interference, and to incoherently de-disperse, and to scrunch data in time, frequency and polarization to form mean pulse profiles. All available data were summed for each system to form a standard profile as a template. Then, the mean pulse profile of each observation was cross-correlated with the template to generate the times of arrival (ToAs) of a topocentric pulse. For the sake of eliminating the effects of Earth's motion, these ToAs were transformed to that at the solar-system barycenter (SSB). Here, we referenced the solar system ephemeris DE421 (Folkner et al. 2009) and the Barycentric Coordinate Time (TCB). The offsets between the Nanshan and Parkes ToAs were included in the timing model. To correct the measured uncertainties, we employed the EFACEQUAD plugin to determine the "EFAC" and "EQUAD" for the original uncertainties and the extra noise in quadrature, respectively.
2.2. Fermi-LAT Data
To investigate the high energy emission of PSR J0742−2822, we selected the Fermi-LAT Pass 8 (P8R3) data in a radial region of interest (ROI) centered at the 4FGL J0742.8−2822 position and the energy range is 0.1-300 GeV. The data span a total of 11 yr from 2008 August 5 to 2019 October 1. The long-term light curves for the full data span and in a radial ROI centered at the 4FGL J0742.8−2822 position were analyzed using the binned likelihood analysis in the Fermi science tools. All the events were converted in the front and the back sections of the tracker (i.e. evtype = 3), and the point source analysis (i.e. evtclass = 128) was adopted as the event class. We only collected the data within the time intervals determined as high quality (i.e. DATA QUAL > 0). In addition, to reduce contamination from γ-rays arising from Earth's albedo, we filter the photons with zenith angles < 90°. In order to explain the contribution from the spectra, we constructed a background emission model. This model contains all the catalog sources of 4FGL within 10° of the ROI center, as well as Galactic diffuse emission (gll_iem_v07) and isotropic diffuse emission (iso_P8R3_SOURCE_V2_v1) reported by the Fermi Science Support Center. Utilizing the "gtlike" tool of the Fermi science tools, we excised insignificant sources and obtained the best-fit spectra of all background sources. Subsequently, we divided the entire data span into 40 day time bins and fixed the contribution of spectra utilizing the background emission model. Applying the binned likelihood analysis, we refit the flux (> 100 MeV) of PSR J0742−2822. Furthermore, we extract the source events within a 1° radius centered at the target and employ the "gtbary" tool from the science tools to convert the ToA of all photons to the SSB. Then we obtained the pulse profile by executing the fermi plugin of tempo2.
3. Results
We consider both Nanshan and Parkes data to investigate the long term variation of  and the full widths of the pulse profile at 50% of the peak pulse amplitude (W50) (see: Fig. 1(a) and (b)). The correlation between W50 and
  is displayed in Figure 1(c). Using the Fermi-LAT data, we also examined the variation of the γ-ray flux and pulse profile of this pulsar (Fig. 1(d)). Details of the results are as follows.
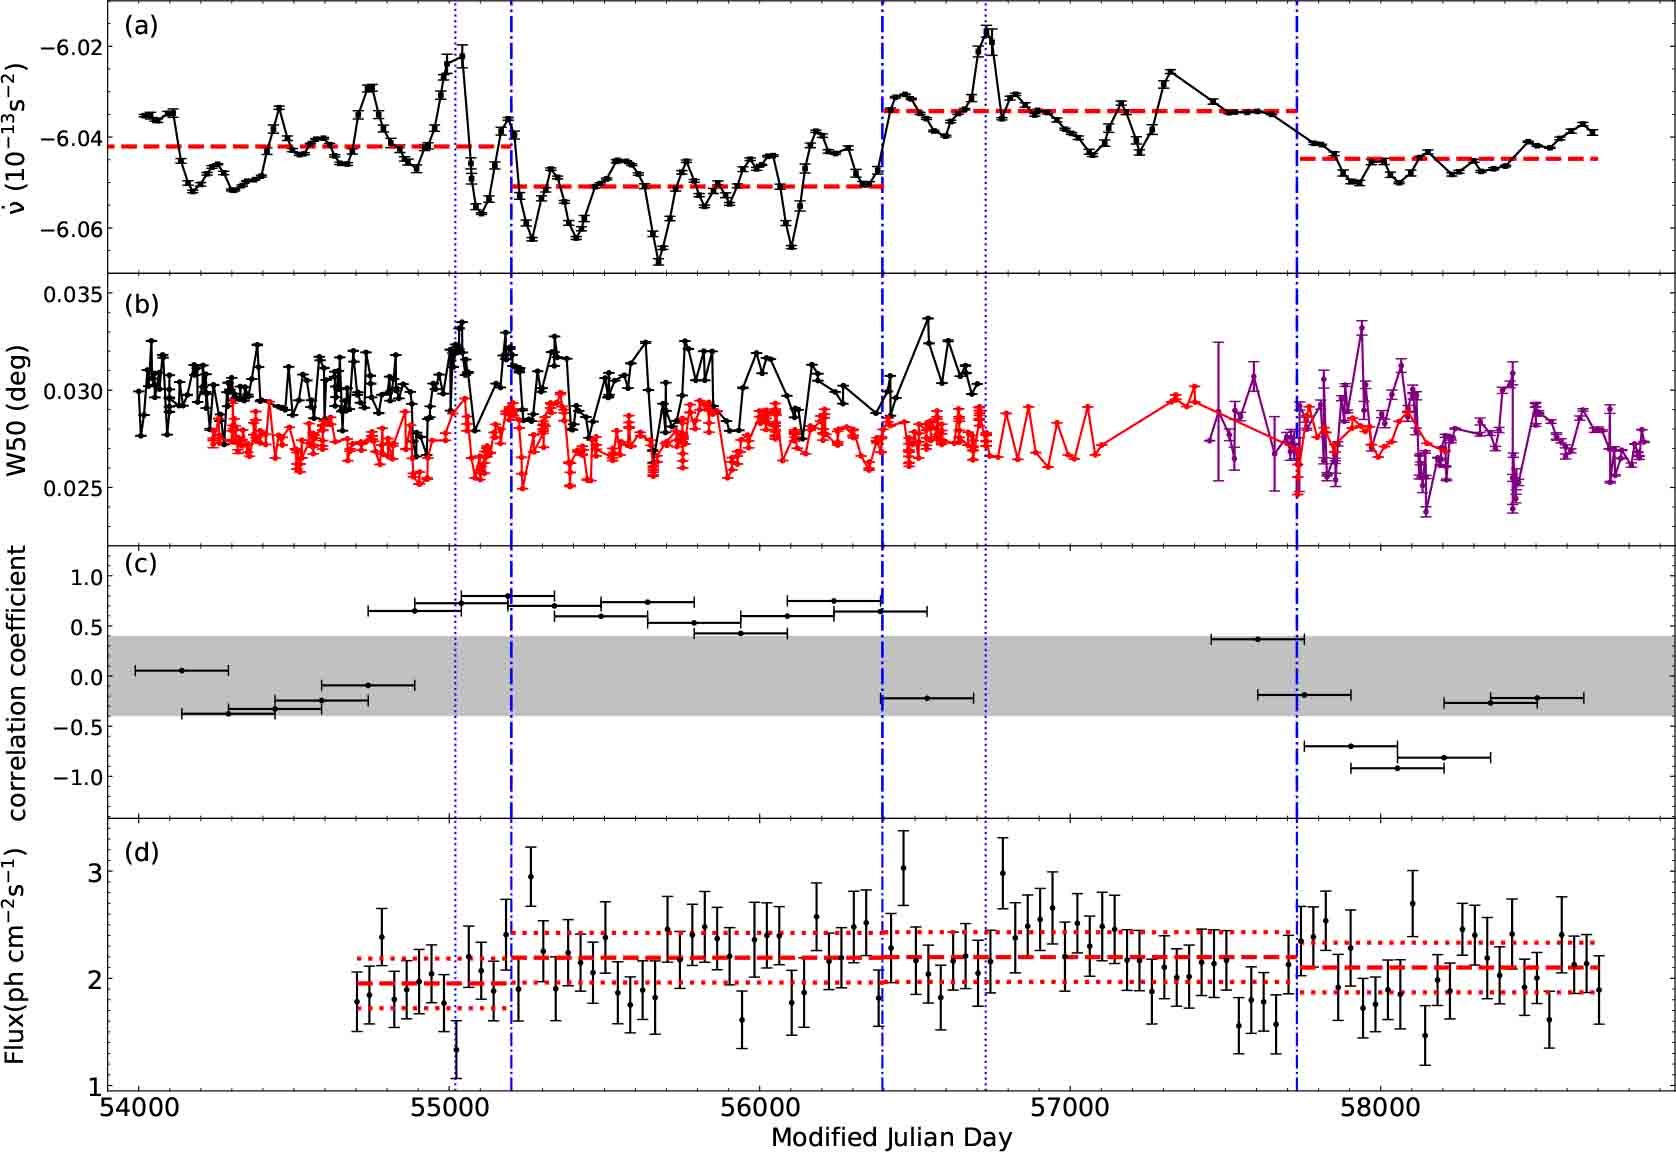
Fig. 1 Variation of the spin-down rate and pulse profile. Panel (a) is the spin-down rate, panel (b) is W50, panel (c) is the cross-correlation coefficients between spin-down rate and W50 and panel (d) is the evolution of the 0.1–300 GeV flux of PSR J0742–2822. The red horizontal lines in panel (a) stand for the average values of  . The blue vertical dotted line and bold dash-dotted lines in each panel represent the glitch epoch and the boundary between each
  state respectively. The red, black and purple dots in panel (b) signify the W50 from Parkes data, Nanshan AFB and DFB data, respectively. The horizontal red dashed lines and the horizontal red dotted lines in panel (d) trace the average values of flux and their 3σ uncertainties, respectively.
Download figure:
Standard image3.1. Changes in the Spin-down Rate
Panel (a) of Figure 1 features the variation of  , which exhibits a quasi-periodic structure.Using the auto-correlation function (e.g. Perera et al. 2015), we ascertained that the time scale of the quasi-periodic structure of
  is about 170 d. The values of ν and
  for PSR J0742−2822 were obtained by fitting the timing solutions for subsequent partially overlapping sections of data. Each data section contains 150 d and overlapping 130 d.We also can see that the average values of the frequency first derivatives (
 ) have a seemingly permanent change and change among four different states. The time range, the corresponding
  and increment relative to the previous average value,
  , are expressed in Table 1. From MJD 54000 to 55225,
  has an average value of
  (state I). After MJD 55225,
  reduced by about
  and changed to a new state (state II). This state continues with
  until MJD 56380. Since then,
  increased to another state, and the corresponding
  and
and  are ∼
are ∼  and 1.7(1) × 10−15 s−2 (state III), respectively. After MJD 57730,
  decreased gradually to −6.0448(8) × 10−13 s−2, the corresponding increment
  (state IV), which is consistent with the initial level (∼ MJD 54000-55225) within the uncertainty. Two glitches were reported in the literature, which correspond to our data span at MJD 55020 and MJD 56727, respectively. We found that the changing in
  from state I to II may be caused by the glitch at MJD 55020. No glitch was detected before
  changed from state III to IV. Furthermore, we did not detect the permanent-like change in
  after the MJD 56727 glitch.
Table 1. The Average Value of the Frequency First Derivative ( ) and its Increment (
 ) in Four States
| State number | Rang (MJD) |
 (10−13 s−2) (10−13 s−2) |
 (10−15 s−2) (10−15 s−2) |
|---|---|---|---|
| I | 54000–55225 | −6.0436(6) | — |
| II | 55225–56380 | −6.0509(9) | −0.73(9) |
| III | 56380–57730 | −6.0343(9) | 1.7(1) |
| IV | 57730–58700 | −6.0448(8) | −1.1(1) |
Uncertainties in parentheses are in the last quoted digit and represent 1σ, which are obtained from the standard uncertainty propagation.
3.2. Correlation between the Spin-down Rate and Radio Emission
It is known that the profile parameters of PSR J0742−2822 oscillate between two different modes (Lyne et al. 2010; Keith et al. 2013). In this paper, we use W50 as the pulse profile parameters for this pulsar. Panel (b) in Figure 1 is the variations of W50 in both Parkes and Nanshan data with time. The gap between MJD 56670 and 57450 of Nanshan data resulted from the instrument upgrade. It is obvious that W50 changed rapidly between narrow and wide mode; the change time scale is about 200 d. Although the value of W50 for Parkes and Nanshan data is different caused by the different center frequency and different back-end, the trend is very consistent. We have investigated the long-term variation of the cross-correlations coefficients (ρ) between W50 and  during the about 13 year data span. Here, we only use W50 from the Nanshan data, because it has longer data span than Parkes data. In order to obtain ρ, we interpolate to match the time solutions of W50 and
  . Panel (c) in Figure 1 shows the variation of ρ between W50 and
  for 300-d windows and overlapping 150-d. The gray region in panel (c) is −0.4 < ρ < 0.4, which stands for no correlation between W50 and
  . As we see, no correlation was detected over about 1000 d before the MJD 55020 glitch. After this glitch, ρ increased and remained in a high state over about 1360 d (from MJD 55020 - MJD 56380). We cannot obtain the values of ρ in the data gap due to lack of data. With
  changing to state IV, the correlation gradually becomes strong first (where ρ is close to −1) and then becomes weaker again after about 600 d. According to the trend in the ρ values, we predict that ρ values might remain in a weak state in the data gap.
3.3. Long-term Variation of the γ-ray Flux and Profile
We investigated the long-term evolution of γ-ray flux (0.1–300 GeV) for PSR J0742−2822 in Figure 1(d). Each bin is 40 d and the total data span is from 2008 August 1 to 2019 October 1. The horizontal red dashed lines and red dotted lines in panel (d) represent the average values of γ-ray flux and its 3σ uncertainties, which are from the standard uncertainty propagation, respectively. Table 2 expresses the average value of the 0.1-300 GeV flux (FFlux) and its increment (Δ FFlux) and the fractional change ( ) in four states. It is obvious that the uncertainties of flux increments are larger than its value. Therefore, we believe that the γ-ray flux of this pulsar does not change significantly when
  changes.
Table 2. The Average Value of the 0.1–300 GeV Flux and its Increment in Four States of PSR J0742–2822
| State number | Range (MJD) | FFlux (ph cm−2 s−1) | Δ FFlux (ph cm−2 s−1) |

|
|---|---|---|---|---|
| I | 54700–55225 | 1.9(2) | — | — |
| II | 55225–56380 | 2.2(2) | 0.2(3) | 0.1(2) |
| III | 56380–57730 | 2.2(2) | 0.01(23) | 0.003(100) |
| IV | 57730–58700 | 2.1(2) | −0.1(2) | 0.04(10) |
Uncertainties in parentheses are in the last quoted digit and are 3σ, which are obtained from the standard uncertainty propagation. *The fractional flux change is relative to the previous state.
We have obtained the γ-ray pulse profile for the whole data span and each  state (see Figs. 2 and 3). The photons were selected within a 1° radius of the pulsar and the photon energy range was from 0.1–300 Gev. The phase of each photon was assigned by the radio timing solution. In order to compare the differences of the profile in each
  state with the profile of the whole data span, we normalized all pulse profiles. Panels (a')-(d') of Figure 3 show the residuals of the total integral profile after subtracting the profile in each
  state. Although the γ-ray pulse profile appears to be different in different states, we cannot confirm these changes because of the small number of photons.
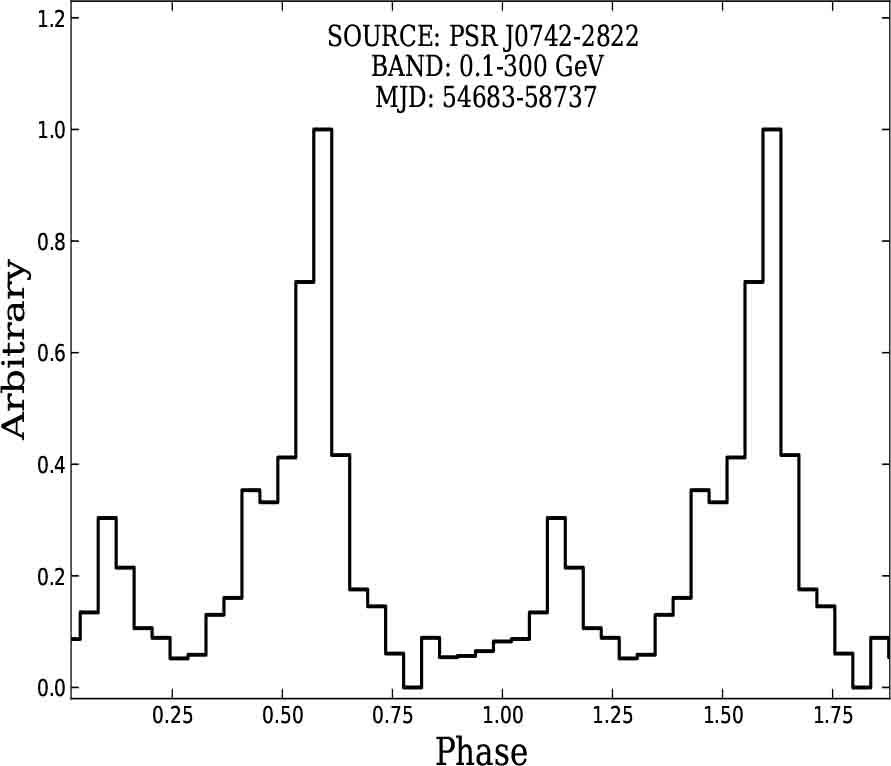
Fig. 2 Normalized pulse profile of PSR J0742−2822 generated with photon energy from 0.1–300 Gev in the whole data span.
Download figure:
Standard image
Fig. 3 Normalized pulse profile of PSR J0742−2822 generated with photon energy from 0.1–300 Gev in each  state. Panels (a)-(d) are the pulse profile for the states I, II, III and VI, respectively. Panels (a')-(d') display the residuals after the profile is subtracted from the total integral profile in Figure 2 in each panel.
Download figure:
Standard image4. Discussion
In this paper, we found that the spin-down rate of PSR J0742−2822 oscillates around an average value ( ) over about three years; after MJD 55225, a permanent-like change was detected in
  , which changed to a high state (∼ 6.0509(9)× 10−13 s−2), with the corresponding increment being
  . Although the time interval between glitch at MJD 55020 and
  change at MJD 55225 is about 205 d, which exceeds the general glitch recovery time scale, we still cannot rule out the possibility that the glitch active at MJD 55020 lead to the increase of spin-down rate. Keith et al. (2013) found that the correlation between the pulse profile parameters and
  was detected in PSR J0742−2822 after a glitch at MJD 55020. No correlation was present for about 200 d before that and they believe that this was triggered by the glitch at MJD 55020. We also detected the change of correlation between
  and W50 during Keith et al. (2013)'s data span. We ascertained that the correlation disappeared after 1400 d, which coincided with the decrease of spin-down rate. This event did not involve a glitch, as a small glitch occurred 350 d later. During MJD 57730–58700, the
  change to a high state (
 ) and the inverse correlation between
  and W50 gradually becomes strong first and then decays, which is independent of a glitch, as no abrupt jump was detected in spin frequency. Therefore, changes in the
  and the correlation could not be only attributed to the glitch events. Generally, glitches are believed to originate from the interior of the neutron star, but emissions are believed to originate from the magnetosphere. The detected glitch-triggered variation of emission provides us an opportunity to study the interaction of rotation and emission, but for PSR J0742–2822 the connection between pulsar rotation and emission is more complex.
The change of  reflects the change of external braking torque of the pulsar. The permanent-like relative change of
  can be caused by changes in the inclination angle (Link et al. 1992; Link & Epstein 1997). According to the MHD simulation of Spitkovsky (2006), the relationship between the relative change of spin-down rate (
 ) and the magnetic angle (α) can be expressed as follows
The average increase of  is 0.12% and 0.18% for the state change at MJD 55225 and 57730, respectively. Therefore, for the relative increase of
  at MJD 55225 and 57730, the corresponding increase in the inclination angle is 0.09° and 0.15° respectively (here, we take α = 37°, Yadigaroglu & Romani (1995)). Moreover, the outflowing particle wind and precession possibly caused the permanent-like relative change of
  (e.g Kou & Tong 2015; Kou et al. 2018; Takata et al. 2020).
Generally, the particle acceleration of a pulsar is thought to occur in the open zone, on the magnetic field line above each pole passing through the light cylinder. The γ-ray emission of the pulsar is produced in an acceleration region near the light cylinder (Abdo et al. 2009). The glitch event affects the structure of the magnetosphere around the light cylinder, which may lead to changes in γ-ray emission. The changes in α result in the change of duration of the line of sight's pass through the pulse emission cone, and hence lead to measurable changes in the pulse profile. According to Link & Epstein (1997), the corresponding increment of the total pulse flux is ∼|Δα|/Whalf, where Whalf is half of the width of the emission cone. When we use the value of Whalf = 5° obtained by Yadigaroglu & Romani (1995), the corresponding changes in flux are ∼ 2% and 3% for the  state change at MJD 55225 and 57730 respectively. We do not detect a significant change of γ-ray flux and the γ-ray pulse profile of PSR J0742−2822, which may due to its γ-ray flux being relatively weak (∼ 3.2 ± 0.6 × 10⁻⁸ ph cm−2 s−1).
5. Summary
In this paper, we have:
- Found that
 of PSR J0742−2822 changes in four different states.
 - Investigated the correlation between and W50 and ascertained that the correlation changed with time. However, not all the changes of states and correlations can be associated with the glitch activities.
- Obtained long term evolution of γ-ray flux (0.1–300 GeV) of this pulsar using about 11-years of Fermi-LAT Pass 8 (P8R3) data and did not detect a significant change in γ-ray flux.
- We expect long-term regular radio observation of this pulsar in the future, as well as a more sensitive γ-ray telescope to monitor it, to help us better understand the relationship between spin-down and radiation.


Acknowledgements
We thank Dr. Rushuang Zhao, Jie Liu and members of the XAO Pulsar Group for useful discussions. This work is supported by the National Key Research and Development Program of China (2016YFA0400804, 2017YFA0402602, 2018YFA0404603 and 2018YFA0404703), the Operation, Maintenance and Upgrading Fund for Astronomical Telescopes and Facility Instruments, budgeted from the Ministry of Finance of China (MOF) and administered by the Chinese Academy of Sciences (CAS), the National Natural Science Foundation of China (Grant Nos. 11873080, U1831102, U1731238, U1938109, U1838104, 11873040, 11573010, 11661161010, U1631103 and U1838102), the Youth Innovation Promotion Association of Chinese Academy of Sciences, the CAS "Light of West China" Program (Nos. 2018-XBQNXZ-B-023, 2018-XBQNXZ-B-025 and 2016-QNXZ-B-24), the Tianshan Youth Program No. 2018Q039, the Open Project Program of the Key Laboratory of FAST, NAOC, Chinese Academy of Sciences, the China Postdoctoral Science Foundation grant (2019M650847), the 2016 and 2018 Project of Xinjiang Uygur Autonomous Region of China for Flexibly Fetching in Upscale Talents and the Science and Technology Fund of Guizhou Province (Grant Nos. (2016)–4008 and (2017) 5726–37). The Parkes radio telescope is part of the Australia Telescope National Facility which is funded by the Commonwealth of Australia for operation as a National Facility managed by CSIRO. This paper includes archived data obtained through the CSIRO Data Access Portal.