Abstract
Based on previous site testing and satellite cloud data, Ali, Daocheng and Muztagh-ata have been selected as candidate sites for the Large Optical/Infrared Telescope (LOT) in China. We present the data collection, processing, management and quality analysis for our site testing based on using similar hardware. We analyze meteorological data, seeing, background light, cloud and precipitable water vapor data from 2017 March 10 to 2019 March 10. We also investigated the relative usefulness of our all-sky camera data in comparison to that from the meteorological TERRA satellite data based on a night-by-night comparison of the correlation and consistency between them.We find a 6% discrepancy arising from a wide range of factors.
Export citation and abstract BibTeX RIS
1. Introduction
The topography of China is high in the west and descends to the east coast. The middle is dominated by basins, the Gobi Desert, rolling plateaus, towering massifs and the highest plateau on Earth. These western lands might be suitable for astronomical observations in the optical and infrared bands due to their higher altitude, lack of water vapor and human activity as well as better atmospheric transparency. Similar to most cultures, older observatories were located in or near existing large cities. After the 1980s, site testing gradually turned to the mid-west of China and some astronomical observatory sites were established, such as Delingha (Tian et al. 2016), Nanshan (Liu et al. 2014) and Gaomeigu (Chen et al. 2003). Altitudes of these sites at 2067 to 3216 m above sea level are systematically higher than the sites established before the 1960s, which are no more than 1000 m. These new sites resulted in a significant improvement in the available astronomical conditions and researchers there accumulated more experience with site testing in western China. The latest site testing work was launched in late 2016. Combining experiences of previous site testing and satellite cloud data (Cao et al. 2020), Ali (Liu et al. 2020), Daocheng (Song et al. 2020) and Muztagh-ata (Xu et al. 2020a,b,c) were selected for long-term site data monitoring. The distribution of observatories and candidate sites is shown in Figure 1 and briefly discussed below.
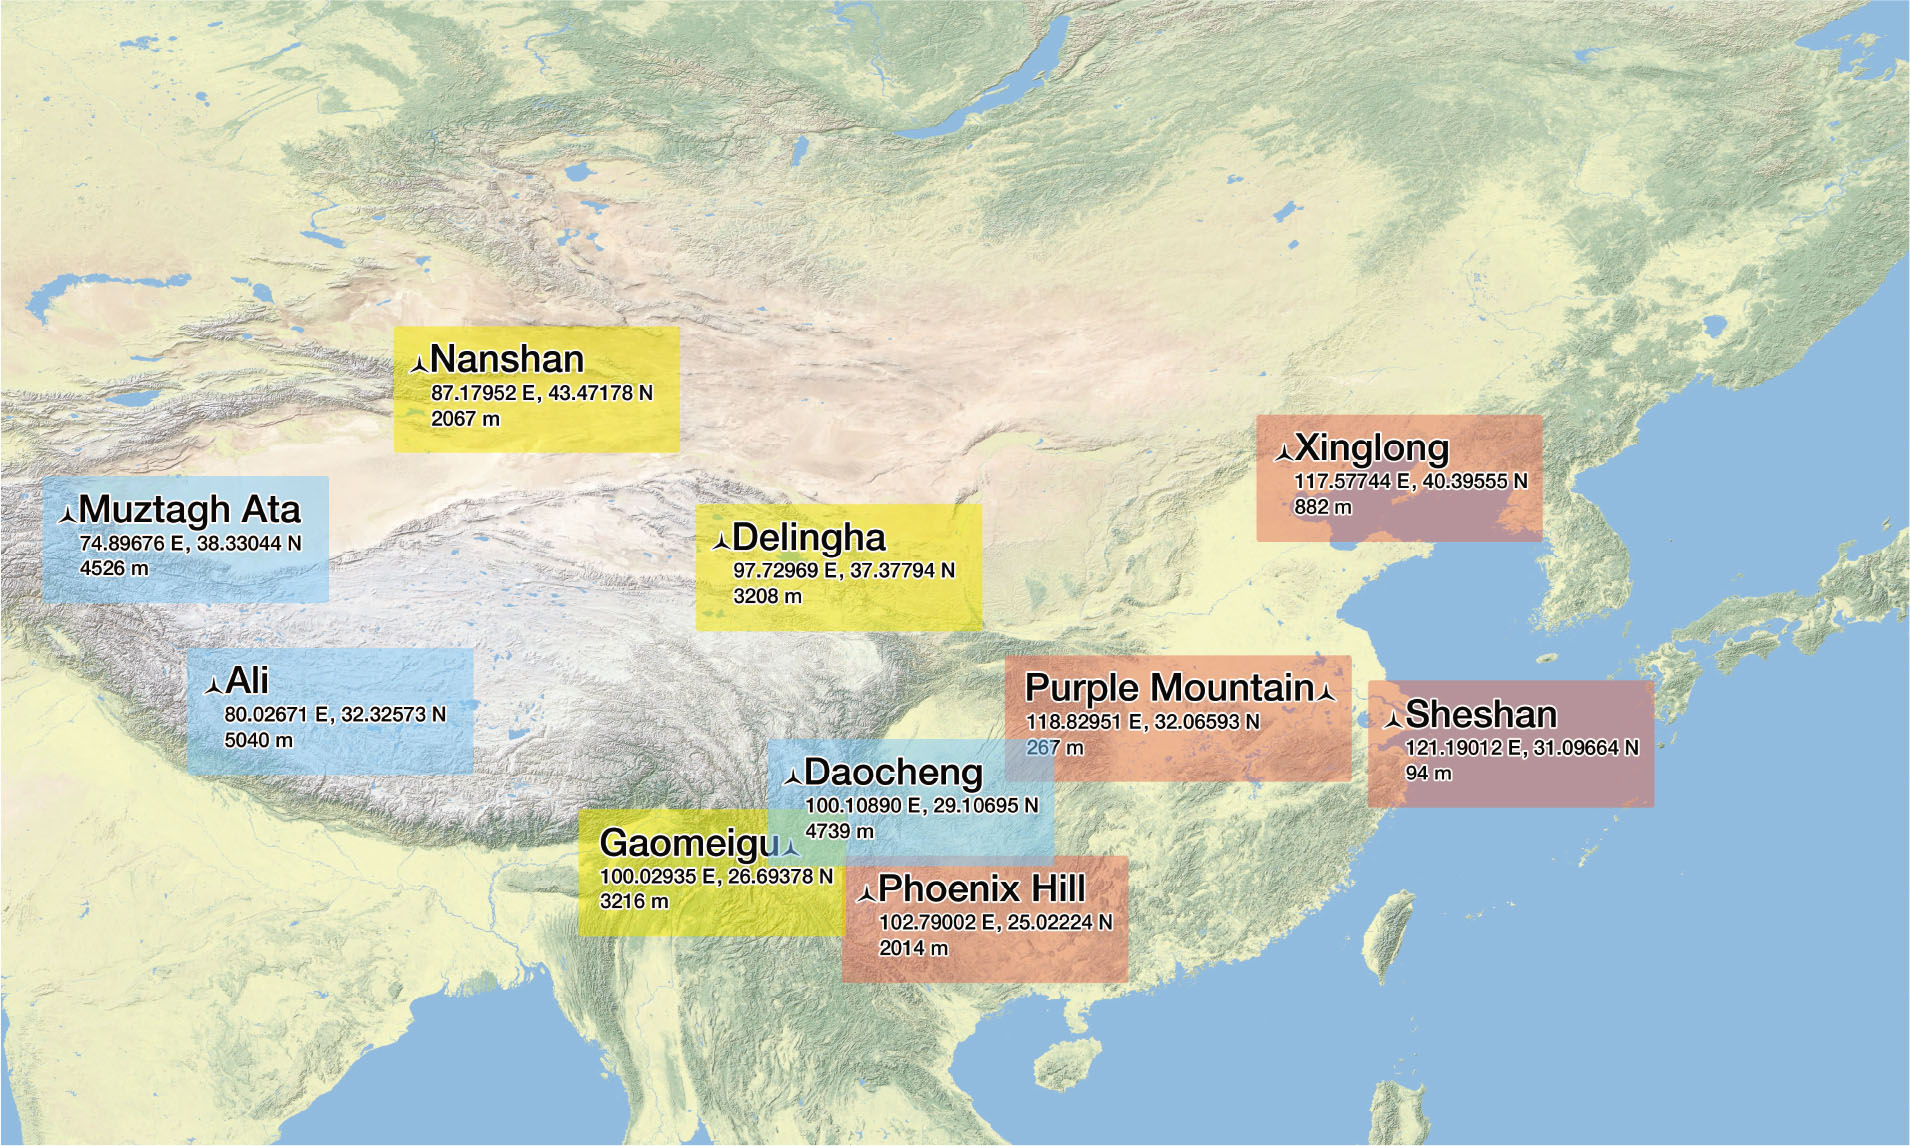
Fig. 1 Geographical distribution of observatories and candidate sites in China. The observatories marked in red were established before the 1960s. Observatories in yellow were established after the 1980s. The candidate sites referred to in this research are signified in blue.
Download figure:
Standard imageThe Ali site is located in the southwest of the Tibet Autonomous Region at the top of a mountain range where several measurement points have been investigated. The main instruments were deployed at Point A1 (longitude: 80.02671° E, latitude: 32.32573° N, altitude: 5040 m), see upper panels in Figure 2.
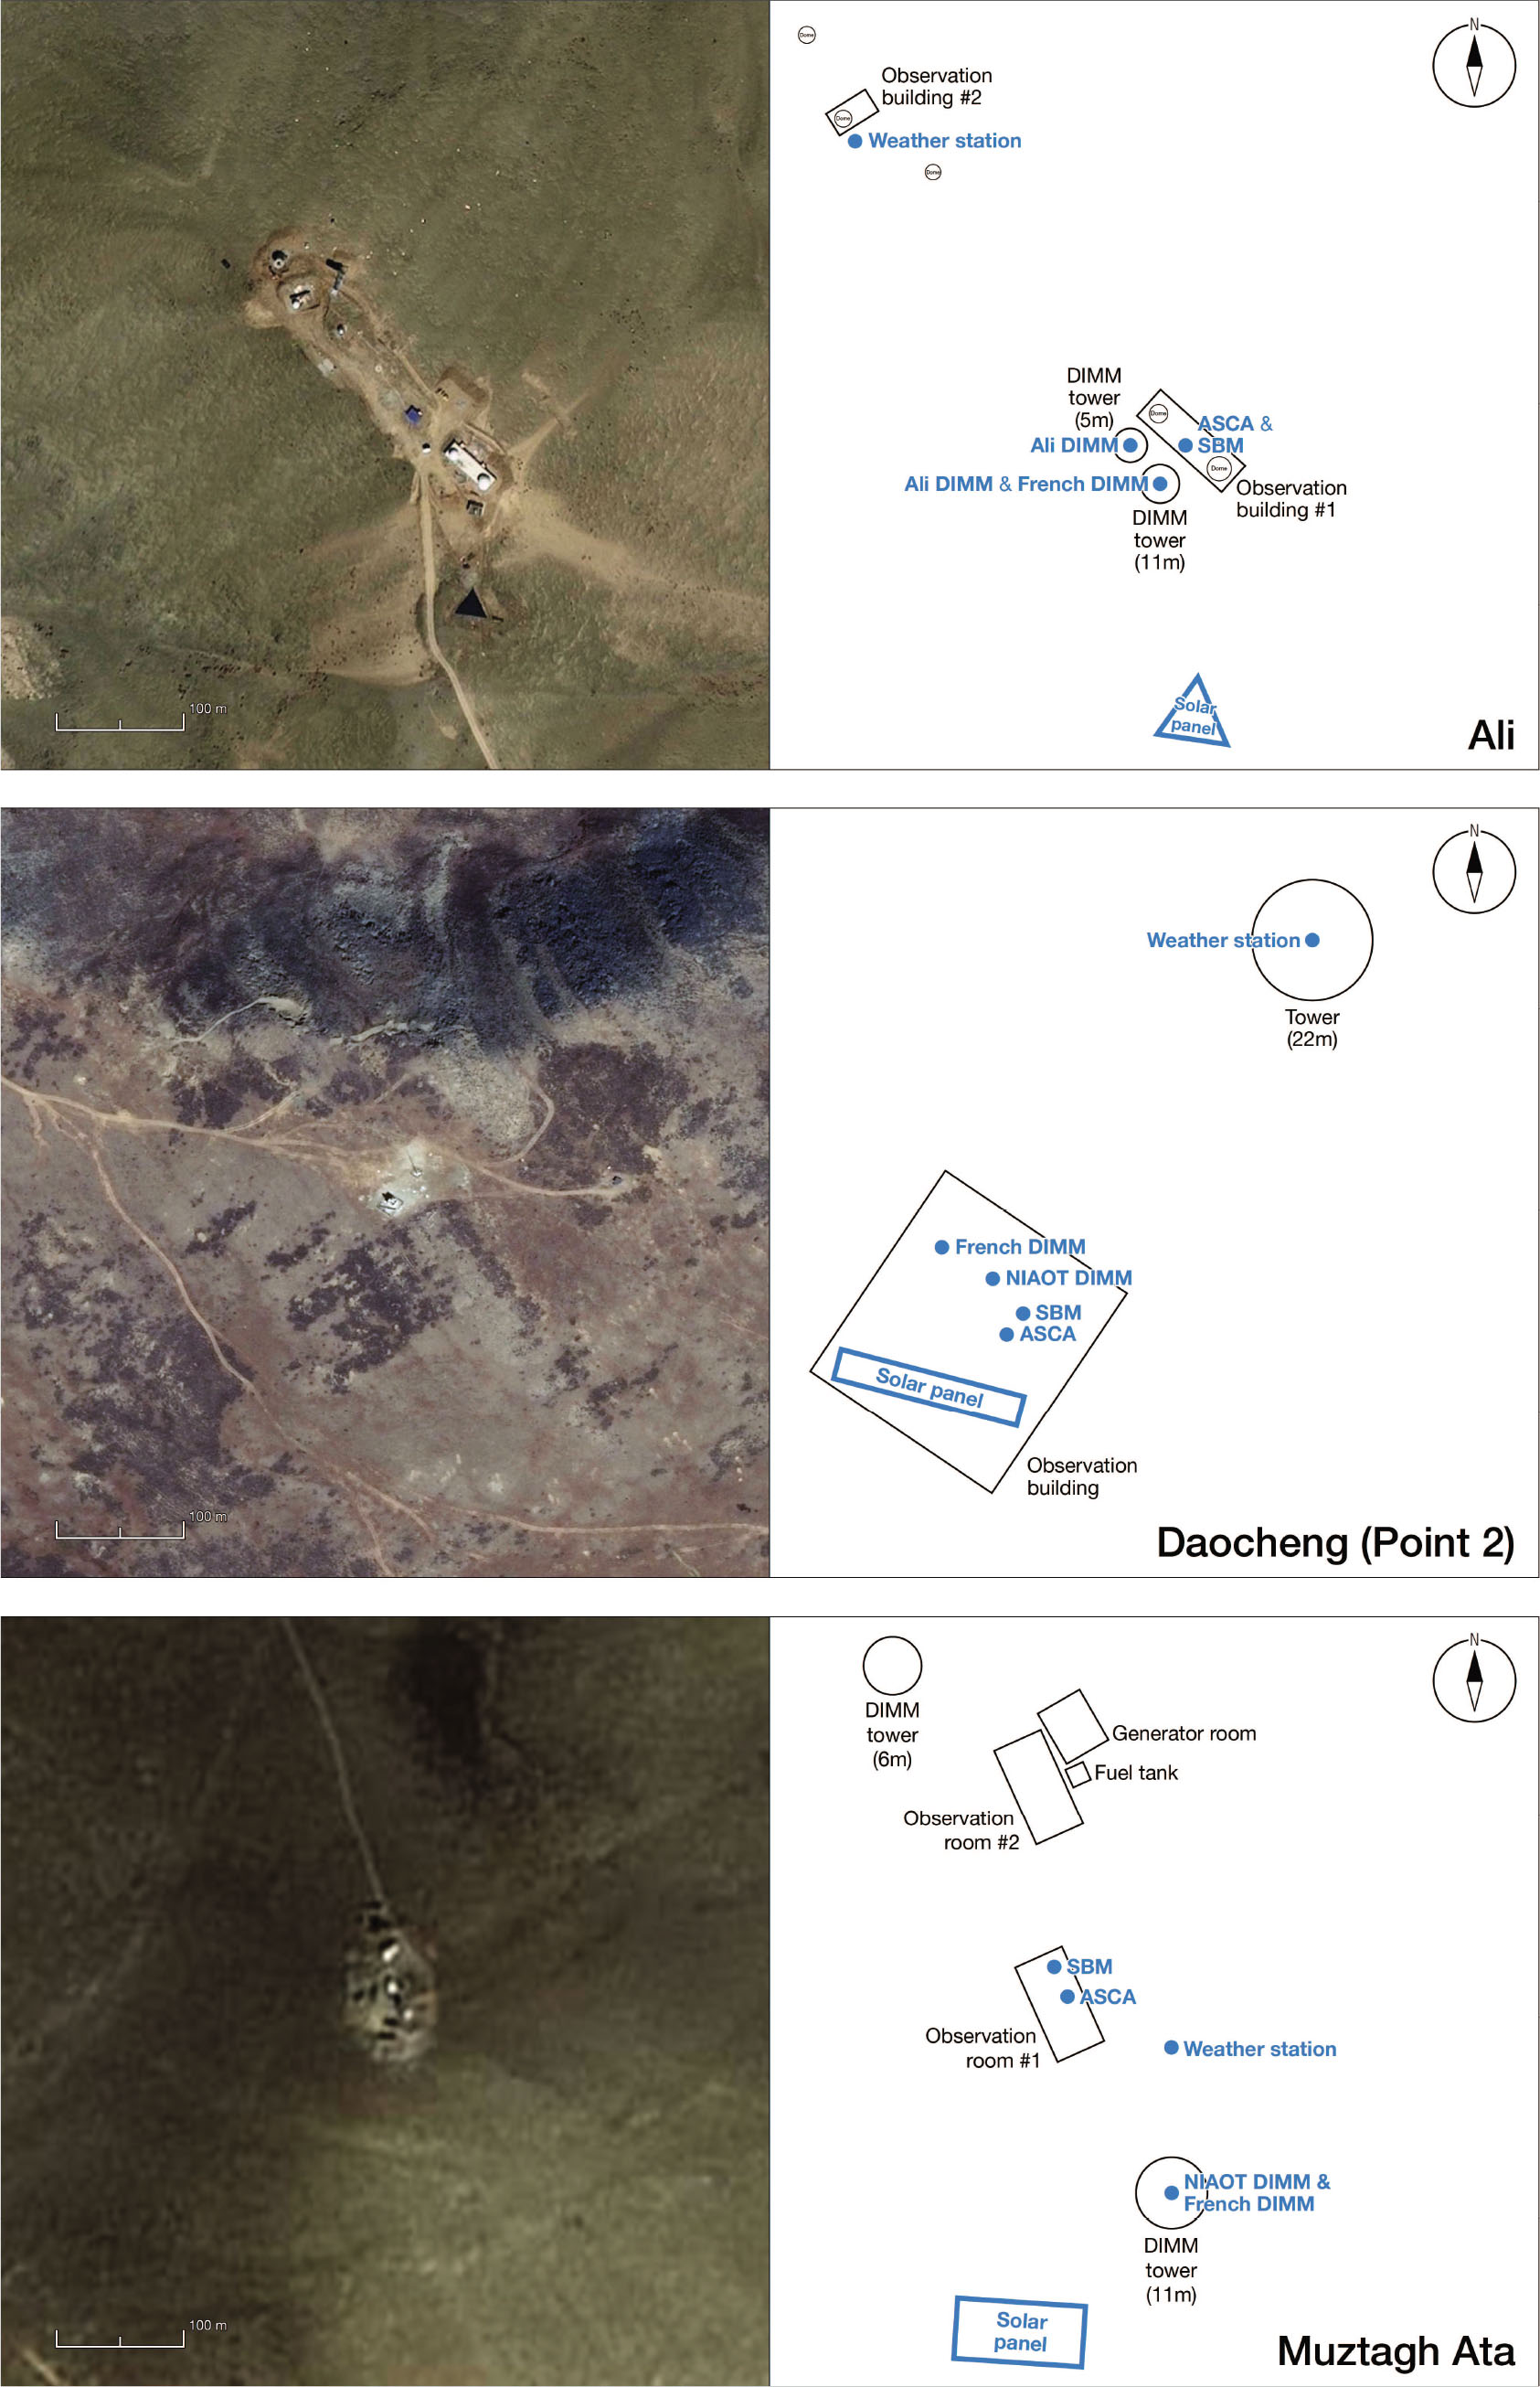
Fig. 2 The top row is the satellite map1 of Ali Point A1 and the arrangement of the primary instruments. The middle row is the satellite map2 of Daocheng Point 2 and the configuration of the primary instruments. The bottom row is the satellite map3 of Muztagh-ata and the depiction of the primary instruments. The diagrams of the primary instruments on the right-hand side do not have an accurate scale.
Download figure:
Standard imageThe Daocheng site, located between Ganze county and Daocheng county in Sichuan Province, with two measurement points, including Point 1 at Wumingshan Mountain (longitude: 100.10890° E, latitude: 29.10695° N, altitude: 4739 m) and Point 2, the main site of interest for night observation on the same mountain (longitude: 100.10890° E, latitude: 29.10695° N, altitude: 4739 m). The Daocheng instrument configuration is displayed in the middle panel of Figure 2.
The Muztagh-ata site is located in the eastern Pamirs (longitude: 74.89676° E, latitude: 38.33044° N, altitude: 4526 m). The instrument layout is depicted in the bottom panel of Figure 2.
The sites are spread between 75° E and 100° E which represent a latitude region relatively lacking in large optical and infrared telescopes and at altitudes higher than 4500 m. Thus, it is probable that such a telescope should be in a competitive position to contribute to time-sensitive monitoring observations and astronomical events of particular interest (e.g., Brown et al. 2013). A next generation optical/infrared telescope will likely require an adaptive optics system so that the full range of meteorological data deserves attention, including weather, night cloud cover, night seeing, night sky background and precipitable water vapor (PWV). Furthermore, it is necessary to refer to the full range of 24-hour meteorological data for the construction and routine maintenance of the observatory infrastructure and the nighttime parameters should be analyzed for the astronomical observations in optical and infrared bands. The meteorological measurement instruments deployed at each site started to collect data regularly on 2017 March 10. The operation of each site and data processing are performed by different teams.
This article introduces and discusses the details of the site testing data acquisition and processing, and the arrangement is as follows: In Section 2, we briefly introduce the acquisition and processing of weather station (WS) data and PWV data. In Section 3, we analyze the differential image motion monitor (DIMM) raw data acquisition and introduce our data processing. In Section 4, we describe the Sky Background Meter (SBM) data, All-sky CAmera (ASCA) data and data processing. In Section 5, we showcase our site testing data management and quality control. In Section 6, we investigate the correlation and consistency of the ASCA and satellite data. In Section 7, we summarize our conclusions.
2. Weather Stations and Precipitable Water Vapor Data
2.1. Weather Station Data
Each site is equipped with a Huayun CAWS-600 six-element automatic WS4 to ensure precision and consistency of the meteorological data. This includes temperature, air pressure, relative humidity, wind speed and wind direction, which can be measured, stored and transmitted by the WS. All WSs have passed a standard quality check at the factory. Their installation was made by the local operations team at each site. The WS data measurement interval can be set from 1 second to N minutes, and the output average values and min/max values are derived from all samples within the corresponding data measurement period. All key parameters of the WS are taken from the manual and listed in Table 1.
Table 1. Critical Parameters Obtained from CAWS-600 Six-element Automatic Weather Station
| Value | Sensor | Resolution | Range | Precision |
|---|---|---|---|---|
| August Temperature | HMP155(A) | 0.01°C | −50°C∼+60°C | ±0.1°C |
| Relative Humidity | HMP155(A) | 0.1% | 0∼100% | ±2% |
| Pressure | EL15–1A | 0.1 hPa | 500∼1100 hPa | ±0.2 hPa |
| Wind Speed | EL15–2D | 0.1 m s−1 | 0∼75 m s−1 | ±0.3 m s−1 |
| Wind Direction | PTB210 | 3° | 0∼360° | ±5° |
We found the sampling frequencies of the raw data can be unstable due to the setting not being fixed after a power interruption. Following an agreement on the appropriate sampling interval of 10 minutes, we have re-sampled the original data from each site uniformly to produce median values. All data and inferences are based on these re-sampled data. We note that randomly missing data or data sampling rate instability has less impact on the statistics, but the loss of data from multiple days might result in deviation from annual trends and overall statistical results.
Meteorological data for the Ali site are from the Point A1 WS. Data of the Point B4 WS are used for the days without A1 data. The data from the Ali Point A1 and B4 WSs are shown in Figure 3(a). A total of 675 days of data was collected from 2017 March 10 to 2019 March 10. The main reason for lost data is power failures.

Fig. 3 The statistical data of Ali A1 and B4 WSs, whose measurements are recorded every ten minutes and can give a maximum of 6×24 = 144 measurements per day. The statistical data for the Daocheng (Point 2) WS, whose measurements are collected from 6:00 PM to 8:00 AM every ten minutes, yield a maximum of 6×13 = 78 measurements per day. The statistical data of Muztagh-ata WS, whose measurements are acquired every ten minutes, produce a maximum of 6×24 = 144 measurements per day.
Download figure:
Standard imageMeteorological data for the Daocheng site are from the Point 2 WS, covering from 6:00 PM to 8:00 AM (all times are Beijing time), which results in a little difference between 24-hour and nighttime statistics. After more than a year of operation, these WSs were moved to Point 1 at April 2018. A total of 559 days of data was collected from 2017 March 10 to 2019 March 10, as displayed in Figure 3(b). The main reason for the loss of data is power failures.
Meteorological monitoring of Muztagh-ata started 2017 March 10, however, initial observations were made with a protective plastic cover in place which does not give useful readings. Relative humidity data before 2017 August 3 were removed. After analysis of the wind direction data, the Muztagh-ata operation team found the output of the wind direction sensor was fixed at 0. After several failed repairs, the wind direction data were accepted from the backup CAWS-600 automatic WS, about 10 m away with the same sensors. The statistics of the Muztagh-ata meteorological data are featured in Figure 3(c). A total of 675 d of data was collected from 2017 March 10 to 2019 March 10. The reasons for lost data are power failures, installation problems and sensor failure.
2.2. Precipitable Water Vapor Data
A Low Humidity and Temperature Profiling microwave radiometer (LHATPRO), manufactured by Radiometer Physics GmbH (RPG) in Germany, was employed to take measurements of PWV at the three candidate sites. The instrument was deployed at the Ali site from 2018 March 19 to 2018 March 22, at the Daocheng site from 2018 February 10 to 2018 March 5 and at the Muztagh-ata site from 2018 January 22 to 2018 February 4. Since the instrument requires professional engineers to maintain it and it consumes liquid nitrogen, the number of days with observation data at each site is limited. Based on the operation journal and astronomical twilight, we divided data from the whole day (24 hours) into "night" and "clear night" for detailed analysis.
3. Differential Image Motion Monitor Data
A DIMM is an instrument generally utilized for measuring seeing in an astronomical observatory, which was firstly proposed by Sarazin & Roddier (1990). Three types of DIMMs are used in this work, which were developed independently by ALCOR-SYSTEM5 (French DIMM for short), Nanjing Institute of Astronomical Optics & Technology, Chinese Academy of Sciences6, (NIAOT DIMM for short) and the Ali operation team from National Astronomical Observatories, Chinese Academy of Sciences (NAOC)7 (Ali DIMM for short). The parameters of DIMMs are listed in Table 2 and briefly described below.
Table 2. Parameters Referred to in This Work on DIMMs
| Parameters | French DIMM | NIAOT DIMM | Ali DIMM |
|---|---|---|---|
| Focal Length (mm) | 2400 | 1600 | 2500 |
| Focal Ratio | 8 | 8 | 10 |
| Subaperture Number | 2 | 2 | 2 |
| Subaperture Diameters (mm) | 51 | 50 | 50 |
| Subaperture Distance (mm) | 240 | 149 | 200 |
| Wedge angle (arcsec) | Variable | 50 | 60 |
| Pixel Size (μm) | 5.86 | 5.5 | 7.4 |
| Exposure Time (ms) | Dynamic | 5 and 10 | 10 |
| Center Wavelength (nm) | 550 | 500 | 500 |
| Sites Equipped | Ali, Daocheng and Muztagh-ata | Daocheng and Muztagh-ata | Ali |
The ALCOR-SYSTEM is a French company focusing on the instruments and software in the field of astronomy8. The DIMMs produced by ALCOR-SYSTEM are the standard instruments for the site testing projects. The main components of their DIMMs are from reliable manufacturers, and the integration and software were finished by ALCOR-SYSTEM.
The NIAOT-DIMM is low-temperature enhanced, designed for acquiring seeing measurements in Antarctica. The DIMM was deployed at the Antarctic Kunlun Station in 2011 and an enhanced model was set up at the Antarctic Taishan Station in 20149.
The Ali DIMMs were developed for site testing in western China, and have been operated at the Ali site for many years. The same type of DIMM was utilized for collecting seeing measurements at the LAMOST site (Liu et al. 2010).
The parameters of the DIMMS referred to in this work are listed below.
Each site hosted two or three DIMMs, one for continuous measurement, and the others acting as backup. An extra French DIMM was utilized for cross calibration between sites to ensure the seeing data are accurate and comparable. A consistency test between French DIMMs was conducted at the Xinglong Observatory by Wang et al. (2020), and the average difference in the measurements is 0.075 arcsec. The French and NIAOT DIMM consistency test was conducted at the top of an 11 m tower at the Muztagh-ata site by Xu et al. (2020b), and the median value of the French DIMM is a little higher than that of the NIAOT DIMM by 0.01 arcsec, approximately within the measurement error. The French and Ali DIMM consistency test was conducted at the Ali site by y Liu et al. (2020), and the median value of French DIMM is lower than the Ali DIMM by 0.06 arcsec. The operation height of DIMM is important to avoid near-ground turbulence, which has been tested independently by the operation teams at Muztagh-ata and Ali. From 2017 June 23 to 2017 November 14, Xu et al. (2020b) deployed the NIAOT DIMM on the ground with the French DIMM on the 11 m tower at the Muztagh-ata site. The median value from the NIAOT DIMM was 0.97 arcsec and that from the French DIMM was 0.79 arcsec from the 11 m tower. Then, the NIAOT DIMM was moved to the top of the 6 m tower and stayed there from 2017 November 15 to 2018 September 20. The median values at 6 m and 11 m were both found to be 0.87 arcsec. Similar to Muztagh-ata, two DIMMs were installed at the 5 m and 11 m towers by Liu et al. (2020) at the Ali site. The median, 25% and 75% values of the DIMMs, for comparison, are summarized in Table 2, indicating that the measurements are the same. The tests indicate that the operating height is important to avoid near-ground turbulence, and the altitude of the near-ground turbulence is below 6 m at the Muztagh-ata and Ali sites.
DIMM operation is susceptible to environmental elements, e.g., wind speed and temperature. Higher wind speeds can cause vibrations in the DIMM tube and its tower, which could result in larger seeing measurements. In principle, a DIMM is unaffected by vibration. However, there are quite a few practical limitations that keep a DIMM from the ideal situation. During the exposure time, high-frequency vibration would reduce the images' signal-to-noise ratio (SNR) and enlarge the error of stars' barycenter measurement. Besides, vibration may affect the optical stability, leading to an increase in the measured seeing. The DIMM tube vibration is easily detected and can be solved by adding a wind shield. Tower vibrations are more difficult to detect, and installing improvements in the tower requires more effort, sometimes even reconstruction. There is a rough seeing comparison of the impact of tower vibrations caused by wind in Figure 4. The left-hand side of the figure is a histogram of the seeing measured by the French DIMM from 2017 June 23 to 2018 October 8 on top of the Muztagh-ata 11 m tower. The right-hand side of the figure is the histogram of seeing measured by the same DIMM at the same place from 2017 October 8 to 2018 March 10 after the tower was reinforced on 2018 October 8. We can roughly estimate from the histograms that the reinforcement of the tower has a positive impact on the improvement of the seeing measurement. More detailed analysis about the relationship between the seeing and wind speed of prevailing wind direction in Muztagh-ata was finished by Xu et al. (2020b). He found the median seeing value manifests an initial drop until the wind speed reaches 3 m s–1, then keeps growing. Xu suggests that the reason for this phenomenon could be stable ground turbulence occurring at a specific wind speed. Another possibility is that the breeze accelerates the heat balance of the tube and tower cooling. Comparison between the DIMMs is shown in Table 3.

Fig. 4 A seeing comparison illustrating the impact of tower vibrations caused by wind. The left panel is seeing measured on top of the Muztagh-ata 11 m tower prior to reinforcement. The right panel is measured after the tower was reinforced.
Download figure:
Standard imageTable 3. Difference in Medians of French, NIAOT and Ali DIMMs at Different Positions
| Equipments | Sites | Period | Difference of medians |
|---|---|---|---|
| Difference of French DIMMs | Xinglong | 2017 March 3 – 2017 March 12 | 0.075 arcsec |
| NIAOT–French | Muztagh-ata | 2017 April 3 – 2017 April 12 | 0.04 arcsec |
| NIAOT–Ali | Ali | 2017 April 26 – 2017 May 20 | 0.06 arcsec |
| French@11 m–NIAOT@Ground | Muztagh-ata | 2017 June 23 – 2017 November 14 | 0.18 arcsec |
| French@11 m–NIAOT@6 m | Muztagh-ata | 2017 November 15 – 2017 September 14 | 0.0 arcsec |
| French@11 m–NIAOT@11 m | Muztagh-ata | 2017 September 21 – 2017 November 20 | 0.01 arcsec |
The formation of a temperature inversion layer can be an important meteorological phenomenon that is beneficial to seeing. Under normal circumstances, the atmospheric temperature decreases with the increase of altitude. However, under certain weather conditions, the atmospheric structure above the ground will experience an abnormal phenomenon such that the temperature rises with the increase of altitude, which is called a temperature inversion. Approximately one month after the establishment of the high-precision micro-temperature tower (Hu et al. 2019), it was confirmed that temperature inversion occurs at Muztagh-ata. The temperature gradient is more obvious below 6 m (Hu et al. 2014). Thus in Figure 5, we use the measurements at 2 m and 6 m and can see that 80.6% of the time there is a temperature inversion layer with an average of 0.35°C and that the temperature gradient is about 0.08°C m. For formation of the inversion layer, we assume that the Muztagh Ata site is located in the eastern Pamirs which is a series of high peaks including Kongur Tagh (7719 m), Kongur Tiube (7555 m) and Muztagh-ata (7546 m). The local geography results in cold air at night not passing over an upper layer of hot airflow. The "inversion layer" can make the atmosphere stable, reducing turbulence in the atmosphere and effectively ensuring enhanced seeing, which is confirmed by Figure 6. The seeing was measured by the French DIMM on the ground, and the micro-temperature tower is not far from the DIMM. So far, in western China, this phenomenon has only been found at the Muztagh-ata site and so is appropriate for more detailed analysis in Xu et al. (2020b).

Fig. 5 The histogram of temperature difference at 6 m and 2 m (T6m–T2m) at Muztagh-ata from 2017 May 7 to 2017 June 4.
Download figure:
Standard image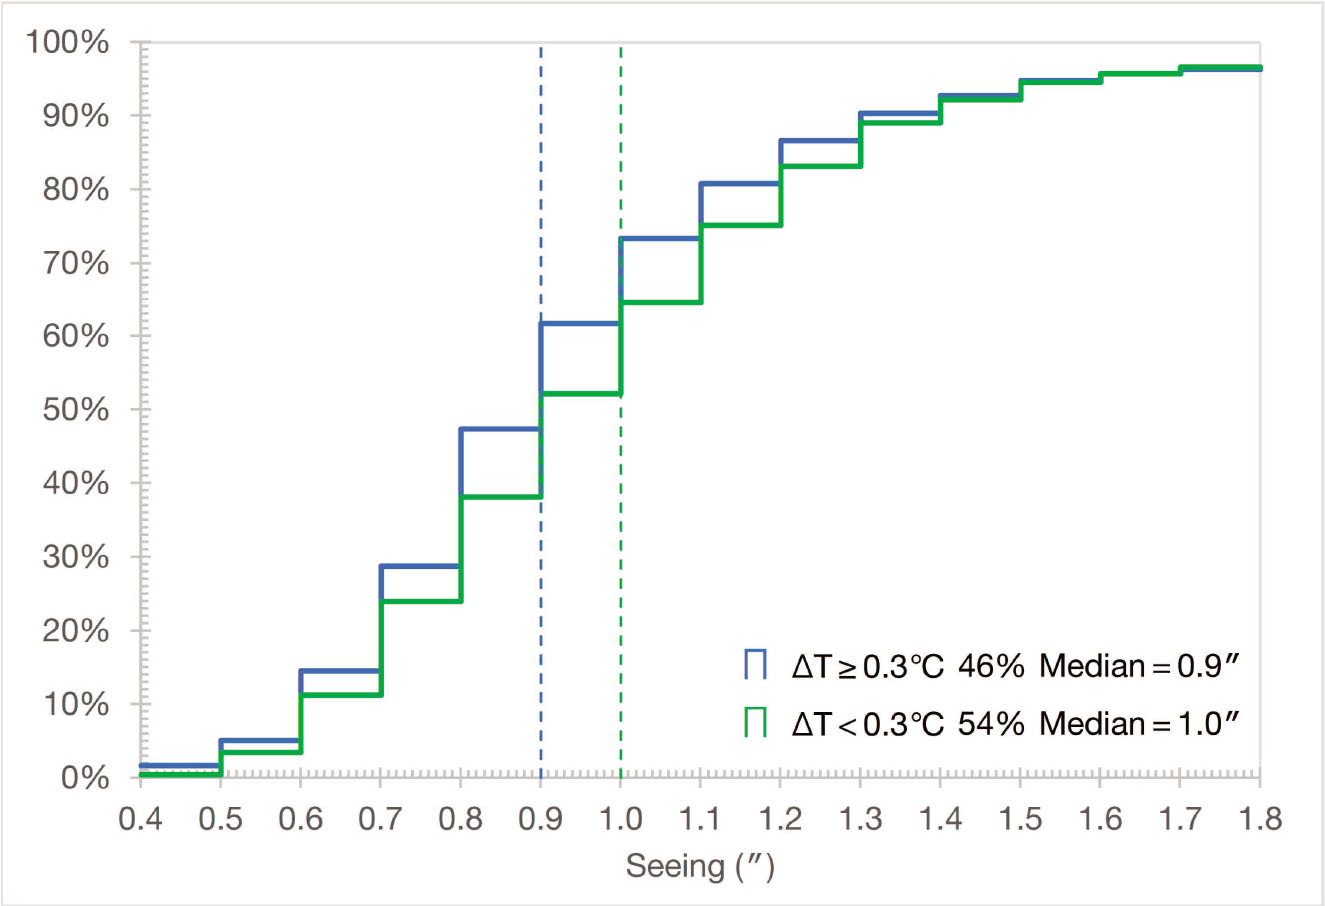
Fig. 6 The relationship between temperature and seeing measured at Muztagh-ata from 2017 May 7 to 2017 June 4. Different colors represent different growth curves corresponding to the T6m–T2m range and the curves were cut off at 1.8 arcsec seeing; 46% of seeing was measured during the period of T6m–T2m≥0.3°C and 54% during the period of T6m–T2m < 0.3°C. In order to divide seeing data into two equal-size datasets, we selected 0.3°C due to it being close to the mid-frequency point in Fig. 5. The seeing measurements were from the French DIMM deployed on the ground.
Download figure:
Standard imageTemperature also has some negative effects on the measurement of seeing. Sunlight increases the temperature of the DIMM instrument and its tower in the daytime, then, the rapid drop in ambient temperature after sunset may cause turbulence inside the DIMM tube and local turbulence due to the exothermic heat of the tower, which results in an apparent increase in the seeing. Proper daytime Sun protection for DIMMs and the addition of insulation to the tower can significantly improve this situation. When the sites were being developed, the DIMMs were moved from the ground to the tower and measurements were improved, thus overall reported values slightly underestimate the site performance. A schedule for DIMM improvement has been planned by Ali and Muztagh-ata operation teams and is expected to be completed by 2020, including updated software to improve the operation stability and the concrete column of the tower wrapped with thermal insulation material to reduce heat dissipation.
The seeing data at the Ali site are mainly based on results measured by the Ali DIMM at the top of the 11 m tower. Due to poor initial tower strength, the DIMM vibrated slightly with wind speed, causing measured values to be increased by roughly 0.2''. After a few months, the Ali team reinforced the tower to reduce the negative effects on seeing. Meanwhile, another Ali DIMM monitored on the 3 m high roof of the observation building. We combined data sets from these two instruments, and the combined raw data include a total of 457 days from 2017 March 10 to 2019 March 10.
The Daocheng site DIMM was on a 7.5 m observation platform at Point 2 and was moved to a similar Point 1 after April 2018. The Daocheng seeing measurement is mainly based on the NIAOT DIMM, and the data from the French DIMM were used when NIAOT DIMM data were not available. There is a total of 357 d of combined raw seeing data from 2017 March 10 to 2019 March 10.
The working conditions at the Muztagh-ata site DIMMs from 2017 March 12 to 2019 March 10 are summarized in Table 4. The French DIMM is the main data source for the seeing and the data from the NIAOT DIMM were used when French DIMM data were not available. There is a total of 389 d of combined raw seeing data from 2017 March 10 to 2019 March 10.
Table 4. French DIMM and NIAOT DIMM Working Conditions at Muztagh-ata Site
| Start | End | Conditions |
|---|---|---|
| 2017 April 15 | 2017 June 22 | French DIMM on the ground. |
| 2017 June 23 | 2017 October 7 | French DIMM on the 11 m tower unreinforced |
| 2017 October 8 | 2019 March 10 | French DIMM on the 11 m tower reinforced |
| 2017 March 12 | 2017 November 14 | NIAOT DIMM on the ground |
| 2017 November 15 | 2018 September 20 | NIAOT DIMM on the 6 m tower |
| 2018 September 21 | 2019 March 10 | NIAOT DIMM on the 11 m tower |
We calculated the average sample rate of each DIMM, and found the French DIMM is much higher than other DIMM measurements with a frequency of 1 time per minute. For consistency of DIMM data, we resampled the French DIMM to compute a median before merging data from the different DIMMs at each site. For continuous seeing data, we removed data with frequency lower than 20 times per day or 2 hours per day on the basis that this indicates underlying instrument issues, usually due to power. The intermediate data statistics after each step are shown in Table 5, and the comparison of histograms before and after data processing are displayed in Figure 7. It should noted that the data "<20 times per day" and "< 2 hours per day" at each site overlap with each other and that given the relatively minor offsets found between DIMMs summarized in Table 3, we do not apply any corrections to the reported DIMM measurements.

Fig. 7 The histograms of seeing before processing (left column) and after processing (right column) for Ali (top row), Daocheng (middle row) and Muztagh-ata (bottom row).
Download figure:
Standard imageTable 5. Steps in Processing the DIMM Data from 2017 March 12 to 2019 March 12
| Steps | Ali | Daocheng | Muztagh-ata |
|---|---|---|---|
| Original data | 178 406 (457 d) | 290 400 (357 d) | 454 877 (389 d) |
| After resampling | 178 406 (457 d) | 114 316 (357 d) | 117 155 (389 d) |
| <20 times per day | 156 (18 d) | 165 (14 d) | 73 (8 d) |
| <2 hours per day | 1330 (36 d) | 1113 (31 d) | 1981 (38 d) |
| Processed data | 177 013 (416 d) | 113 168 (324 d) | 115 161 (350 d) |
4. Sky Background Meters and All-sky Camera Data
4.1. Sky Background Meter Data
The SBM manufactured by Unihedron10 was deployed at each site for the measurement of night sky background with the unit of magnitudes per square arcsecond (mag arcsec–2). The factory nominal accuracy of this device is ±0.1 mag arcsec–2 within the visible band. The full width at half maximum (FWHM) of SBMs' field of view (FOV11) is about 10°. Before the deployment, three SBMs were tested are Xinglong Observatory from 2018 February 12 to 2018 February 12 by Wang et al. (2020). All test measurement differences are within 0.1 mag arcsec–1, and the absolute values of difference median are within 0.02 mag arcsec–2. A total of 351, 344 and 342 days of data was collected from 2017 March 10 to 2019 March 10 at the Ali, Daocheng and Muztagh-ata sites respectively. The periodic trends in the original data indicate the impact of moonlight and clouds. Since we point the SBM at the local zenith, the measurements are susceptible to Moon altitude, Moon phase, Moon azimuth and the Milky Way. In order to avoid these effects, we removed the data when the Moon was more than 6° above the horizon. Clouds might also dim the sky background to some extent. Therefore, we cross-matched the SBM and ASCA data and removed data classified as "covered" and "inner." Figure 8 depicts the differences between each step. The right-hand side of the histograms is for sky without moonlight and cloud interference.

Fig. 8 The histograms compare original data, without Moon and without Moon+clouds for Ali, Daocheng and Muztagh-ata in the top, middle, and bottom rows respectively.
Download figure:
Standard image4.2. All-sky Camera Data
In order to detect local clouds, each site is equipped with the same model of ASCA developed by Wang et al. (2020). The ASCA is a fisheye lens consisting of a Canon Digital Single Lens Reflex Camera with 3456 × 5184 pixels. The camera captures images with different exposure times based on altitude of the Sun and the Moon phase. After the hardware was updated, the exposure time was controlled by a new micro-controller referenced to the night sky background measured by the local SBM.
We processed ASCA images following the Skidmore et al. (2008) methodology. Images are divided into inner and outer circles with zenith angles of 44.7° and 65° respectively, and each circle was marked by the bright stars. According to the distribution and thickness of the cloud on the image, cloud cover is determined as "clear," "outer," "inner," "covered" and "none." The definition of the classification is provided in Table 6, and typical images are displayed in Figure 3. The interval of the images is about 5 min. We interpreted images into cloud-cover time slices and accumulated them during the night constrained by astronomical twilight. We note that Skidmore (2011) utilizes a "Moon up" classification for images that might have interference from moonlight, but we treated the images with the Moon as usual, because we do not want to lose the information from cloud-cover affected by the moonlight. The "none" classification we defined is equivalent to the questionable classification defined by Skidmore (2011). The images with "none" are excluded from the final result.
Table 6. The Definition of Cloud Cover
| Class | Description |
|---|---|
| Clear | No cloud within the inner circle. Fig. 3(a) |
| Outer | No cloud within the inner circle, has cloud within the outer circle. Fig. 3(b) |
| Inner | No more than 50% cloud within both the inner and outer circles. Fig. 3(c) |
| Covered | Coverage of clouds within inner+outer circles is over 50%. Fig. 3(d) |
| None | Hard to determine cloudiness due to underexposure, dew, etc. |
Figure 10 shows our webpage of ASCA cloudiness interpretation to improve efficiency, facilitate collaboration within the team and control the quality of image interpretation. Once ASCA image data are transmitted from each candidate site to our servers, original images are stored uniformly into the database.

Fig. 9 Example ASCA images representing "clear" (a), "outer" (b), "inner" (c) and "covered" (d).
Download figure:
Standard image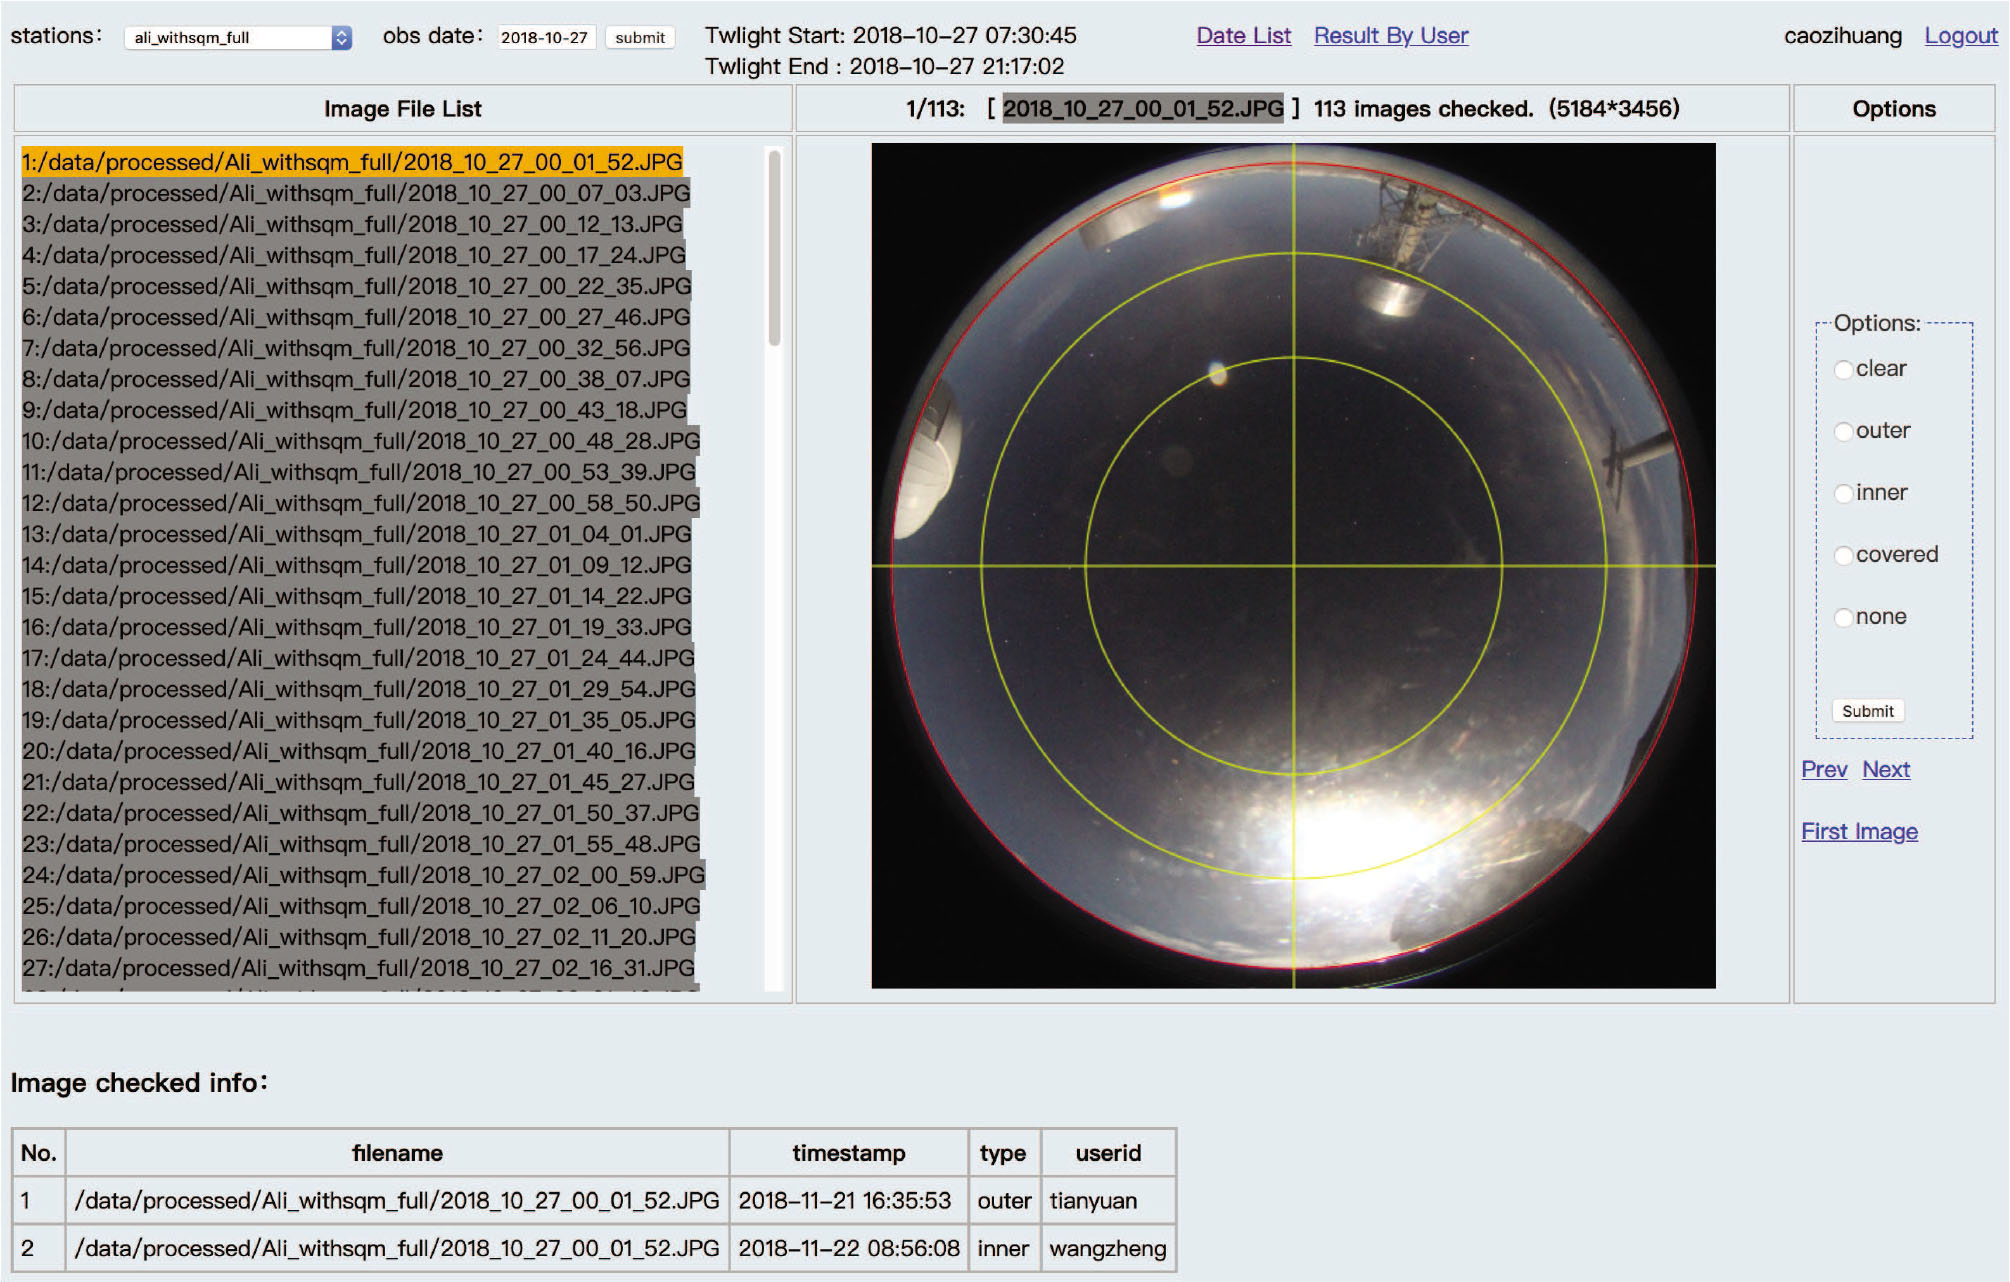
Fig. 10 ASCA image processing webpage with the image classification log at the bottom of the webpage, in which moonlight causes a difference in cloud interpretation.
Download figure:
Standard imageOur webpage presents auto-scaled images and provides for further image enhancement but is not reliable in complex conditions, e.g., Moon, thin clouds and glare caused bias. Personnel were trained before engaging in data classification in order to try to produce uniform manual treatment. In order to verify the precision and stability of image classification, an independent team processed ASCA images obtained from 2017 January 27 to 2017 March 26 at the Daocheng site in the same way. The comparison dataset includes 58 nights, and the comparison result is provided in Table 7. The results of the two groups are generally close, especially for the classification of "covered." It demonstrates that "covered" is mostly obvious and can be easily be recognized. The situation for clear nights is also relatively straightforward with good agreement. For "clear," in the case of proper exposure time and no clouds, the classification is mainly based on a uniform skylight background and a bright foreground star. The discrepancy between the groups appeared to arise from the cases with dust, dew and frost. This causes uneven background and star bloom, which is associated with cloudy conditions. Also, in some time periods, there are fewer bright stars in the sky, or the exposure time is short, which makes people mistakenly think that there are thin clouds. Therefore, the judgment of "clear" is still dependent on human experience, especially in one case when the exposure time was not provided by the teams. The interpretation of "inner" and "outer" depends on the determination of the edge of the cloud and is less consistent between the teams. As Figure 11 shows, "inner" is more complex than "outer" for including two different cloud distributions. For cases with a clear moonless night, the dark background and the presence of bright background stars make a good reference, and it is easy to distinguish between the interpretation of "inner" and "outer." For data with moonlight, glare between the inside of the lens or the lens and the acrylic cover outside can easily cause people to misinterpret "outer" or "clear" as "inner," or the opposite case. By comprehensively interpreting multiple images, we can analyze the movement of clouds and movement of the glare with the Moon, which can reduce the misjudgment of "inner" to some extent, but discrepancies between the teams exist and further work is necessary. The example of outliers mentioned above is depicted in Figure 12.

Fig. 11 Example images of "inner" mixed with a bit of clouds in a 44.7° circle (left) and full of thin clouds in the field of view (right).
Download figure:
Standard image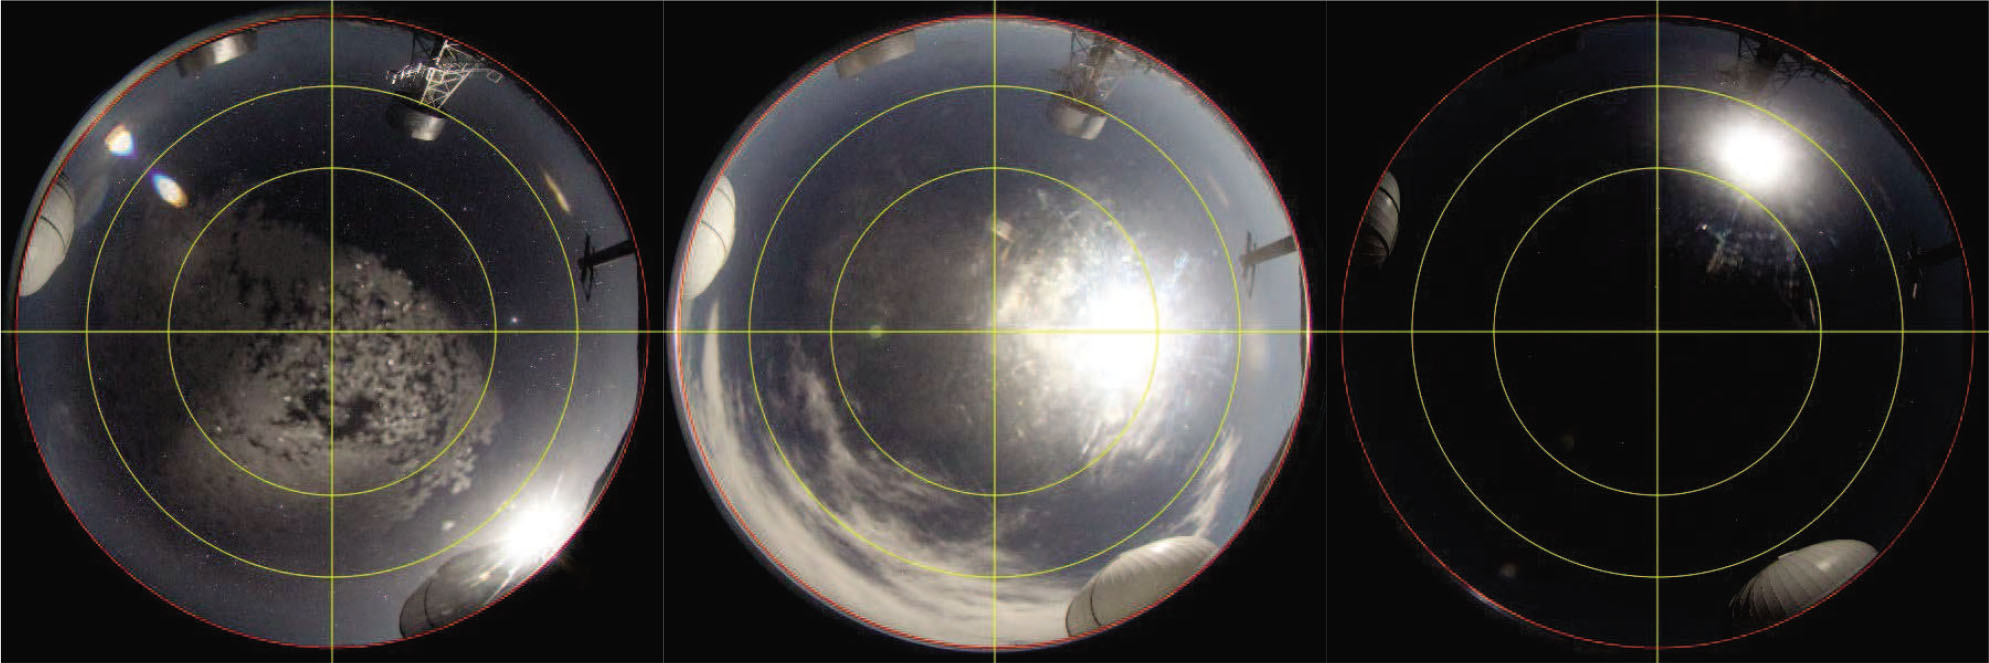
Fig. 12 Images with frost (left), glare (middle) and underexposure (right). Condensation and frosting in moonless nights are more difficult to judge than what is shown in this figure. When the Moon's altitude is high, glare on the acrylic cover and lens is very close to the cloud. The ASCA exposure time is controlled by the SBM measurement results, so the Moon near the north pole could result in underexposure.
Download figure:
Standard imageTable 7. Comparison of the results obtained by interpretation of the Daocheng ASCA data by different teams from 2017 January 27 to 2017 March 26.
| Class | Other team | Our team |
|---|---|---|
| Clear | 65.34% | 67.85% |
| Outer | 2.28% | 4.2% |
| Inner | 9.67% | 5.28% |
| Covered | 22.5% | 22.66% |
| None | 0.21% | 0.01% |
The distributions of night cloud cover at Ali, Daocheng and Muztagh-ata are shown in Figure 13(a), Figure 13(b) and Figure 13(c) respectively. Figure 14(a), Figure 14(b) and Figure 14(c) are Ali, Daocheng and Muztagh Ata normalized night cloud cover at nighttime. Table 8 is the three sites' night cloud cover statistical data derived from ASCA from 2017 March 10 to 2019 March 10.

Fig. 13 The distribution of cloud cover obtained from ASCA in Ali, Daocheng and Muztagh-ata from 2017 March 10 to 2019 March 10.
Download figure:
Standard image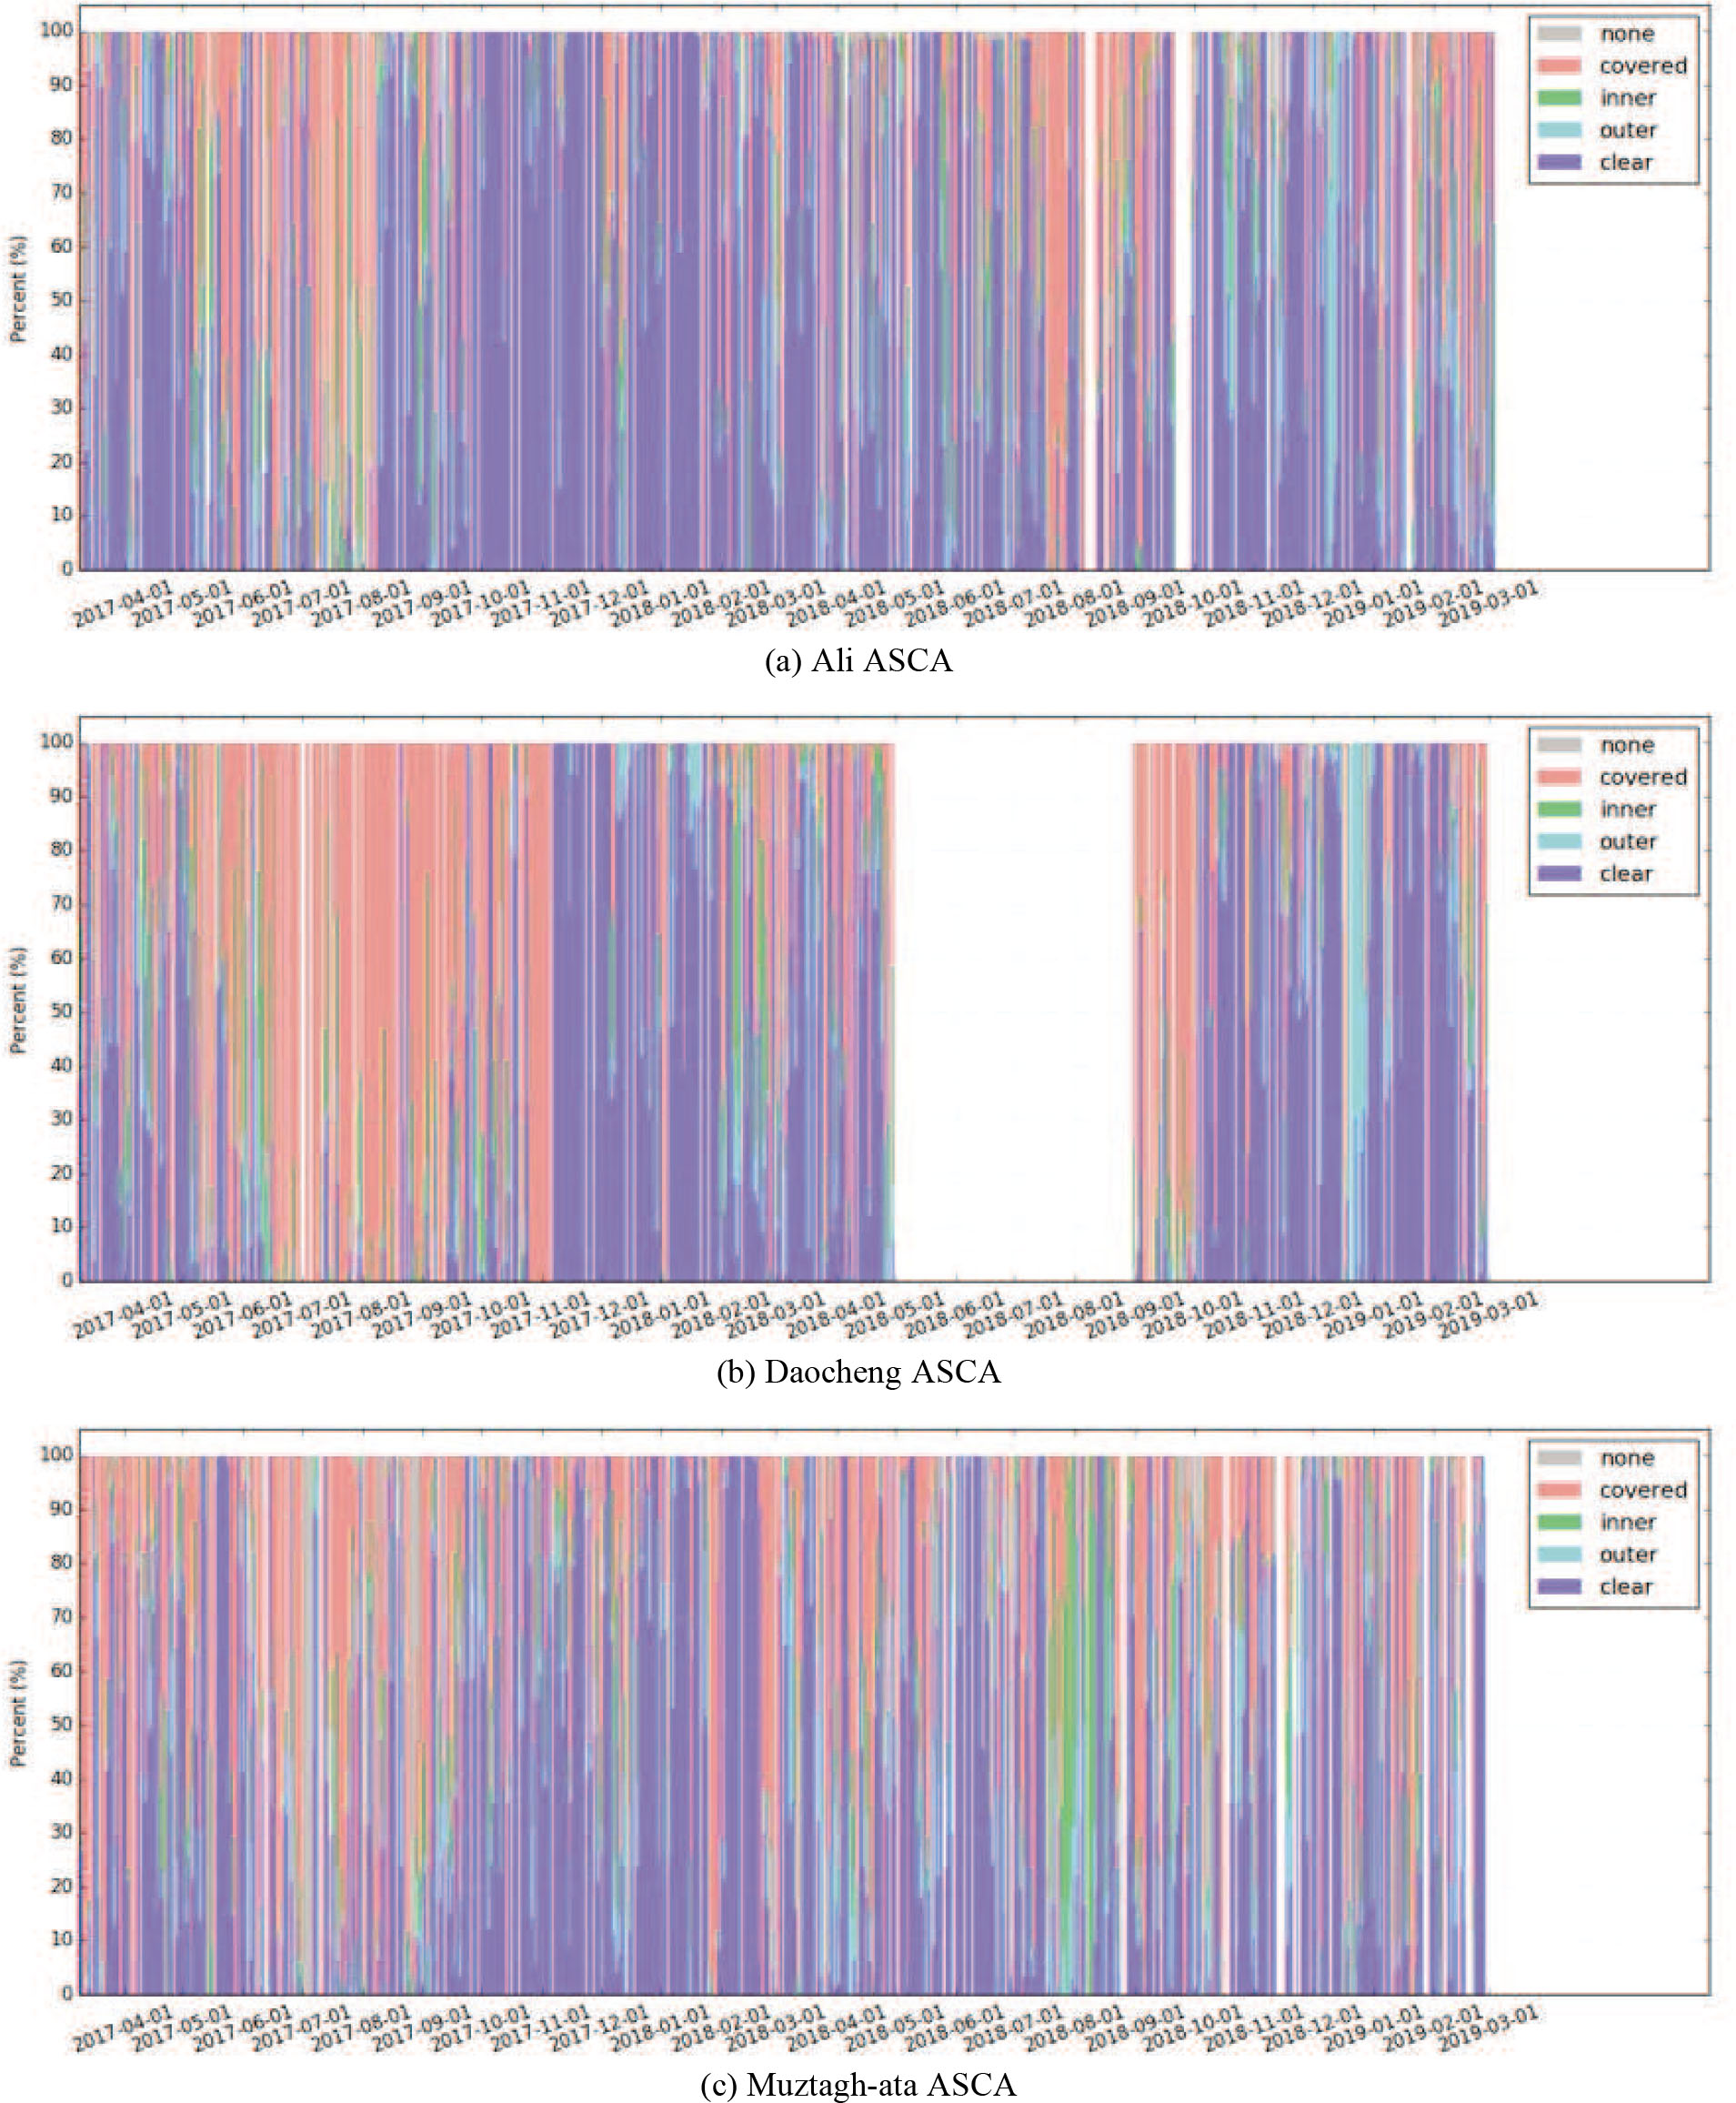
Fig. 14 The distribution of normalized cloud cover obtained from ASCA in Ali, Daocheng and Muztagh-ata from 2017 March 10 to 2019 March 10.
Download figure:
Standard imageTable 8. Statistical Data on Night Cloud Cover from 2017 March 10 to 2019 March 10 in Ali, Daocheng and Muztagh-ata
| Site | Processed | Clear | Clear+Outer | Clear+Outer | Clear+Outer | Clear+Outer |
|---|---|---|---|---|---|---|
| Images | +Inner | >3 hrs | +Inner>3 hrs | |||
| Ali | 92.7% | 65.0% | 70.8% | 79.4% | 71.9% | 82.1% |
| Daocheng | 81.8% | 52.5% | 58.2% | 66.3% | 60% | 68.0% |
| Muztagh-ata | 90.1% | 53.7% | 61.6% | 70.6% | 63.1% | 73.1% |
5. Data Management and Quality Control
The Ali site has existed for many years and has relatively good hardware infrastructure. Daocheng was originally a candidate site for solar telescopes and it began to accumulate data such as nighttime meteorology and seeing from 2015. Muztagh Ata is a new site and required setting up related hardware at the end of 2016. Therefore, the infrastructure at each site is different, which can impact the data directly. For example, the power supply critically impacts the acquisition of observational data, and the communication situation affects the transmission of observation data. Except for the DIMMs, each site is equipped with the same type of measuring instruments, and Ali and Daocheng's original observation equipment is used as backup. The teams at each site are responsible for installation, commissioning, operation of the equipment and quality of raw data. The raw data were transmitted to NAOC and processed on a daily basis. The daily report is generated and sent to some astronomers, then the data quality is fed back to each site's maintenance team to improve the data production. This procedure sometimes improved the original data quality, e.g. improving the DIMM measurement software from the manufacturer and changing the DIMM running parameters.
5.1. Transmission, Initial Processing and Backup
Data transmitted daily include WS data, SBM data DIMM data and ASCA images. Each of the sites transmits nearly four gigabytes of data through various methods. The transmission was affected by local meteorological, communication, traffic and other conditions, and often not carried out reliably, e.g., due to power and communication failures. The data transmission, timely archiving and appropriate initial processing of these important data were challenging. The quantity and quality of the site data can directly reflect the installation, operation and maintenance of the relevant hardware, and so information must be fed back to the relevant person in charge of each site in a timely manner so that each site can quickly adjust the hardware parameters and improve the operation and maintenance.
Disaster recovery of precious site data is also one of our primary concerns. We need to apply mature technologies and establish a reliable and effective data backup system. It is often necessary to accumulate data for a certain period of time before proceeding to the next step. Further processing of the data involves site data of different types and time spans. In order to facilitate the management and utilize the data, we abstracted the original and derived site data into six levels. Then, we stored and managed the data in a layered manner. The higher the level was, the higher the degree of processing reached in Table 9.
Table 9. Data Level Identification
| Level | At each site: Each Identification | Production modes and significance of data at all levels |
|---|---|---|
| 0 | L0 | Raw data uploaded by sites. |
| 1 | L1 | L0 data are saved into the database upon data formatting or |
| parsed to form L1 data. | ||
| 2 | L2 | Normalize data format and add observational days, L1 data are |
| generated into L2 data with simple merger application. | ||
| 3 | L3 | L2 data are generated into L3 data upon changing the original time |
| scales (from minute to day, month and year), then cross-matching | ||
| different data sources (including weather, seeing, etc.). | ||
| 4 | L4 | Charts and statistics. |
| 5 | L5 | Reports. |
Based on hierarchical data management, we have established a standardized data processing method. Operation and maintenance teams from each of the three sites are in charge of equipment operation and data acquisition, including site transmissions of daily data (L0) to our server; those data are decoded and saved into the database (L1) upon parsing; after normalizing the data format, adding observational days and processing a simple data merger, data are generated into L2 data; and then, some of the L2 data (including weather and seeing) are processed into various charts (L4), which are issued in the form of a daily report (L5) with the purpose of ensuring the ongoing operation of each site and checking its data quality. If abnormal data are found, feedback will be sent to the site as soon as possible. Data from the three sites are also treated and analyzed on a regular basis (L3) to generate statistical results (L4), charts (L4) and relevant results of various reports (L5). The whole process of data transmission and initial data treatment at each site is illustrated in Figure 15.
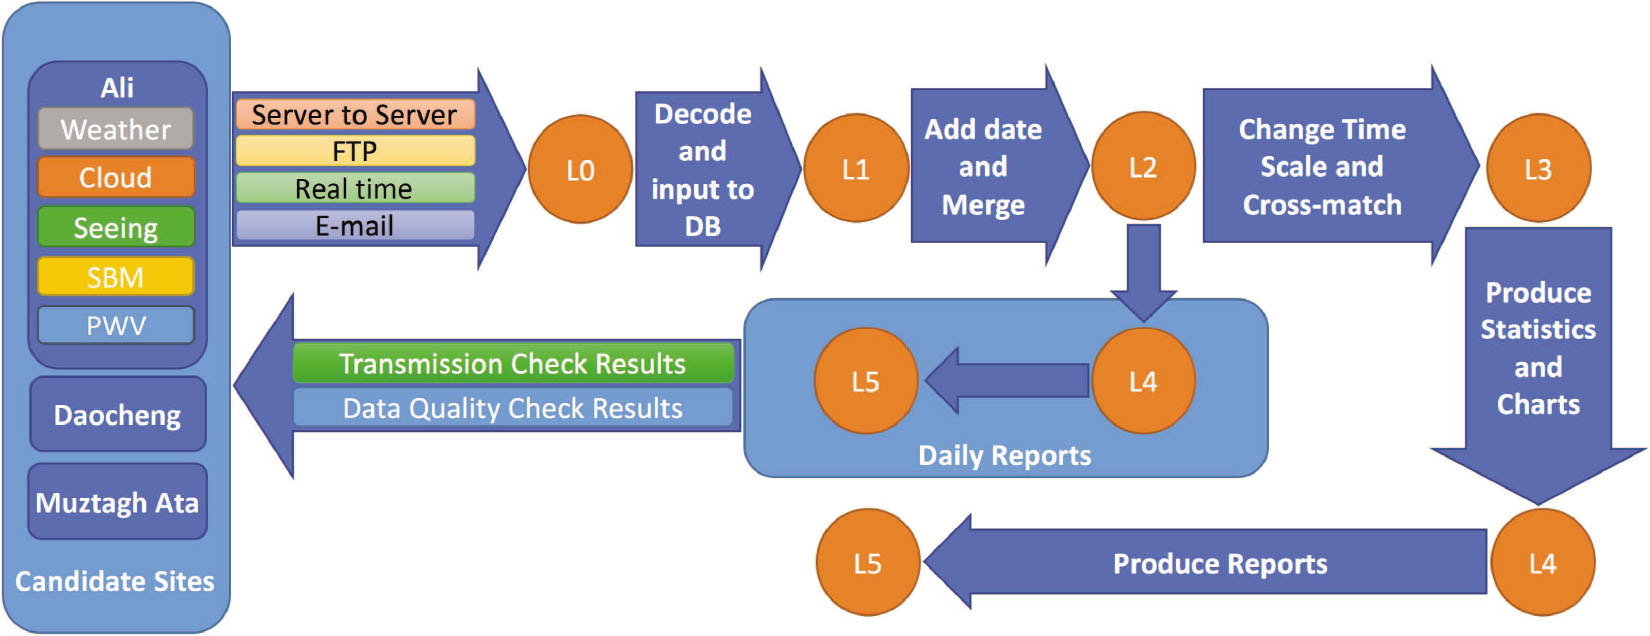
Fig. 15 The schematic diagram for data processing from transmission and initial data at each site.
Download figure:
Standard imageDue to the communication conditions and hardware restrictions, the data transmission methods of the three sites vary. (1) Real time data are transmitted to our servers via communication modules with related equipment on site, e.g. Muztagh-ata WS. (2) TCP protocols are utilized to synchronize data from site servers to our servers, e.g., all Ali data. (3) FTP protocol is implemented to manually upload data to our servers, e.g., Muztagh-ata and Daocheng ASCA images. (4) Data can also be sent by email manually, e.g., data synchronization following a network failure.
Subsequently, the original data were transmitted to our servers. Depending on the device and the mode of transmission, the raw data (L0) may use various formats such as CSV, TXT as well as XLS so a set of scripts has been compiled to decode and process various kinds of files in order that the data can be uniformly saved in the MySQL database (L1). EXIF information is extracted from image data (L0) of ASCA, which will be saved into the database (L1) together with file information (L1). In order to save original images, ASCA TIF/RAW files from the three sites are converted into PNG format with a unified image resolution.
In order to find problems in a timely manner and feedback to the teams at each site, data are checked daily. The inspection of data is divided into two aspects: transmission checks and data quality checks. The transmission check is to make sure the daily data are transmitted at each site. We have a webpage to interactively check data quantity and generate a data exchange daily report. Raw data quality checks and further data analysis are based on data visualization. Hence, three types of reports are generated, daily report of meteorological statistics, a technological report on a certain topic, e.g., DIMM comparison, and summary report describing all data inferred from the site testing. As Figure 16 demonstrates, a website has been developed for information inquiry and report download.

Fig. 16 A screen capture of the home page of the distribution and data quality webpage.
Download figure:
Standard imageIn terms of the daily report, only meteorological and seeing scatter diagrams of each site are plotted. Figure 17 is an example of the daily report on 2018 March 19 at the Ali site. The technological report is only concerned about one instrument in a short period for a specific engineering or scientific propose. The time span of the summary report generally ranges from several months to several years and addresses all instruments involved. The data are presented in the summary report in a variety of ways, including scatter diagrams, histograms, compressed monthly statistical charts and rose diagrams.

Fig. 17 An example of a daily report including, from top to bottom, plots of temperature, humidity, pressure, wind speed and seeing with different DIMMs.
Download figure:
Standard imageThe cloud platform of the China Virtual Observatory (Cui et al. 2015) has been adopted to back up raw data (L0) from each site, intermediate results (L1, L2, L3) and products (L4, L5). Specifically, data receiving and treating systems are deployed by cloud computing nodes; structured data are saved in the (RDS), while unstructured data are stored in the network-attached storage. Incremental backup data are pushed actively from the server to the online storage configured in NAOC's underground server room every half month. At the same time, an audit report will be automatically generated in the system and manually reviewed upon the increment of data backup each time.
6. Correlation and Consistency of the ASCA and Satellite Data
Correlation and consistency of clouds inferred from ASCA are close to the view of a potential telescope, but due to the recent installation, the time span of the available data is short. Meteorological satellites could potentially give useful long-time span data for study of site cloud cover, and satellite data are essential for site testing research (e.g., Cao et al. 2020). The cloud condition from ASCA and the physical cloud cover measured by ASCA and satellite will be different (Schöck et al. 2009).
From a physical definition, cloud covers as measured by ASCA and a satellite are different. Clouds are generally encountered over a range of altitudes varying from sea level to the top of the troposphere and can be vertically divided into three levels12 by the cloud altitude. The levels overlap and their limits vary with latitude. The camera points to the zenith direction and its FOV is a 180° × 180° region with a fixed size. The cloud cover condition is classified by the cloud distribution and thickness in the images, referring to two circles positioned on the image, with zenith angles of 44.7° and 65°. As Figure 18 depicts, clouds with different altitudes have different diameters in the sky for different circles. On the other hand, one pixel of a polar-orbiting satellite (MODIS) corresponds to a specific region with a fixed size. The satellite measurements of cloudiness are dependent on the observational bands and processing algorithm for clouds at different altitudes. Therefore, the consistency of the cloud measurement between the satellite and ASCA data is affected by many factors, and we can only analyze the relevance of these two types of cloud data from a statistical perspective without reference to other data.

Fig. 18 The projected coverage of satellite and ASCA data at Xinglong Observatory. The central white square is the satellite's single pixel (TERRA's 1 km × 1 km resolution). The low cloud (0–2 km) at the temperate region is in a 44.7° FOV within the orange circle and 65° FOV within the yellow circle. The middle cloud (2–7 km) is in a 44.7° FOV around the orange circle and 65° FOV around the yellow circle. The high cloud (5–13 km) is in a 44.7° FOV, approximately between the orange and green circles and 65° FOV approximately between the green and blue circles.
Download figure:
Standard imageCloud cover in western China has been examined using MODIS data by Cao et al. (2020) MODIS data are from the Earth Observing System (EOS) project, which was started by the United States National Aeronautics and Space Administration (NASA) in 1999, including EOS/TERRA and EOS/AQUA satellites. These polar-orbiting satellites observe the Earth four times a day at local times around 10:30 AM, 1:30 PM, 10:30 PM and 1:30 AM (Platnick et al. 2003). The resolution at nadir is 1 km. We compared the MODIS data with ASCA results at Xinglong Observatory (40.39555° N, 117.57744° E) in 2015. We processed the images closest to 10:30 PM, corresponding to the TERRA satellite observation time at night, and 354 images were processed following the work-flow mentioned above. We note that we choose the 10:30 PM TERRA data due to a relatively smaller number of ASCA images being available for Xinglong around 1:30 AM, apparently arising from power outages. The ASCA-based cloud coverage at Xinglong in 2015 is shown in Table 10.
Table 10. ASCA Cloud Cover at Xinglong in 2015
| Clear | Outer | Inner | Covered | None | |
|---|---|---|---|---|---|
| Total | 90 | 33 | 54 | 146 | 31 |
| Percentage | 25.4% | 9.3% | 15.3% | 41.2% | 8.8% |
In 2017 and 2018, instrument teams purchased, calibrated and compared high-precision and uniform measurement instruments for three potential telescope sites in Western China.
We matched the percentage of clouds from MODIS and ASCA results. The distribution of satellite data based on percentage of cloudiness along with ASCA data classified by the "clear," "outer," "inner" and "covered" scenario is displayed in Figure 19, and on a night-by-night basis in Figure 20. In the construction of Figure 19, we assume that satellite cloud cover cases greater than 80% in the "clear" and "outer" scenarios and less than 20% in the "covered" and "inner" scenarios are outliers. All outliers were checked manually, and three images were moved from "inner" to "none" based on underexposure. The remaining images are listed in Table 11 grouped by month. We note the outliers in the "clear+outer" and "covered+inner" are distributed into different months without overlap. There are 24 outliers in Table 11 and thus we find a 6.8% (24/354 images) discrepancy between ASCA and satellite classification for the Xinglong site. This is reasonably consistent with TMT's 3%–6% (Schöck et al. 2009).

Fig. 19 For a particular ASCA classification at Xinglong at 10:30PM based on (a) "clear," (b) "outer," (c) "inner" and (d) "covered," the TERRA data are plotted as a histogram based on the percentage of cloudiness. The figure caption records the number of available ASCA images (ASCA Total) and the median of the TERRA percentage cloudiness (TERRA Median).
Download figure:
Standard image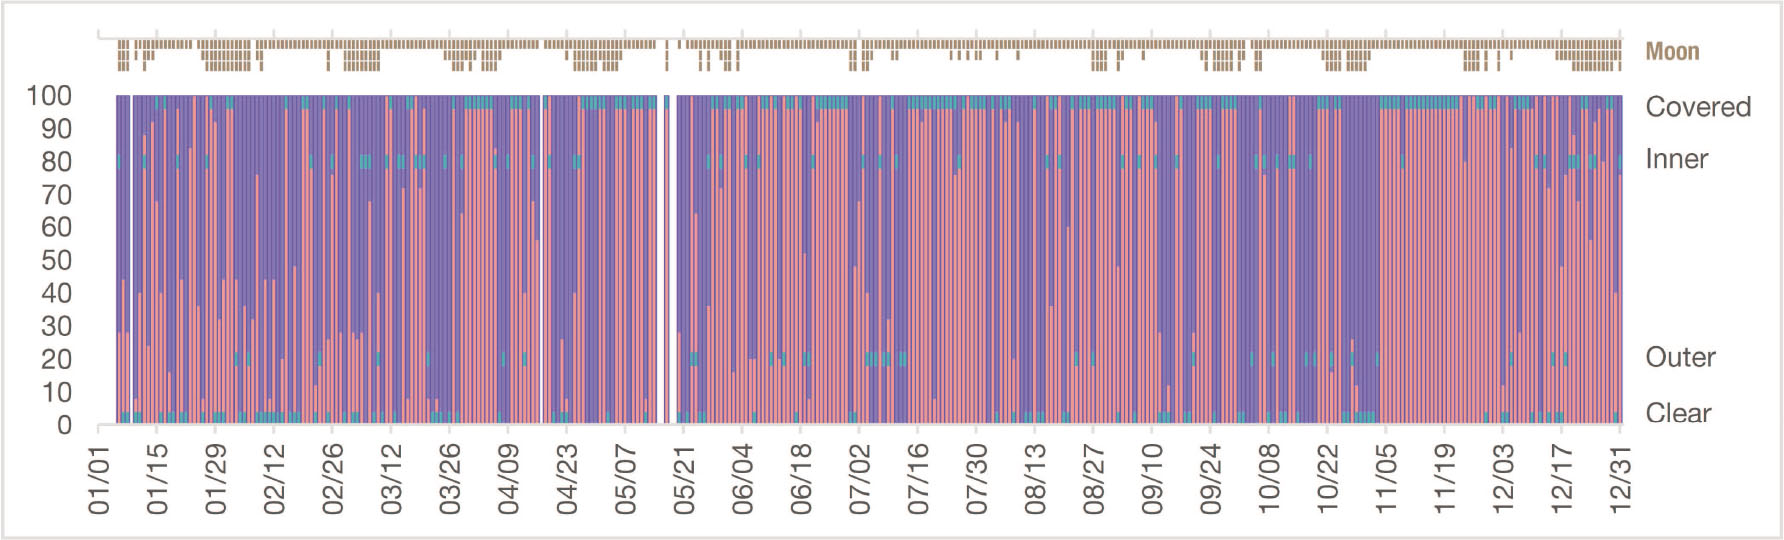
Fig. 20 Time series of the cloud cover from TERRA and ASCA at Xinglong. The impact of moonlight is shown at the top of the plot and is the combination of the Moon phase and altitude, and signifies the negative impact of moonlight on processors by three levels, marked by brown squares. The left-hand y-axis is the cloud percentage plotted in red from the TERRA satellite (or alternatively the clear-sky in blue). The right-hand y-axis is the cloud cover as measured by ASCA and is indicated by green squares.
Download figure:
Standard imageTable 11. Outliers in "Clear$+$Outer" and "Inner+Covered"
| Jan. | Feb. | Mar. | Apr. | May | Jun. | Jul. | |
|---|---|---|---|---|---|---|---|
| Clear+Outer | 1 | 0 | 0 | 0 | 1 | 3 | 0 |
| Inner+Covered | 0 | 0 | 4 | 4 | 0 | 0 | 2 |
| Aug. | Sept. | Oct. | Nov. | Dec. | Total | Percentage | |
|---|---|---|---|---|---|---|---|
| Clear+Outer | 0 | 0 | 0 | 1 | 5 | 11 | 8.9% |
| Inner+Covered | 0 | 1 | 2 | 0 | 0 | 13 | 6.5% |
7. Summary
The operation team from Ali, Daocheng and Muztagh-ata installed all instruments, and completed the construction of necessary power supply facilities, communication facilities, observation towers, as well as other site infrastructure improvements. The completion of this task in sparsely populated areas with average site altitudes over 4500 m where the stability of power supply and communication cannot be guaranteed and the measurement of data is accompanied by the construction of the station was a challenging task. With regular data analysis, the independent teams established site testing data management guidelines and a data processing flow to ensure data quality. We have provided detailed information about the raw data processing, the utility of related data products, and shared problems with data management which might provide useful material for those who make and use site testing results.
The research is partly supported by the Operation, Maintenance and Upgrading Fund for Astronomical Telescopes and Facility Instruments, budgeted from the Ministry of Finance of China (MOF) and administered by the Chinese Academy of Sciences (CAS). The research is also supported by the National Natural Science Foundation of China (Grant Nos. 11573054, 11703065, 11603044 and 11873081). HRAJ acknowledges support from a CAS PIFI and UK STFC grant ST/R006598/1.
Footnotes
- 1
- 2
- 3
- 4
- 5
- 6
- 7
- 8
- 9
- 10
- 11
- 12