Abstract
Sunspots are the most striking and easily observed magnetic structures of the Sun, and statistical analysis of solar historical data could reveal a wealth of information on the long-term variation of solar activity cycle. The hand-drawn sunspot records of Yunnan Observatories, Chinese Academy of Sciences have been accumulating for more than 60 years, and nearly 16 000 images have been preserved. In the future, the observation mode of recording sunspots by hand-drawing will be replaced inevitably by digital images observed either at ground or in space. To connect the hand-drawn sunspot data and the purely digital sunspot data in future, it is necessary to analyze the systematic errors of the data which are observed by the two observation modes in the period of transition. In this paper, we choose 268 round sunspots (H-type in modified Zurich sunspot classification) from the drawing of Yunnan Observatories to compare their positions and areas with the CCD observations made by Helioseismic and Magnetic Imager (HMI) on board Solar Dynamic Observatory (SDO) and Global Oscillation Network Group (GONG). We find that the latitude and longitude accuracy of hand-drawn sunspot are within −0.127 and 2.29 degree respectively, and the area accuracy is about 16.36 sunspot unit (μHem). Systematic errors apparently decrease with large sunspot.
Export citation and abstract BibTeX RIS
1. Introduction
Sunspots are one of the oldest and the most important observed solar magnetic structures in the photosphere (Li et al. 2003). Since Schwabe (1844) discovered the 11-year cyclic variation for the number of sunspots, and the long-term evolution of solar magnetic indices and their major 11-year cycle had largely depended on ever-accumulating observational records (Li et al. 2016). For example, 10 years later, Carrington (1854) discovered that sunspots drift in latitude toward the equator within a sunspot cycle. When the latitudes of sunspot appearance are plotted against time, the resulting regularity of latitude distribution is popularly known as the "butterfly diagram," which was first named by Maunder (1913). It is believed that the long-term observations of solar sunspots will play an important role in the establishment of the theory of solar dynamo and prediction of solar activity and space weather (Charbonneau 2010; Dikpati & Gilman 2009).
Since the beginning of the seventeenth century, sunspot observation has been carried out in many countries one after another. Among them, hand-drawn sunspot records are the most original basis for studying the solar cycle changes (Vaquero 2007). With the development of modern image processing technology, the digitalized sunspot data could bring us more abundant information. Meanwhile, apart from hand-drawing images, the digital images from space can also be obtained since the launch of the SOHO (Solar and Heliospheric Observatory) satellite in 1996. The correlation analysis of the two kinds of data is helpful for further determining the systematic errors of historical hand-drawn sunspot data. By correcting the errors in hand-drawn sunspots records, this kind of valuable historical data can be merged into future purely digital sunspot data, thus providing more valuable and reliable data for the observation and research of sunspot. In this way, the historical sunspot data will be very helpful in the study of the long-term cyclic behaviors.
Li et al. (2016) made a comparison between the hand-drawn sunspot image of the Purple Mountain Observatory of the Chinese Academy of Sciences and the SDO/HMI (Scherrer et al. 2012) (Solar Dynamics Observatory/Helioseismic and Magnetic Imager) images. They found that the position accuracy is about 7 arcsec through a statistical analysis (Li et al. 2016). However, the time span of their study was very short (only 1 year) and limited to the comparison of longitude and latitude errors. The hand-drawn sunspots records of the Yunnan Observatories are important historical data set among Chinese hand-drawing records. For example, in previous studies, the observational data of sunspot area from 1981 to 1992 have been used for several times to complete and refine global sunspot data (Baranyi et al. 2001; Balmaceda et al. 2010). Still, we need to evaluate the systematical errors between the hand-drawing records and corresponding digital data.
Based on the Chinese historical sunspots drawings from 1925 to 2015, Lin et al. (2019) constructed a data set consisting of the scanned images and all their digitized parameters. Our paper aims to study the accuracy analysis for digitized sunspot hand-drawing records of Yunnan Observatories. The rest of this paper is organized as follows. The basic information of hand-drawn sunspot record and observation equipment are introduced in Section 2. Section 3 is the image processing method for digitalized hand-drawn sunspots observed by Yunnan Observatories for 11 years from August 2004 to December 2015. The digitized results of hand-drawn sunspot observation data were compared with the simultaneous Michelson Doppler Imager (MDI) (Scherrer et al. 1995) and Global Oscillation Network Group (GONG) (Harvey et al. 1988) by using semi-automatic program and manual authentication, and then the corresponding information for hand-drawing image sunspot and satellite image sunspot is ultimately obtained. Section 4 analyzes the accuracy of longitude, latitude and area for the hand-drawn sunspot of Yunnan Observatories. Our conclusions are given in Section 5.
2. Introduction to the Information
Sunspot observation at the Yunnan Observatories of the Chinese Academy of Sciences began in the 1950s and is still going on at present time. For more than 60 years, they have produced more than 16 000 sunspot drawings. The observatory carries out the project with a 5-inch equatorial telescope. On sunspot drawings, the location, size, shape, and structures for big sunspots are recorded with hand writing, they also record the relative number and area of sunspots on that day, as well as the parameters of angle P, angle B0 and angle L0.
Figure 1 shows the dome and sunspot telescope appearance. Figure 2 is an example of the hand-drawn sunspot observation record of Yunnan Observatories on 2014 January 4. The length of record paper is 21.3 cm, and the height is 25.3 cm. The diameter of projected solar image is 17.4 cm. The green circle printed in the drawing paper is intended to hold in a projected solar image, making its center right at the dot (a crossing point of the N-S line and E-W line).

Fig. 1. Appearance of the dome and sunspot telescope.
Download figure:
Standard image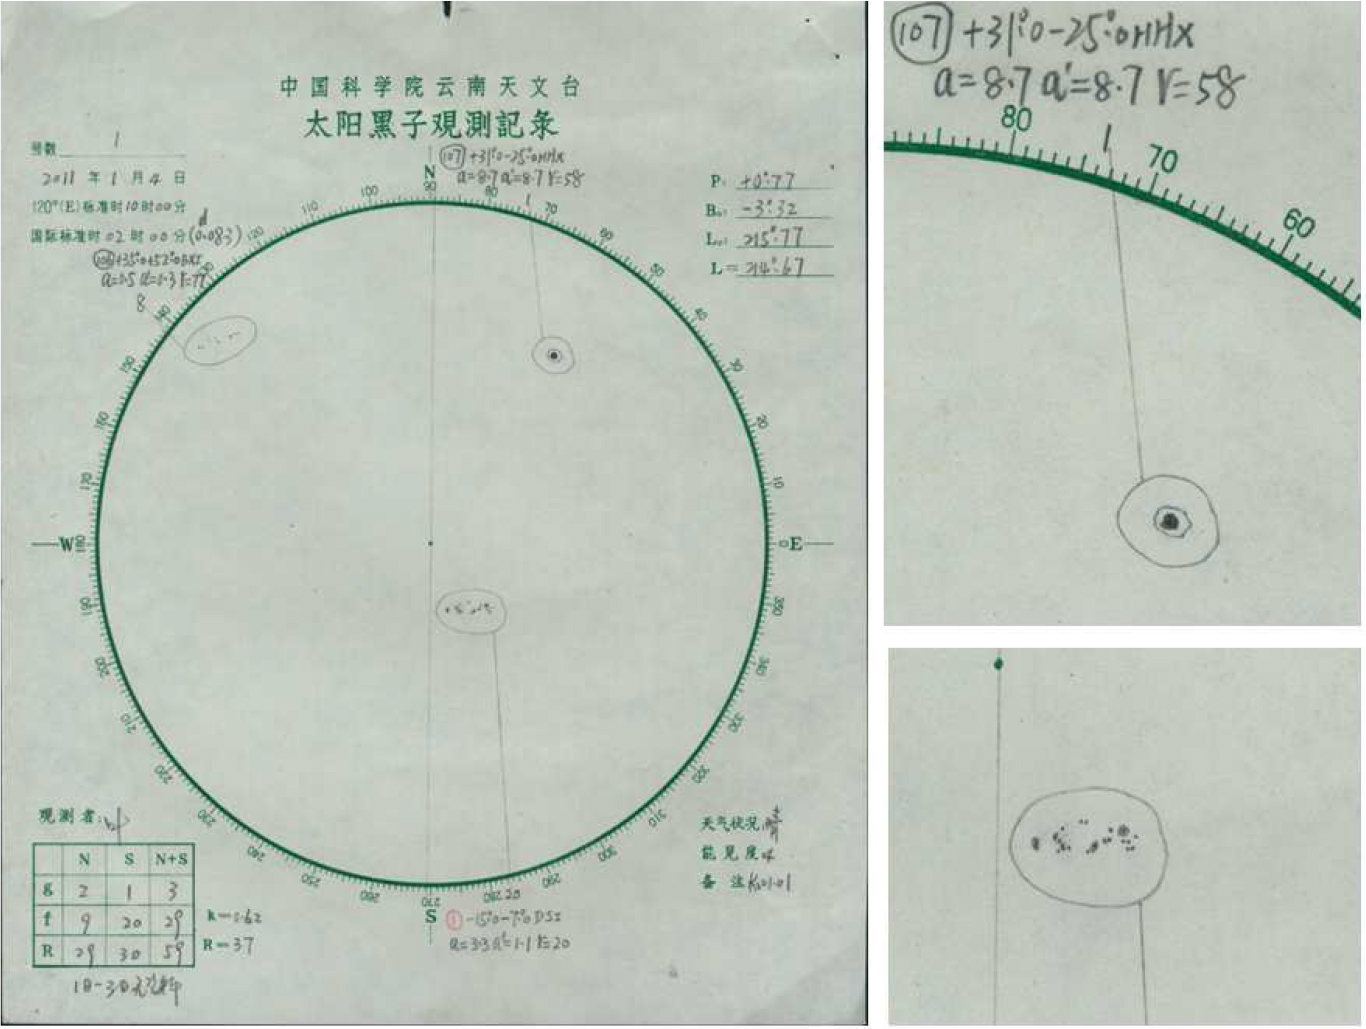
Fig. 2. Samples of a whole-disk sunspot drawing image and two partial images made at Yunnan Observatories.
Download figure:
Standard image3. Data source, sunspot identification and corresponding methods
The observation accuracy of sunspots hand-drawing is analyzed by using MDI (Scherrer et al. 1995) and GONG (Harvey et al. 1988) spectral continuum images as comparison benchmarks. We analyzed totally 788 records selected from sunspot hand-drawing records from August 2004 to December, 2015. The sunspot hand-drawing records were recorded by sunspot observers with the help of a transparent grid sheet. Each day after observation, the observers overlapped the grid sheet with his drawing, carried out a alignment and estimate sunspots' position and area. According to the time marked on the hand-drawn sunspot observation record, images with the closest time were selected from the MDI and GONG images for sunspot correspondence. Among them, we use MDI spectral continuum full-heliographic images from August 2004 to September 2009. The images of the spectral continuum of GONG were used from October 2009 to December 2015. Figure 3 shows an example of hand-drawn sunspot record of Yunnan Observatories on 2011 January 4 and the simultaneous GONG image.

Fig. 3. The hand-drawing image of sunspot (left) and simultaneous GONG full-disk image (right) on 2011 January 4 (where the GONG image is rotated 180 degrees clockwise).
Download figure:
Standard imageIn this paper, a semi-automatic sunspot recognition method is adopted, and visual certification is added to ensure the accuracy of sunspot data. When all sunspots are corresponding on two images and parameters are correctly calculated, the data is set to be valid for further analysis.
The sunspot area information is very important, so it is necessary for us to describe the image processing method for extracting area information in detail. Firstly, the approximate region of the sunspot is segmented by human interaction, and a small rectangular region is obtained. Then, in the rectangular region, the OTSU method (Ohtsu 2007)is used to segment the sunspot automatically, so that the sunspot can be extracted automatically. Finally, calculating the pixel area of the connected domain of the sunspot, and dividing it by the pixel area of the sun hemisphere to get the absolute area of the sunspot.
3.1. Image Processing
In current research, we aim to get the heliographic longitude, the heliographic latitude, and the area for round-shaped sunspots. When we get a hand-drawn sunspot, we get the drawing time of the sunspot record according to the image name at first, after which, we calculate the three key parameters: B0, L0 and P. Then we establish the rectangular coordinate system with the center of the circle as the origin. The sunspot is cut out from a full-disk image, the sunspot area on the pixel level and the coordinates in the rectangular coordinate system are calculated. Lastly, sunspot heliographic longitude, heliographic latitude are calculated according to the above parameters. For satellite images, the image processing method is similar to hand-drawing images.
3.2. Parameter Calculation
We first calculate parameters B0, L0 and P. For a given instant, the heliographic latitude B0 and the heliographic longitude L0 of the center of the solar disk, the position angle of the northern extremity of the axis of rotation P can be calculated by date (Meeus 1991).

where I is the inclination of the solar equator on the ecliptic, which is 7.25 degrees, K is the longitude of the ascending node of the solar equator on the ecliptic, which can be calculated according to the date. The apparent longitude λ of the Sun and the obliquity of the ecliptic ε can be calculated as explained in Chapters 22 and 25 of Meeus (1991). θ defines the zero meridian of the heliographic longitudes. x, y and η are intermediate variables. The specific calculation is as follows:

Let JD be the Julian Ephemeris Day, which can be calculated by means of the method described in Meeus (1991). Then, the time T, measured in Julian centuries of 36525 ephemeris days from the epoch J2000.0, is given by

Finally, λ' is the λ corrected for the nutation in longitude. The λ' is derived from

We calculate the heliographic latitude Bp and the heliographic longitude Lp of the sunspot and make projection correction. We calculate the following angle:

where the coordinates in relation to the center of a circle on a hand-drawn sunspot graph is denoted by (x, y), appdiam is the apparent diameter of the Sun (in degree) and diskdiam is the diameter of the disk drawing (in the same units and x and y). In the end, we can derive the heliographic latitude Bp and heliographic longitude Lp of sunspot:

3.3. The Correspondence between Two Sunspots
For the digitized hand-drawn sunspot image, the limb of solar image on the observation record paper was extracted first, and we calculate the center and radius of its inscribed circle, and then establish a rectangular coordinate system with the center of the disk at (0,0), x is positive to the east, y is positive to the north.
For the spectral continuum image, the rectangular coordinate system is established in the same way as mentioned above. We carry out P angle correction on the hand-drawn sunspot graph, according to the relative positions of sunspots in the two coordinate systems. In this way, we have the same sunspot in the same place of the two kind of images.
3.4. Sunspot Recognition
Automatic recognition of hand-drawn sunspot is a difficult task. First, on a hand-drawn sunspot image, pencil marks not only give sunspots, but also lots of auxiliary line segments, circles, numbers and letters. Second, in the extraction of pencil image, due to paper mildew and other reasons will be mixed with some small noise, these small noise on the automatic identification of small sunspots have a dramatic jamming. In addition, larger sunspots have obvious umbra and penumbra boundaries, while hand-drawn sunspots usually only use contour lines to draw the penumbra, which is easy to be confused with the auxiliary lines of individual sunspots. At the same time, the unclosed penumbra contour also challenges a standard sunspot extraction method.
In this paper, the method of semi-automatic sunspot recognition is adopted, and visual authentication is added to ensure that the sunspot information extracted from the hand-drawn sunspot graph is certainly correct.
Figure 4 shows that after the local image of a single-sunspot is intercepted from the hand-drawing image and satellite image, the area of sunspot umbra and penumbra, sunspot circumference and sunspot center of mass are calculated by the image processing method, and the corresponding position of sunspot in the satellite image is displayed. For an MDI image, we multiply the binary mask with the limb-darkening correcting full disk images to isolate the sunspots more accurately.
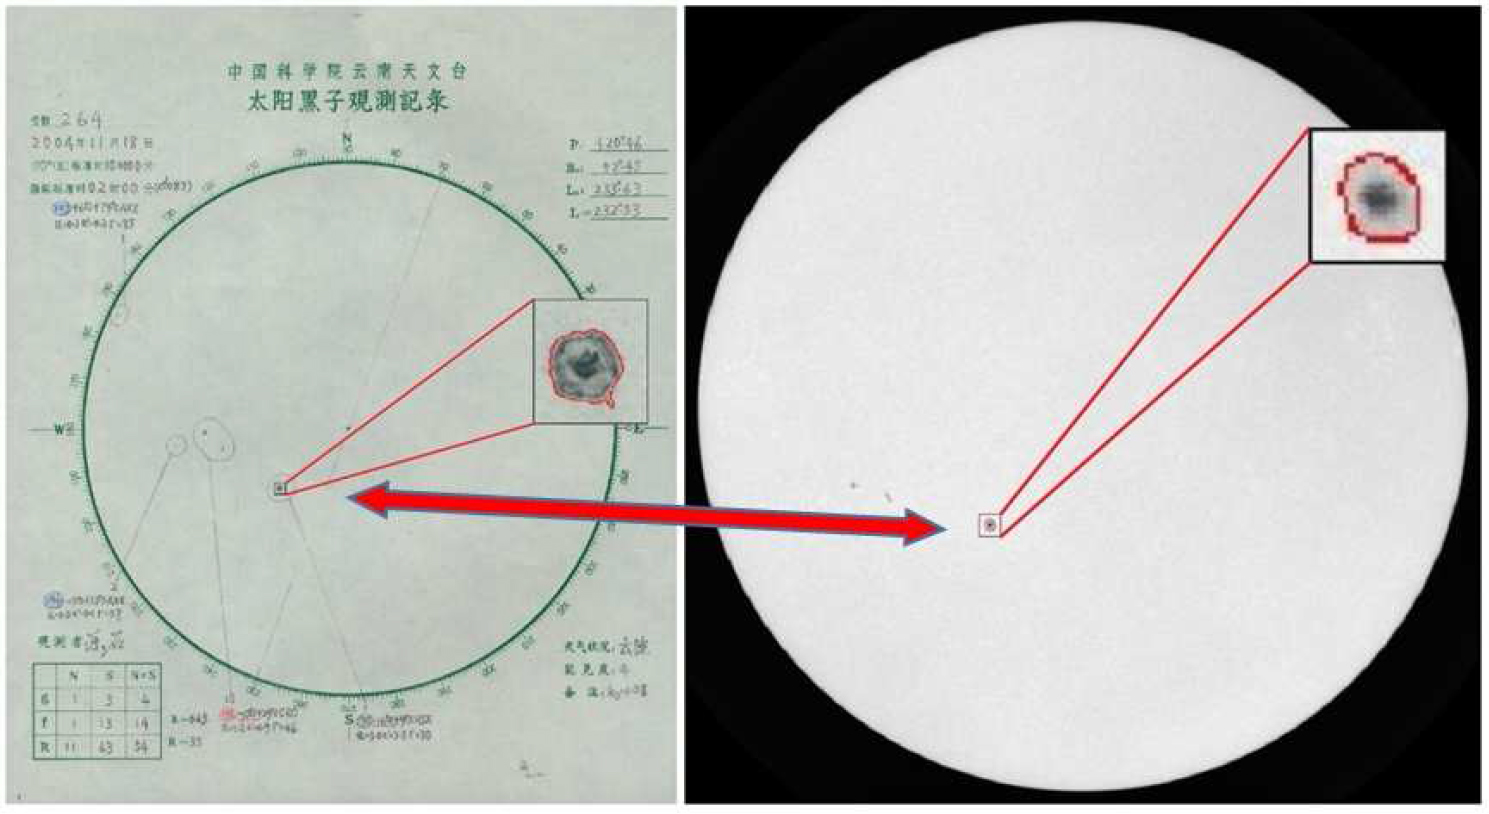
Fig. 4. Representative images from the Yunnan Observatories and MDI data. Two detected sunspots are highlighted by two rectangular boxes. In the inset we show zoomed-in views of sunspots. The red contours represent the detected area for the sunspots.
Download figure:
Standard image3.5. Parameter Comparison for Different Data Sources
Taking the single sunspot highlighted in Figure 4 as an example, we compare the parameters such as latitude, longitude and area from different data sources, as shown in Table 1. In Table 1, the three sets of data are the hand-drawn sunspot original records, the hand-drawn sunspot parameters obtained through image processing, and sunspot parameters from satellite images obtained through image processing. It can be seen from Table 1 that the latitude and longitude errors in the three sets of data are small, which shows that our image processing method is reliably accurate. In addition, the area of the hand-drawn sunspot obtained by image processing differs appreciably from the corresponding satellite sunspot area, mainly because they come from different observing systems. It is worth noting that we did not find the original record for the area of the hand-drawn sunspot, so we marked it with "-" in the table.
Table 1. The Parameter Comparison for Different Data Sources
| Source of Data\Parameters | Latitude (degree) | Longitude (degree) | Area (μHem) |
|---|---|---|---|
| Hand-drawing Record | −16 | 9.5 | - |
| Hand-drawing Image Processing | −15.11 | 9.67 | 88.00 |
| Satellite Image Processing | −15.48 | 9.96 | 101.70 |
4. Hand-drawn sunspot accuracy measurement results
From 788 hand-drawn sunspot records from August 2004 to December 2015, a total number of 268 round-shaped sunspots were selected. For the selected sunspots, their latitudes, longitudes and areas were calculated through image processing from both hand-drawings and CCD images from MDI or GONG. We obtained two sets of results and performed linear correlation analysis and error analysis on the results. The correlation relationships are displayed in Figure 5, from which we can see a very nice linear relationship between the two sets of data.

Fig. 5. The linear relationship for sunspot latitude (left), sunspot longitude (middle), and sunspot area (right) derived from Hand-drawing images and Satellite images. In the right panel, the points away from the center of the solar disk are the points outside the circle with a radius of 60 degrees centered on the solar disk's origin, and the points near the center of the solar disk are in the circle.
Download figure:
Standard imageThe left panel of Figure 5 gives the linear relationship for the latitudes of sunspots. For latitude, there is a very nearly equality between the two sets of results with the exception of a few very small sunspots (area less than ∼100). The regression equation is y = 1.006x, and their correlation coefficient is 0.98, where x and y correspond to the abscissa and ordinate coordinates in the graph. For longitude, the linear relationship gives a regression equation as y = 0.996x, and their correlation coefficient is 0.98. That is to say, the longitudes from hand-drawings are a little bit systematically larger than the ones from CCD images. This is due to the Sun's rotation during the drawing period (The time on the drawing sheet is the time when sunspot drawing was done). For area relationship that is given in the right panel, the regression equation gives y = 1.153x, and their correlation coefficient is 0.945. The areas from hand-drawings are systematically smaller by about 13%. The systematic error is not at all negligible. The reason for this is that penumbra regions of sunspots in hand-drawings are mostly incomplete, leading to a decreasing in area calculation. Also, we see that, for large sunspots and the sunspots around disk center, we are approach an equality relationship between the two sets of results. However, for sunspots near solar limb, the effects of foreshortening for sunspots will also increase hand-drawing's difficulty and area estimation.
Figure 6 displays the histograms and corresponding Gaussian fittings for the position and area offsets between the hand-drawing image sunspots and the CCD images sunspots. The offsets are obtained by subtracting the values of CCD images from the the ones of hand-drawing images. The fitting curves are given by  and the three parameters for latitude, longitude and area are given in Table 2. Table 2 and Figure 6 basically confirm the results in Figure 5. We see that, for latitude, the offsets are slightest with the mean value of −0.127 degree and the standard deviation (RMS) of 0.698 degree. For area, the mean offsets is 16.36 sunspot unit (μHem, one millionth of the area of solar disk).
Table 2. Parameters of the Fitted Curves in the Fig. 6
| Fitting curve\Curve parameters | A | μ | σ |
|---|---|---|---|
| The fitting curve in the left panel | 0.554 | −0.127 | 0.698 |
| The fitting curve in the middle panel | 0.2857 | 2.293 | 1.25 |
| The fitting curve in the right panel | 0.168 | 16.36 | 22.17 |

Fig. 6. The histograms and Gaussian fitting curves of sunspot latitude offsets (left), sunspot longitude offsets (middle), and sunspot area difference (right) between the Hand-drawing images and the Satellite images.
Download figure:
Standard image5. Conclusions
In this paper, we used the method of semi-automatic recognition program combined with visual certification to analyze the hand-drawn sunspots obtained by Yunnan Observatories, and then compared them with the CCD observations regarding their locations and areas. We got the following results for systematic errors for the two sets of parameters:
- (1)The systematic errors for longitude, latitude and area meet the Gaussian distribution law. The offsets of latitude is slightest, showing that sunspot latitude positions in drawings are basically reliable.
- (2)For longitude, the mean offset is about 2.293 degrees. This is due to the disk rotation during the drawing of sunspots. It usually takes 2 – 3 hours or even longer for finishing a drawing sheet. So the time difference between a CCD image and a corresponding hand-drawing image cannot be properly fixed. At the heliospheric equator, a displacement produced by the Sun's rotation is up to 0.6 degree per hour. Three hours' drawings contribute an offset no more than 2 degrees, we thus see that telescope's tracking error could have contributed to the systematic errors.
- (3)For areas, the mean offset is about 16.36 millionths (μHem). The sunspot area obtained from drawings are systematically smaller than that from CCD images. The selected samples for this investigation are all old sunspots, i.e., sunspots with regular surrounding penumbras.
- (4)All the three kinds of offsets were minimum for larger sunspots.
Acknowledgements
We wish to express our gratitude to the anonymous referee for constructive comments and suggestions. This work is supported by the National Natural Science Foundation of China (Grant Nos. U1731124, U1531247, 11427901 and 11873089), the special foundation work of the Ministry of Science and Technology of China (Grant No. 2014FY120300), the 13th Five-year Informatization Plan of Chinese Academy of Sciences (Grant No. XXH13505–04), and the Youth Innovation Promotion Association CAS. The hand-drawing historic images used in this work are provided by the Yunnan Observatories, Chinese Academy of Sciences. The authors are indebted to Professor Kai-fan Ji for his constructive suggestions on the manuscript.