Abstract
Observations by the method of lunar occultations at the 6-m telescope of the SAO RAS reach a resolution limit better than 1 mas. We have devised a new method of observation, which allows obtaining the curves of lunar occultations simultaneously in different ranges of the visible part of the spectrum, and conducted the first observations using a modified optical system. In January 2019, applying the new method, the magnitude differences of the components of the binary star HD 36524 in the R and I bands were measured, which were 1.5 and 1.3 mag, respectively, in good agreement with values calculated from the Gaia mission. According to the obtained data, it was determined that with this method it is possible to reach a signal-to-noise ratio of about 5–10 for stars of 10th magnitude. We discuss the applicability of the proposed optical scheme for the study of binary stars.
Export citation and abstract BibTeX RIS
1. Introduction
The lunar occultation method is one of the highresolution astronomy methods along with long-baseline interferometry, adaptive optics and speckle interferometry. It consists of observing the photometric curve at the time of occultation and analyzing the change in signal intensity level. An analysis of the diffraction pattern formed at the edge of the lunar disk allows one to obtain information on the angular size of the source or to study binary and multiple stars.
This method is widely utilized, since, being relatively cheap and easy to implement, it allows us to achieve a performance comparable to that of long-baseline interferometry. Currently, the maximum angular resolution that can be achieved has exceeded 1 milliarcsecond.
For observations of lunar occultations at the 6- m telescope of the Special Astrophysical Observatory, Russian Academy of Sciences (SAO RAS), a speckle interferometer is employed (Maksimov et al. 2009), with an EMCCD detector operated in fast photometry mode (Richichi et al. 2017; Dyachenko et al. 2018), providing high temporal resolutionwith cycle frequency ofmore than 500Hz.
However, lunar occultations are random and rather rare events. Typical occultation time is less than 1 second. The result is a single photometric curve obtained in one spectral channel. Another problem is ambiguity in determining the local slope of the lunar limb.
In order to increase the amount of information about an object obtained from observing a single occultation, it is possible to simultaneously obtain photometric curves in various spectral ranges (White 1980; Harvey & Oldag 2007). This will facilitate comparing different regions of stellar atmospheres and eliminate the problem of ambiguity in determining the slope of the lunar limb, since the relative sizes of the spectral regions are independent of the slope of the limb. For binary stars, it will be possible to compare the magnitude differences in different spectral ranges to determine the relative energy distribution.
2. Method
To achieve simultaneous observations of lunar occultations in various spectral ranges, a speckle interferometer at the SAO RAS was equipped with a grism - a combination of a prism (PS814, Thorlabs, refracting angle 18°) and a diffraction grating (# 49–579, Edmund Optics, 300 lines mm−1, blaze angle 17.5°). Such a system enables obtaining low-resolution spectra with short exposures.
The arrangement of optical elements is selected so that the first order of the spectrum is on the detector and the maximum of light corresponds to it, and also to provide a spectral resolution of about 10 nm, which corresponds to the characteristic size of the molecular absorption bands of evolved stars. Grism spectral resolution was estimated by theoretical calculations, using known prism and grating specifications. We estimated the resolution of the whole system as the cumulative point spread function (PSF) and grism resolution, assuming each grism component has a negligible effect on the PSF. Independently, we have observed stars with strong lines in their spectra. Practical spectral resolution was estimated from the width of these lines. In the system, the grism is located after the atmospheric dispersion compensator and in front of the detector in the filter turret. To minimize background illumination from the Moon, we installed an opaque mask with a round hole.
The resulting spectral range is about 300 nm, provided by the angular size of the detector. Depending on the position of the object in the direct image, we can observe spectral regions in the 300–1000 nm range. Calibration of wavelengths is performed according to the position of the object in the direct image.
With a modified optical system, test observations were carried out at the Zeiss-1000 telescope in October 2018 and a number of observations were acquired at the 6-m telescope of the SAO RAS in 2019.
3. Observation
On 2019 January 18 at the 6-m telescope of the SAO RAS, observations were made of several unresolved stars and the binary HD 36524 (α = 05h33m06s.9, δ = + 20° 02'07''.70; α = 05h33m07s.0, δ = + 20° 02'04''.33). The angular distance between the components of this system for 2015 was 3''.8 (Mason et al. 2001). According to parallax values from the Gaia Data Release 2 (DR2) catalog (πA = 20.9±0.2, πB = 22.1±0.1), we can assume that this star is a physical pair.
The stars in this system have values in V of 9.01mag and 10.67mag, which indicate the proximity of such a system to the limits of observation by the method of lunar occultations, even in direct image mode. In the SIMBAD database, the spectral classes of components are given as G9 and K4, respectively (Bidelman 1985).
The observations were carried out with a ×2.5 micro-objective, which provided a field of 28.2 arcsec. To achieve a high temporal frequency, the spectral images were recorded in frame transfer mode with 8×8 binning and a region of interest (ROI) of 512×192 pixels. The exposure time per frame was 0.5 ms. The total number of pixels per frame is 64×24, the time of one recording cycle is 2.56 ms and the corresponding frequency is 390.63 Hz. The observed spectral range is 602.9–905.3 nm.
In order to compare our data with the literature ones, we divided the observed spectral range into regions close to the R and I bands (R: 602.9–727.7 nm, I: 731.5–880.5 nm). The range for R band was approximately 10 nm less than the standard, which does not significantly affect the result.
We analyzed the signal-to-noise ratio (SNR). Changing the boundaries of the signal summation region inside the frame, we compared the SNR values and constructed an SNR distribution map depending on the range under consideration (Fig. 1).
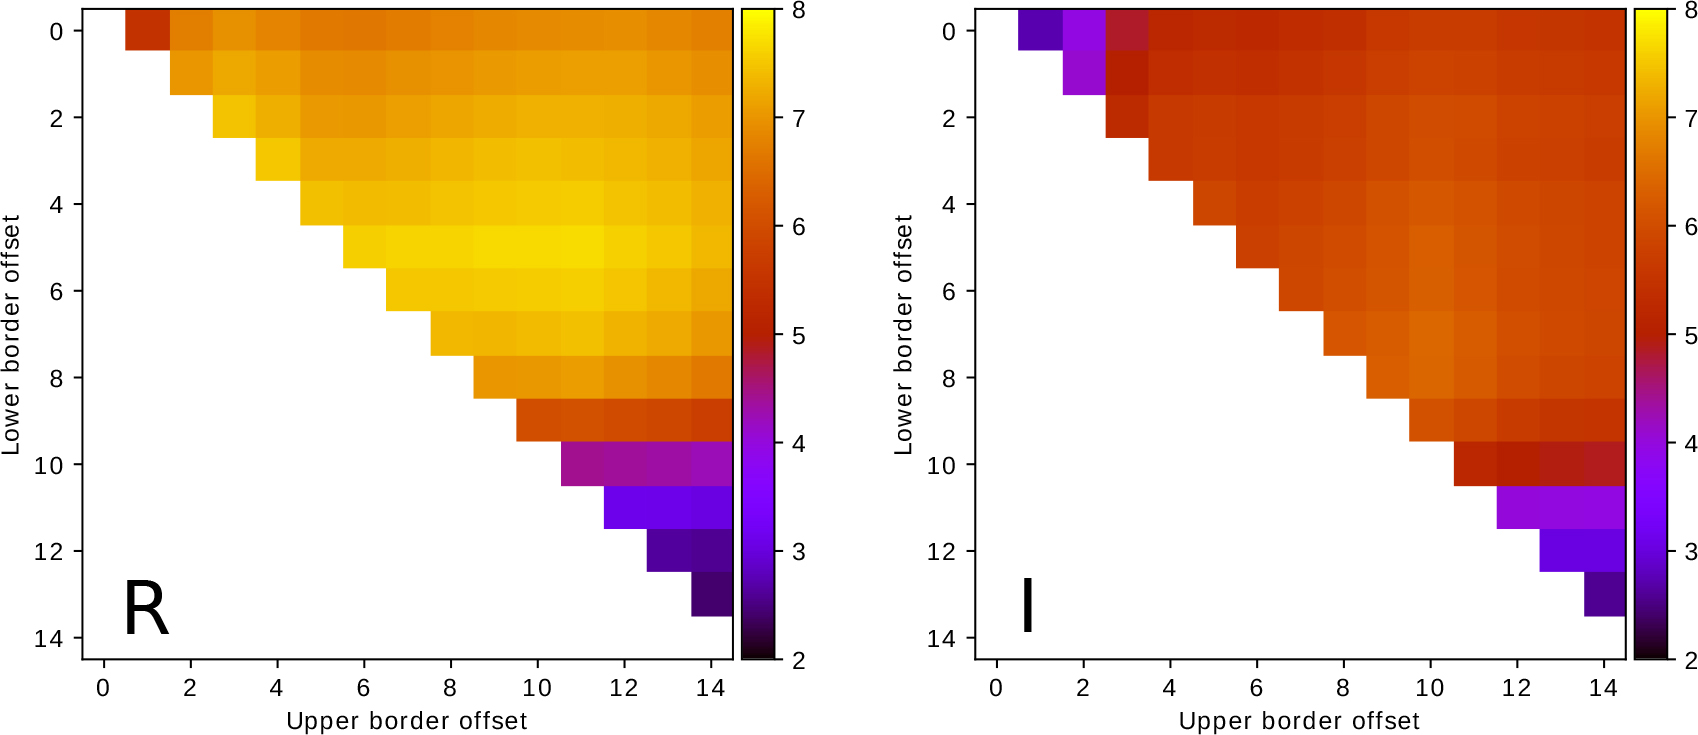
Fig. 1 SNR distribution depending on the change in the boundaries of the signal summation region inside the frame in the R (left) and I (right) bands.
Download figure:
Standard imageThus, we have found the optimal signal summation ranges that provide the maximum SNR, which do not cut off useful parts of the signal and contain the spectra of both components. Note that since the binary observed by us is separated by 3.8 arcsec, the spectrum of each component is observed separately. The resulting areas are shown in Figure 2.

Fig. 2 Signal summation areas for R and I bands (white rectangles). Left: average over frames containing a signal from one star; right: average over frames containing the signal from both components. The spectra of the components are indicated by the letters A and B, respectively. The signal summation region is the vertical dimension of the white rectangles.
Download figure:
Standard image4. Analysis and Conclusions
Based on the obtained data, we constructed light curves in the ranges R and I (Fig. 3). Despite the fact that the data are noisy, a decrease in the intensity level is observed twice on each curve, which indicates that the star resolves as a double in both bands. The total SNR, which we have achieved, was 7.9 for the R band and 6.6 for the I band. Thus, this method allows us to obtain an SNR of about 5-10 for stars of 10th magnitude.
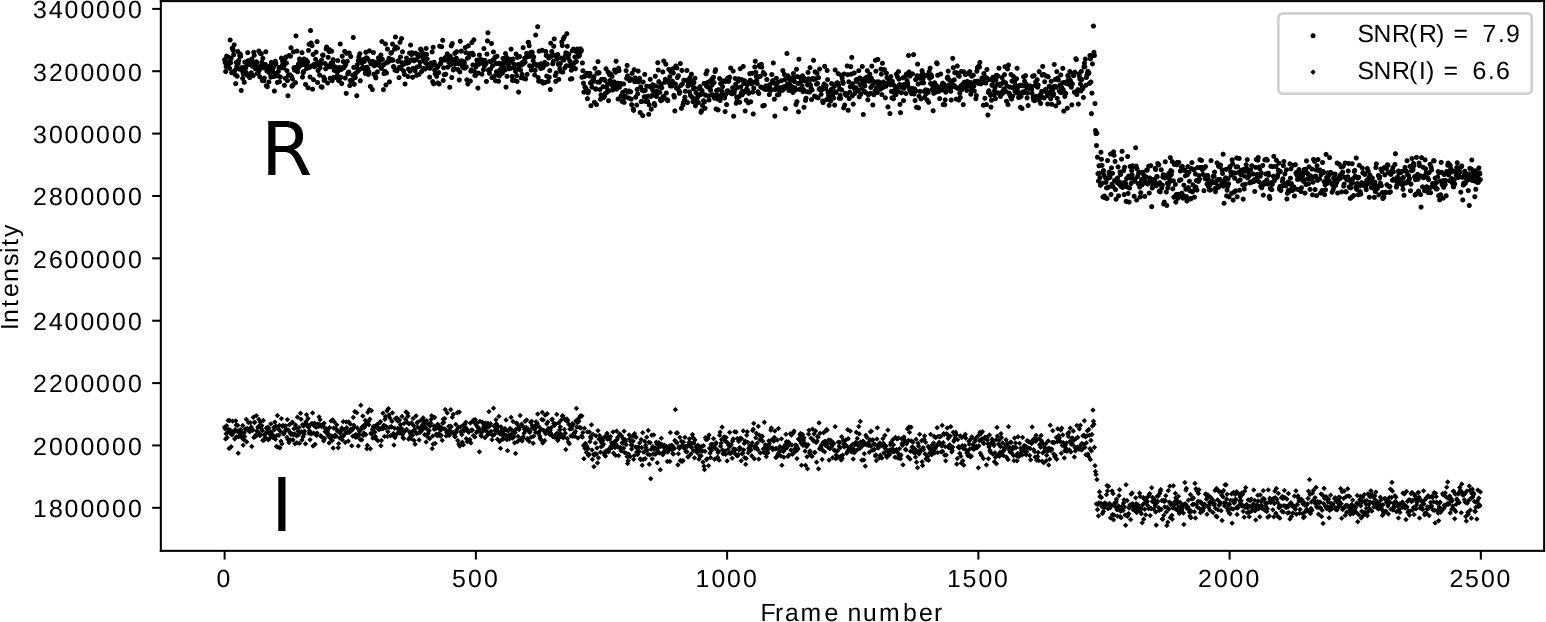
Fig. 3 Curves of the lunar occultation for the star HD 36524 in the R (602.9–727.7 nm) and I (732.5–881.3 nm) bands.
Download figure:
Standard imageStar discs are not resolved. We have estimated the angular sizes of each component. Three different empirical methods were used for the calculations, based on the relationship between the V − K color index and the angular diameter: van Belle (van Belle 1999), Di Benedetto (Di Benedetto 2005) and Adams (Adams et al. 2018). The van Belle and Adams methods provide formulas for giant stars and dwarfs separately.We considered ratios for giants based on information on stellar magnitudes and parallaxes of stars. The obtained estimates for the angular diameters are given in Table 1. The results yielded by all three methods for each component converge. Moreover, the estimate of the angular diameter of each star does not exceed 0.3mas, which is beyond our resolution.
Table 1. Estimates of the Angular Diameters of the Components of HD 36524
| van Belle | Di Benedetto | Adams | |
|---|---|---|---|
| HD 36524 A | 0.24 mas | 0.22 mas | 0.22 mas |
| HD 36524 B | 0.25 mas | 0.25 mas | 0.26 mas |
For both ranges, we measured the magnitude difference between the components. For comparison,we utilized Gaia photometric measurements recalculated according to the following formulas (Evans et al. 2018):
The measured and calculated magnitude differences between the stars of the system are listed in Table 2. Our values coincide with good accuracy with the values obtained from Gaia data. Observations of the star HD 36524 and analysis of the obtained results demonstrate the applicability of the implemented method and further prospects of this instrumental solution.
Table 2. Measured and Calculated Magnitude Differences for the Components of the HD 36524 System in R and I Bands
| SNR | Intensity ratio | Measured Δm | Calculated Δm | |
|---|---|---|---|---|
| R band | 7.9 | 4.1 ± 1.1 | 1.53 ± 0.28 | 1.48 ± 0.05 |
| I band | 6.6 | 3.4 ± 1.0 | 1.34 ± 0.32 | 1.29 ± 0.05 |
Acknowledgements
The work was performed as part of the government contract of the SAO RAS approved by the Ministry of Science and Higher Education of the Russian Federation. The reported study was funded by RFBR (project No. 20–32–70120). This research has made use of the SIMBAD database, operated at CDS, Strasbourg, France.