Abstract
Dome A in Antarctica has been demonstrated to be the best site on earth for optical, infrared, and terahertz astronomical observations by more and more evidence, such as excellent free-atmosphere seeing, extremely low perceptible water vapor, low sky background, and continuous dark time, etc. In this paper, we present a complete picture of the development of astronomy at Dome A from the very beginning, review recent progress in time-domain astronomy, demonstrate exciting results of the site testing, and address the challenges in instrumentation. Currently proposed projects are briefly discussed.
Export citation and abstract BibTeX RIS
1. Introduction
Antarctic plateau has long been considered as an exceptional place for ground-based astronomical observations because of its favorable geographic and atmospheric properties. It is often compared to space and sometimes could be even better in terms of building large observing facilities.
A huge polar ice cap covers most of the continent. Besides South Pole, there are several prominent high points on the ice cap, among which Dome A is the highest at an altitude of 4093 meters and located within 80° S latitude circle. The winter temperature drops to between –50°C to –80°C while in summer it is seldom above –30°C (Hu et al. 2014, 2019).
Table 1 lists the locations and altitudes of Dome A, C, F, and South Pole which are also marked on a map of Antarctica (Fig. 1).
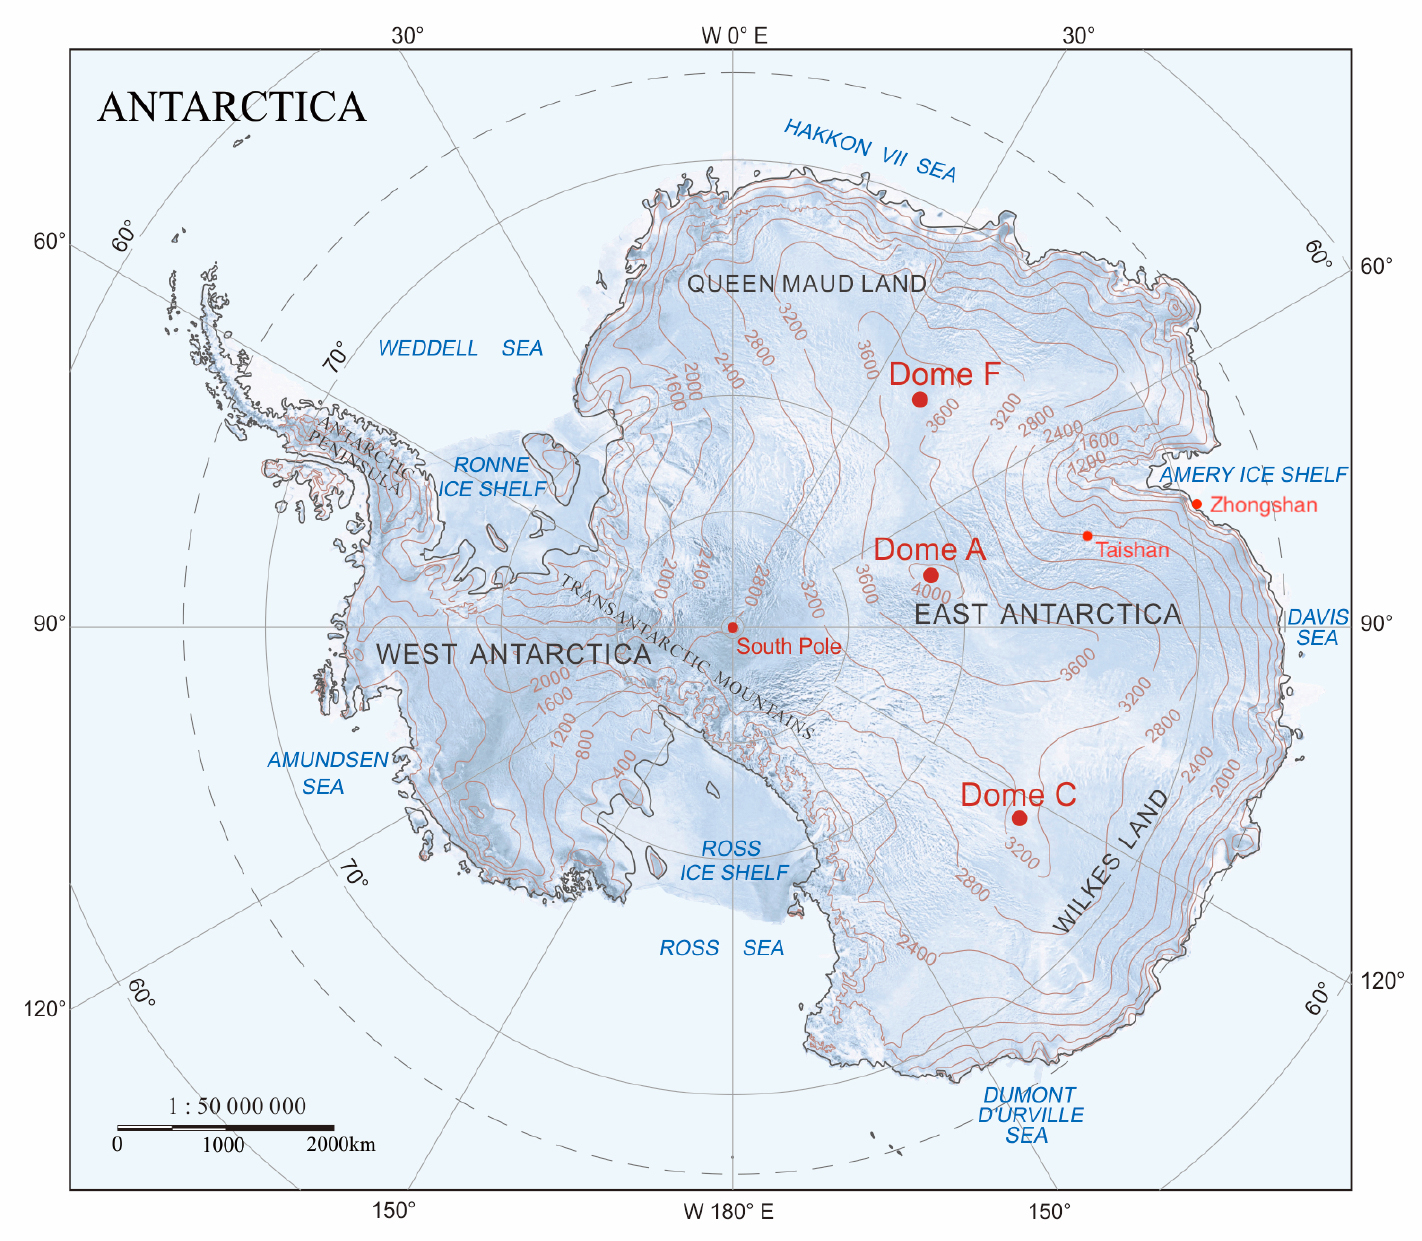
Fig. 1 Map of Antarctica with elevation contour lines. Marked on the map are Dome A, C, F, and the South Pole as well as Chinese Zhongshan and Taishan Stations. Courtesy of Xiaoping Pang and Shiyun Wang.
Download figure:
Standard imageTable 1. Locations and Elevations of Some Sites on the Antarctic Plateau
| Site | Latitude | Longitude | Elevation | Station |
|---|---|---|---|---|
| Dome A | 80°22'S | 77°21'E | 4093 m | Chinese Kunlun Station |
| Dome C | 75°06'S | 123°20'E | 3233 m | French-Italian Concordia Station |
| Dome F | 77°19'S | 39°42'E | 3810 m | Japanese Dome Fuji Station |
| South Pole | – | 90°00'S | 2835 m | US Amundsen-Scott Station |
There are many advantages of doing astronomy in Antarctica, especially at those high domes (Storey 2005, 2007; Ashley 2013). The air is super clean with minimal scattering light. More importantly, temperature inversion near the ground often occurs, resulting in a stable atmosphere when cooler air stays under warmer air. When coupled with low wind shear, this can lead to very good astronomical seeing above a shallow surface layer (or ground layer) of turbulence.
Moreover, the low temperature guarantees low thermal background greatly benefiting infrared (IR) observations. For sub-millimeter (sub-mm) wavelengths or terahertz (THz) frequencies (1mm ≡ 0.3 THz), extremely cold weather results in extremely dry air and thus low perceptible water vapor (PWV) which allows sub-mm radiation to have a higher transmission rate through atmosphere and reach ground more easily. Another obvious advantage is the continuous dark time during polar nights for time-domain astronomy which is becoming more and more important. The merits of potential observatory sites, including the ones in Table 1, were compared using limited measurements available and satellite data (Saunders et al. 2009). There has been huge progress since then, especially for Dome A.
South Pole station has hosted many astrophysics experiments mainly in studies of cosmic microwave background (CMB) and neutrinos since 1990s. The neutrino experiment IceCube is currently the largest astronomical facility in Antarctica. There is also the 10-meter South Pole Telescope (SPT) for studies in microwave, millimeter, and sub-mm wave bands, while BICEP and Keck Array are specifically for CMB studies. Early experiments in the infrared reported sufficiently low IR sky background – from 2.2 μm longwards the IR sky is between 20 to 100 times darker than that at a temperate latitude site (Ashley et al. 1996; Phillips et al. 1999). However, measured optical seeing is poor at South Pole with a mean value of 1.8'' (Marks et al. 1999; Travouillon et al. 2003). Nevertheless, a 8 cm small optical telescope SPOT was operated at South Pole station from 1983 to 1988 (Chen et al. 1986; Taylor et al. 1988), but a proposed larger version (0.4 m) does not seem to have ever been built (Chen et al. 1992).
At Dome C, a median optical seeing of 0.27'' was first reported in 2004 (Lawrence et al. 2004) and later studies estimated it to be 0.23'' – 0.36'' above a boundary layer with a typical height of 30m (Agabi et al. 2006; Trinquet et al. 2008; Aristidi et al. 2009). Very low PWV level of 0.1–0.3mm were also found in winter (Tremblin et al. 2011). Along with the extensive site assessment, scientific studies have also been carried out, mostly in time-domain astronomy. Designed for exoplanet search (Daban et al. 2010), ASTEP-400 is a 40 cm optical telescope with a field-of-view (FOV) of 1 deg2 and has found 43 transit exoplanet candidates (Mékarnia et al. 2016) as well as variable stars (Mékarnia et al. 2017). Its pathfinder, ASTEP-South (Crouzet et al. 2010), has an aperture of only 10 cm and a large FOV of 3.88° × 3.88°. ASTEP-South operated between 2008–2011 and ASTEP-400 worked from 2010 to 2013, and both contributed to optical site testing as well as studies of variable stars (Crouzet et al. 2016, 2018). IRAIT, a 80 cm infrared telescope, was proposed (Tosti et al. 2006) and started to work in 2013 with a mid-IR camera for 1.25–25μm and a sub-mm (terahertz) camera for 200 and 350μm (Durand et al. 2014). The IRAIT also has a pathfinder, small-IRAIT, working in the optical with an aperture of 25 cm and an FOV of 8' × 5.3' (Strassmeier et al. 2008). Larger 2m class optical/infrared telescopes were also proposed for Dome C, such as PILOT (Burton et al. 2005) or PLT (Epchtein et al. 2011; Abe et al. 2013) which are yet to be realized.
Site testing at Dome F has been conducted since 2000s. Atmospheric transparency at 220 GHz was measured with a tipping radiometer and a PWV of 0.6mm was reported for the 1-month period in 2006 summer (Ishii et al. 2010). Optical seeing was also measured during the austral summer of 2012/2013 for about 20 days, showing obvious diurnal variation at a height of 11 m. Although the median seeing value is 0.52'', very good seeing below 0.2'' was also recorded (Okita et al. 2013). TwinCAM, consisting of two 10 cm optical telescopes, was initially installed at Dome F for exoplanet search. Larger experiments involving a 40 cm infrared and a 30 cm THz telescopes were proposed (Ichikawa 2010). An even larger 2m class optical/infrared telescope is under consideration (Ichikawa & Obata 2016).
Dome A, the highest location on the polar ice cap, was first visited by humans in January 2005 via overland traverse from Zhongshan Station by the 21st Chinese National Antarctic Research Expedition (CHINARE). CHINARE is managed and carried out by Chinese Arctic and Antarctic Administration (CAA) and Polar Research Institute of China (PRIC). The distance between Dome A and Zhongshan Station located at coast is about 1200 km (Fig. 1). The Chinese astronomy community considered this as a viable opportunity for ground-based astronomical research and reached an agreement of eventually developing an observatory at Dome A based on its unique merits. The Chinese Center for Antarctic Astronomy (CCAA) was established in 2006 to coordinate relevant planning and activities. As the start, CCAA joined the second traverse to Dome A with the 24th CHINARE during the austral summer of 2007/2008. Later, the construction of Kunlun Station at Dome A started in 2009 which will be developed into a winterover station in the future.
During the past decade, there have been lots of developments at Dome A in site testing, astronomical research, as well as instrumentation for harsh environment in Antarctica, all of which are reviewed in this paper of the special issue (Wang & Ip 2020). We start with the timeline of the development in astronomy at Dome A, together with introducing all the experiments and instruments in Section 2. We summarize the time-domain research conducted at Dome A in Section 3 and review the results of site testing in Section 4. Instrumentation and future plans are discussed relatively briefly at the end. Earlier reviews before 2010 on astronomy and astrophysics from Antarctica in general can be found in Storey (2005) and Burton (2010).
2. Timeline and Instruments
The CHINARE has visited Dome A every 1–2 years since its 2nd traverse with scientific research in the areas of astronomy, glaciology, subglacial geology, climatology, atmospheric physics, and surveying and mapping, etc. Hundreds of tons of fuel, construction materials and scientific equipment were transported by an over-ice tractor convoy and a team of usually about 20 members each time. Given the complications, it usually took about 20 days from Zhongshan Station to Dome A and the expedition team was able to work for only about 3 weeks on-site until late January or early February before the temperature dropped too low. The Chinese astronomy community has joined every traverse to Dome A since the 24th CHINARE and managed to establish and run an unattended, fully robotic observatory near Kunlun Station with international collaborations. All the devices and instruments have to work fully automatically, with remote monitoring and communication via Iridium satellites, until next traverse for necessary servicing. This has been a great challenge for instrumentation and operation.
Table 2 summarizes astronomy-related facilities, instruments, and devices during each CHINARE. We try to compile the information as complete as possible in order to serve as background information as well as for future reference.
Table 2. Timeline of Traverses and Instruments at Dome A
| CHINARE & Year | Membersa | New Facilities & Instruments | Instruments removed |
|---|---|---|---|
| 24th (2007/2008) | 2 | PLATO, CSTAR, Pre-HEAT, Gattini, Snodar, DASLE | |
| 25th (2008/2009) | 1 | Nigel, Snodar2, SAVER | |
| 26th (2009/2010) | 2 | FTS, HRCAM, SHABAR | Snodar |
| 27th (2010/2011) | 2 | KLAWS, DIMM, SEU Platform | SHABAR, DIMM |
| 28th (2011/2012) | 4 | AST3-1, PLATO-A, DIMM | CSTAR, Gattini, HRCAM, SEU Platform, DIMM |
| 29th (2012/2013) | 3 | HRCAM2 | Nigel |
| 30th (2013/2014)b | - | - | - |
| 31st (2014/2015) | 2 | AST3-2, KLAWS-2G, NIRSPEC, CSTAR-II | FTS |
| 32nd (2015/2016) | 2 | Webcams, Wind turbine | HRCAM2, NIRSPEC |
| 33rd (2016/2017) | 4 | KLCAM | AST3-1, PLATO, Snodar2, DASLE, KLAWS |
| 34th (2017/2018)b | - | - | - |
| 35th (2018/2019) | 4 | KL-DIMM, nKLAWS-2G, KLCAM2, KLCAM3 | CSTAR-II, Microthermal |
| NISBM, MARST, Microthermal | |||
| 36th (2019/2020)b | - | - | - |
aNumber of members in the traverse team from astronomy community; bNo Dome A traverse.
2.1. The 24th CHINARE
This was the first time astronomers stepped into Dome A. With collaborations of scientists from China, Australia, and the US, this laid down the foundation of astronomical research at Dome A. The site for astronomy was selected to be about 150m west of the planned Kunlun Station to avoid possible contamination or adverse impacts in the future. An array of instruments for both site testing and astronomical observation as well as supporting facilities were installed, as described below (Fig. 2). A more detailed summary can be found in Yang et al. (2009).

Fig. 2 A photo showing the astronomy site and instruments in late 2009 during the 26th CHINARE. The white instrument installed on the side wall of the PLATO IM is Pre-HEAT. Gattini was installed on the roof of the IM. The second Snodar (silver) is behind the first one (black).
Download figure:
Standard imageIn the years followed, instruments had been serviced, upgraded, or decommissioned, and new instruments had been installed until 2012 (the 28th CHINARE) when new site for astronomy was established. The old site was completely cleaned and all instruments removed in 2017 during the 33rd CHINARE.
2.1.1. PLATO
Based on their expertise and experience from South Pole and Dome C, Australian scientists from the University of New South Wales (UNSW) built for Dome A the PLATeau Observatory (PLATO), which is a self-contained automated facility that provides power and satellite communications for itself and other instruments. PLATO was designed to be extremely reliable and robust to withstand the very low temperature, high altitude, high relative humidity, and the constraint that servicing is only available at most once a year (Lawrence et al. 2008; Luong-Van et al. 2008; Ashley et al. 2010a).
The main components of PLATO included an engine module (EM), an instrument module (IM), and solar panels that supplemented the six redundant diesel engines in the EM. The IM housed a battery bank, power supplies, and the control and communication computer systems, such as the "Supervisor" computers. It was also the place to host electronics and computers that operated various instruments mounted either on the IM roof (or wall) ports or externally placed on the snow surface. The IM had an active thermal management system and could keep the inside temperature well above –20°C, higher than the working temperatures of customized electronics and computers. There were also webcams monitoring the instruments and engines.
The EM was placed about 50m away from the IM to prevent the instruments from being affected by exhaust stream or vibration. PLATO had a 4000-liter fuel tank in the EM, designed for continuous operation through a winter and could in general provide power of 1kW in average for everything. This is a strong constraint and introduces more challenges in developing instruments (Sect. 5).
Currently, the communication at Dome A can only be available via the Iridium satellite network with a limited data allowance of hundreds of MBytes per month depending on the data plan, beyond which the data transferring becomes very expensive. Necessary control and monitoring data are transferred to and from Dome A, but not the raw data from observations which have to be retrieved until next traverse because of the data amount. However, the raw data can be processed on-site in real-time and the results, with a much small data volume, can be downloaded so as not to delay research.
2.1.2. CSTAR
Chinese Small Telescope ARray (CSTAR) was the first-generation optical telescope at Dome A (Fig. 3). Its design focused on simplicity and reliability, and eliminated any moving parts, as it would be operated in an unknown world for the first time (Yuan et al. 2008; Zhou et al. 2010a, 2013). CSTAR consists of four identical 14.5 cm Schmidt-Cassegrain wide-field telescopes (effective aperture of 10 cm), for partial redundancy, with a large focal ratio of f/1.2. Each telescope was equipped with an Andor DV435 1k×1k CCD camera with 13μm pixels, resulting in a plate scale of 15'' pixel−1 and an FOV of about 20 deg2. The CCD cameras were operated in frame-transfer mode to eliminate the need of mechanical shutters. Each telescope had a different filter: g, r, i, or clear. They were co-aligned and all pointed to the south celestial pole (SCP). Each telescope had a separated sealing window coated with Indium-Tin-Oxide (ITO) conductive film that can draw a power of about 10W for defrosting when needed.
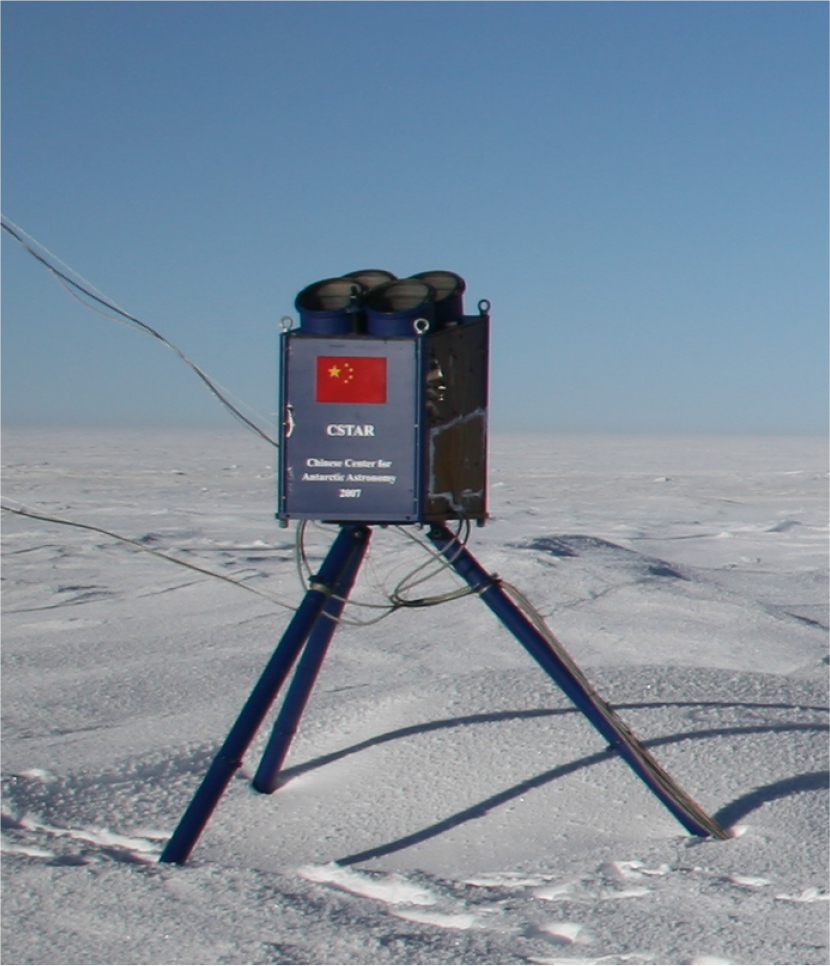
Fig. 3 CSTAR in late 2009 during the 26th CHINARE.
Download figure:
Standard imageCSTAR was the first Chinese instrument and a key instrument for site testing to monitor sky background, extinction (cloud), etc. Its data are also useful for time-domain astronomy.
CSTAR started to observe autonomously and continuously in March 2008 and the exposure time was set to 10–30 s. Such a high cadence on a single field was unprecedented. The data were retrieved during the next traverse and have been used for studies of variable stars as well as evaluating the optical sky background and extinction, etc. (Zhou et al. 2010b; Zou et al. 2010). The data have also showed that three of the four telescopes were out of focus possibly because of the vibration during the journey to Dome A, only the i-band telescope remained well focused (but no data in 2009 for some reasons). Efforts were made to refocus the telescopes on-site during the following visits to Dome A, but without success, because of the large focal ratio and the difficulties of working during the daytime at Dome A. CSTAR was taken back in early 2012 during the 28th CHINARE for upgrading.
2.1.3. Pre-HEAT
The first sub-mm instrument at Dome A was Pre-HEAT (Kulesa et al. 2008; Yang et al. 2009). It had an aperture of 20 cm and operated at 600 GHz (450 μm) with a Schottky diode heterodyne receiver and a digital Fast Fourier Transform (FFT) spectrometer. It was installed on one side wall of PLATO (Fig. 2), measuring the 450μm sky opacity and mapping the Galactic Plane in the 13CO J = 6-5 line at 661 GHz with an angular resolution of 10' (Yang et al. 2010). Pre-HEAT started to work in January 2008 for one season.
Pre-HEAT was a technological prototype of the 60 cm High Elevation Antarctic Terahertz (HEAT) telescope which was later installed at "Ridge A" in 2012, about 150 km southwest of Dome A (Walker et al. 2004; Kulesa et al. 2013).
2.1.4. Gattini
Gattini was another optical instrument for monitoring the sky brightness, cloud cover, aurora, and airglow (Moore et al. 2008; Yang et al. 2017). Earlier versions of Gattini had operated successfully at Dome C. Gattini at Dome A had one narrow-field Gattini Sky Brightness Camera (GSBC) and one wide-field Gattini All-Sky Camera (GASC). Each camera used an Apogee 2k×2k interline USB CCD array. The GSBC used a Nikon lens with a 75mm aperture and a focal length of 300 mm (Nikon Telephoto AF-S Nikkor 300mm f/4D ED-IF), resulting in a plate scale of 5'' pixel−1 and an FOV of 2.8° × 2.8° centered on the south celestial pole. It was equipped with Sloan filters g', r' and i'. The GASC used a Nikon wide-field lens with a focal length of 10.5 mm, giving a pixel scale of 145.4'' pixel−1 and a large FOV of 90° × 90°, looking toward zenith. The GASC was equipped with Bessell filters B, V, R, and a longpass red filter for the detection and monitoring of OH emission.
Gattini was installed on the roof of PLATO IM. Due to some technical problems, it did not obtain data for the first winter season. After a servicing mission in the next year, Gattini worked through the entire winter of 2009 and was decommissioned with data retrieved during the 26th CHINARE.
2.1.5. Snodar
Snodar (Surface layer NOn-Doppler Acoustic Radar) was developed specifically for Dome C and Dome A to measure the height and intensity of the atmospheric boundary layer where most of the optical turbulence exist on the Antarctic plateau. Above the boundary layer, free-atmosphere turbulence is extremely low and thus gives rise to very good seeing. Snodar is a monostatic high-frequency acoustic radar with a minimum sampling height of 8m and a vertical resolution of 0.9 m. It operated at frequencies between 3–15 kHz and is sensitive to profile optical turbulence to a height of 180m every 10 s (Bonner et al. 2008, 2010).
Snodar worked for one week for the first season. A second Snodar was deployed to Dome A the next year and obtained excellent data through the winter of 2009 (Bonner et al. 2010).
2.1.6. DASLE
There was also the Dome A Surface Layer Experiment (DASLE) that was designed to measure the temperature and 3D wind velocity, so as to study the meteorological conditions, the intensity and vertical extent of the boundary layer (Yang et al. 2009). DASLE had a mast of 17m tall with fast sonic anemometers mounted at 4 m, 8 m, and 16m heights.
DASLE mast and sensors were successfully installed by the traverse team and data were collected for one month. The data showed that the anemometer on the top level was damaged in transit and the other two suffered ice formation due to problems with the power supply of the deicing heater. The problem was never fixed and DASLE was removed in 2017 with all other instruments on PLATO.
2.2. The 25th CHINARE
PLATO had worked autonomously for 204 days at Dome A for the first season, but stopped in mid-August 2008 before the traverse team of the 25th CHINARE arrived in late 2008 for the servicing mission.
The team put a lot of efforts on maintaining PLATO and this has become a routine for every following visit. The maintenance included engine replacement, oil change, and exhaust pipe replacement, etc. in the EM, and necessary work on the computers, electronics, Iridium system, battery bank, and solar panels, etc. on the IM side. The batteries in the IM needed to be replaced every 1-2 years.
CSTAR and Pre-HEAT were also maintained and Gattini was replaced. A second new Snodar was installed and the first one was repaired. New instruments and devices were also deployed (see below).
Construction of Kunlun Station began in 2009 during this traverse.
2.2.1. Nigel
Nigel was an optical/near-IR grating spectrometer operating in the wavelengths of 300–850 nm to monitor sky background, airglow and aurorae (Sims et al. 2010, 2012a). Nigel was fiber fed with no additional optics, looking at three fixed positions: North at 40° altitude, West at 71.5° altitude, and the zenith. A stainless steel sphere with a diameter of 12 cm held the fibers and was mounted on the roof of PLATO IM. Signals were fed through the fibers to the spectrometer inside IM. Each fiber has an FOV of about 25° in diameter. A thermoelectrically-cooled 256×1024 pixel CCD camera is used to record the spectra with a resolution of 3 nm FWHM at 500 nm (R ∼ 170).
2.2.2. SAVER: shock and vibration recorder
As the transit to Dome A, especially during the overland traverse, is very rough, some instruments and sensors had been damaged or become defective. A portable Lansmont SAVER 3X90 Field Data Logger was employed to record the data in transit. It had a magnetic mounting bracket and could be easily installed on a shipping container with instruments. The data collected over years have been very useful in planning future transportation of instruments as well as instrument designs (Wen et al. 2012).
2.3. The 26th CHINARE
PLATO was still working when the traverse team arrived at Dome A. This demonstrated the reliability of the system and the feasibility of running an unattended observatory remotely in Antarctica. Routine maintenance similar to the previous one was performed for PLATO (Sect. 2.2).
The team brought a collimator in another attempt to refocus three of the four telescopes of CSTAR during the daytime (Sect. 2.1.2), but data obtained in winter showed that the problems were not entirely solved. A webcam was installed to look at the windows of CSTAR, confirming snow accumulation, instead of clouds, when the extinction of images became large.
Gattini and the second Snodar were maintained while the first Snodar was decommissioned. Pre-HEAT stopped working sometime and was decommissioned, but not uninstalled.
To prepare for future Antarctic Survey Telescopes (AST3, Sect. 2.5.1), the team selected a new site for astronomy, further away from Kunlun Station and about 250m west of the current site. Since AST3 telescopes are much larger and heavier than CSTAR, they could not be simply put on snow surface. A 20 m×20m foundation was prepared for AST3 by digging to a depth of 1.5m in average, backfilling to make the snow harder and increase the capacity of the foundation (Yuansheng Li, private communications), and finally using a 23-ton heavy tractor as a roller compactor. The first AST3 telescope was installed at this site two years later. During this traverse, some new instruments were installed as described below (Fig. 4).

Fig. 4 Part of the roof of PLATO IM, showing some instruments maintained or newly installed during the 26th CHINARE.
Download figure:
Standard image2.3.1. FTS
The Fourier Transform Spectrometer (FTS) was a polarizing Michelson interferometer working in terahertz regime 750 GHz – 15 THz with an instrumental resolution of 13.8 GHz (Shi et al. 2016). It measured atmospheric radiation covering the entire water vapor pure rotation band from 20μm to 350μm and reveal the atmospheric transmission throughout the band. The FTS was installed on one roof port of PLATO IM (Sect. 2.1.1), with the observing window and calibration blackbody, etc. on top of the roof and the interferometer mounted on the ceiling inside. A webcam was installed on the roof to monitor the operation of the external moving parts — while the blackbody rotated in and out above the window for calibration, a brush on the other side could also clean the snow/frost off the window.
FTS operated from January 2009 for two seasons of a total 19 months before it was decommissioned.
2.3.2. HRCAM
The High Resolution CAMera (HRCAM) was an all-sky camera, built with a Canon EOS 50D digital SLR camera and a Sigma 4.5-mm f/2.8 fish-eye lens (Sims et al. 2013). It took images every few minutes with a full sky coverage, and the cadence was mostly limited by the lifetime of the camera's shutter. HRCAM was placed on the roof of PLATO IM (Fig. 4). A special enclosure was designed for the camera, lens, an ARM-based computer, and electronics to cope with the low temperature down to –80°c. The data from HRCAM are useful for evaluating the fractions of time of clouds and aurorae, however, the data did not cover a period long enough for statistics during the two seasons of operation.
2.3.3. SHABAR
SHABAR stands for SHAdow-BAnd Ranger, an instrument to measure scintillation from an extended source such as the Sun (Beckers 2001; Tokovinin 2007). When it is used for the Moon, it is also referred as Lunar Scintillometer (Hickson & Lanzetta 2004). It uses multiple photo-diodes arranged in a linear configuration. Correlated intensity fluctuations at any two detectors reflects the turbulence at a height corresponding to the baseline of the two detectors. With different baselines, SHABAR can profile the vertical structure of the turbulence.
The Dome A SHABAR had six photo-diodes attached to a single Invar base plate with a maximum baseline of 40 cm. It was installed at an edge of the IM roof facing north, with its electronics inside PLATO (Fig. 5). It shared a computer with CSTAR and was tested to function properly. Some data were collected in winter when the Moon was up, but it started to have problems in July 2010. It was found the next year that the windows in front of the photo-diodes were broken, possibly due to the low temperature in winter. Other problems were not solved on-site and SHABAR was therefore uninstalled.
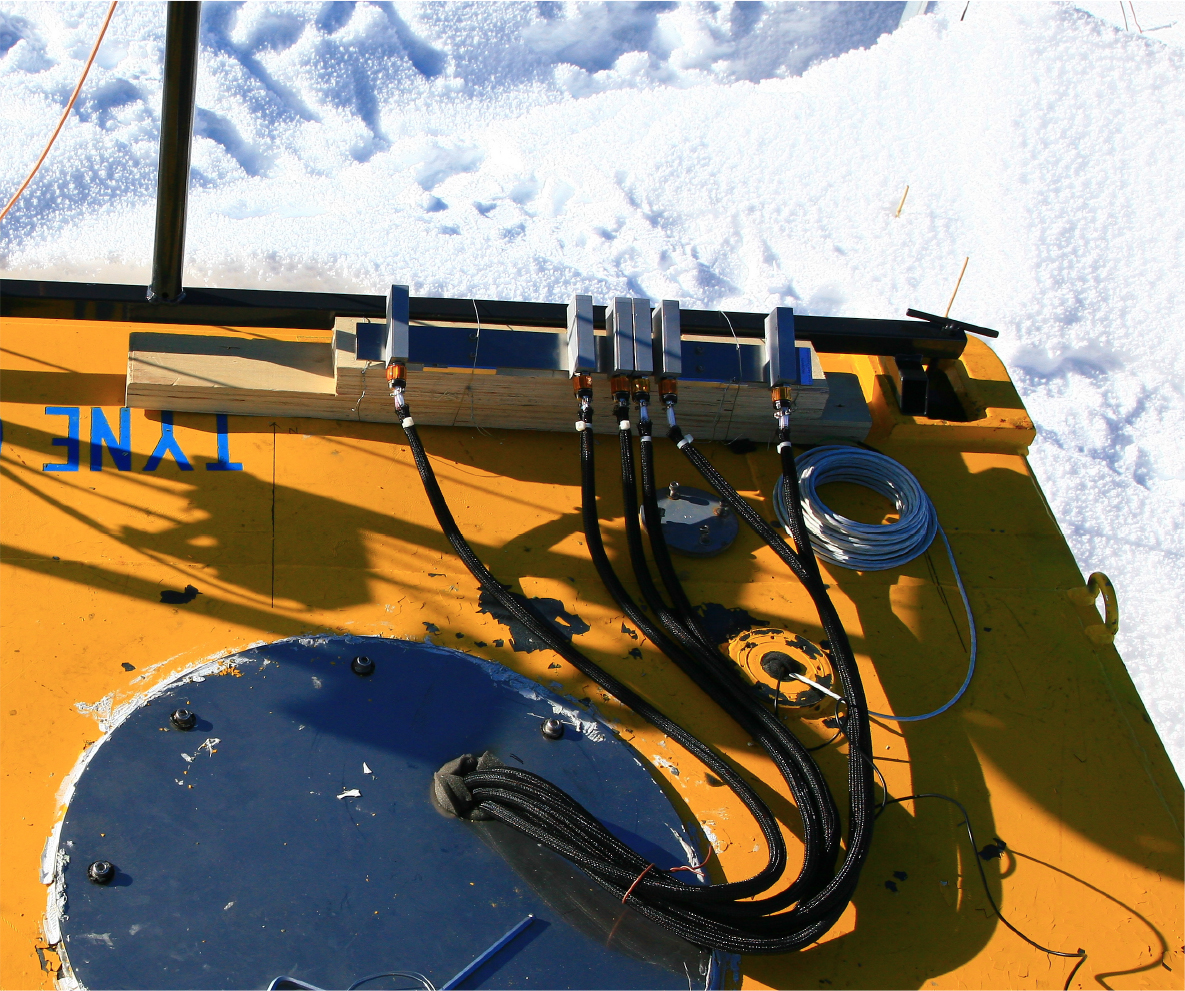
Fig. 5 Dome A SHABAR was installed at an edge of the roof of PLATO IM.
Download figure:
Standard image2.4. The 27th CHINARE
PLATO worked through the winter again and the team serviced it and replaced necessary parts like before for next year. CSTAR, Gattini, Nigel, and Snodar were also serviced, and SHABAR was checked and decommissioned because of problems that could not be fixed. A full year data was retrieved from FTS which continued to work well.
The team brought a DIMM in an attempt of daytime seeing measurement (Pei et al. 2010, 2012), but was not successful due to technical issues.
The KunLun Automatic Weather Station (KLAWS) and a new facility, SEU Platform, developed by CCAA and Southeast University (SEU), were deployed during this traverse.
2.4.1. KLAWS
KLAWS was a collaborative scientific project involving CCAA, UNSW, and PRIC. It was not a tradition weather station for meteorology studies, it had a 15 m-tall mast with a higher vertical resolution of temperature and wind — temperature sensors at nine heights from –1m to 14.5 m, and propeller anemometers at four heights (Hu et al. 2014). This was designed to profile the low boundary layer at Dome A.
KLAWS began operation as soon as it was set up, performed well for a full year, and collected very valuable data for us to understand Dome A, especially in winter. The traverse team of the 28th CHINARE found that its mast fell partially like an arch and they were not able to fix it. It is also believed that its power and data cables were damaged accidentally and unknowingly before the team left. A web page was developed to show the weather condition at Dome A in real-time and historical data from KLAWS are also available1.
2.4.2. SEU platform
As more instruments were installed at Dome A, demands for power and logistic support became larger, especially with considerations of future development of the observatory. SEU Platform was designed as a PLATO-like self-contained facility of similar size, providing 1kW power in average and communication via Iridium network for unattended instruments at Dome A.
Before being deployed to Dome A, the platform was tested for a few months at the remote Yangbajing, Tibet (4300m altitude) for low-pressure condition, automated operation, and its overall performance. It was then successfully installed at Dome A and operated for more than 50 days before it stopped unfortunately due to a problem, likely a software glitch as concluded later (private communications). It was uninstalled from Dome A the next year and brought back to Zhongshan Station, and back to CCAA after a few years. New versions of the platform have been tested at Taishan Station.
2.5. The 28th CHINARE
This expedition and traverse marked another milestone of astronomy at Dome A. The first Antarctic Survey Telescope AST3-1 (Fig. 6) was installed and operated at Dome A on the new site for astronomy, 240m west of the old site (Sect. 2.3). A new supporting facility PLATO-A was also deployed with AST3-1 (Fig. 7).
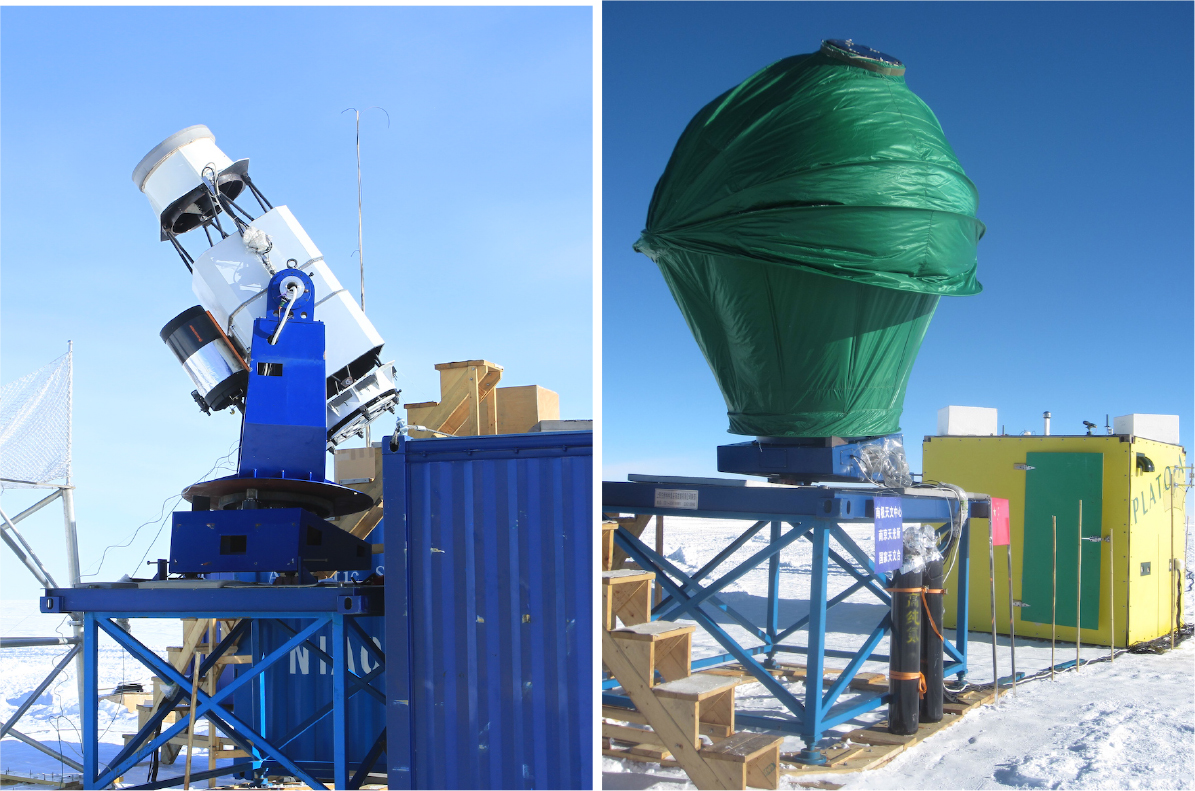
Fig. 6 AST3-1 during its installation without and with the dome. The small telescope tube attached to AST3-1 is the DIMM. Courtesy of Fujia Du and Zhengyang Li.
Download figure:
Standard image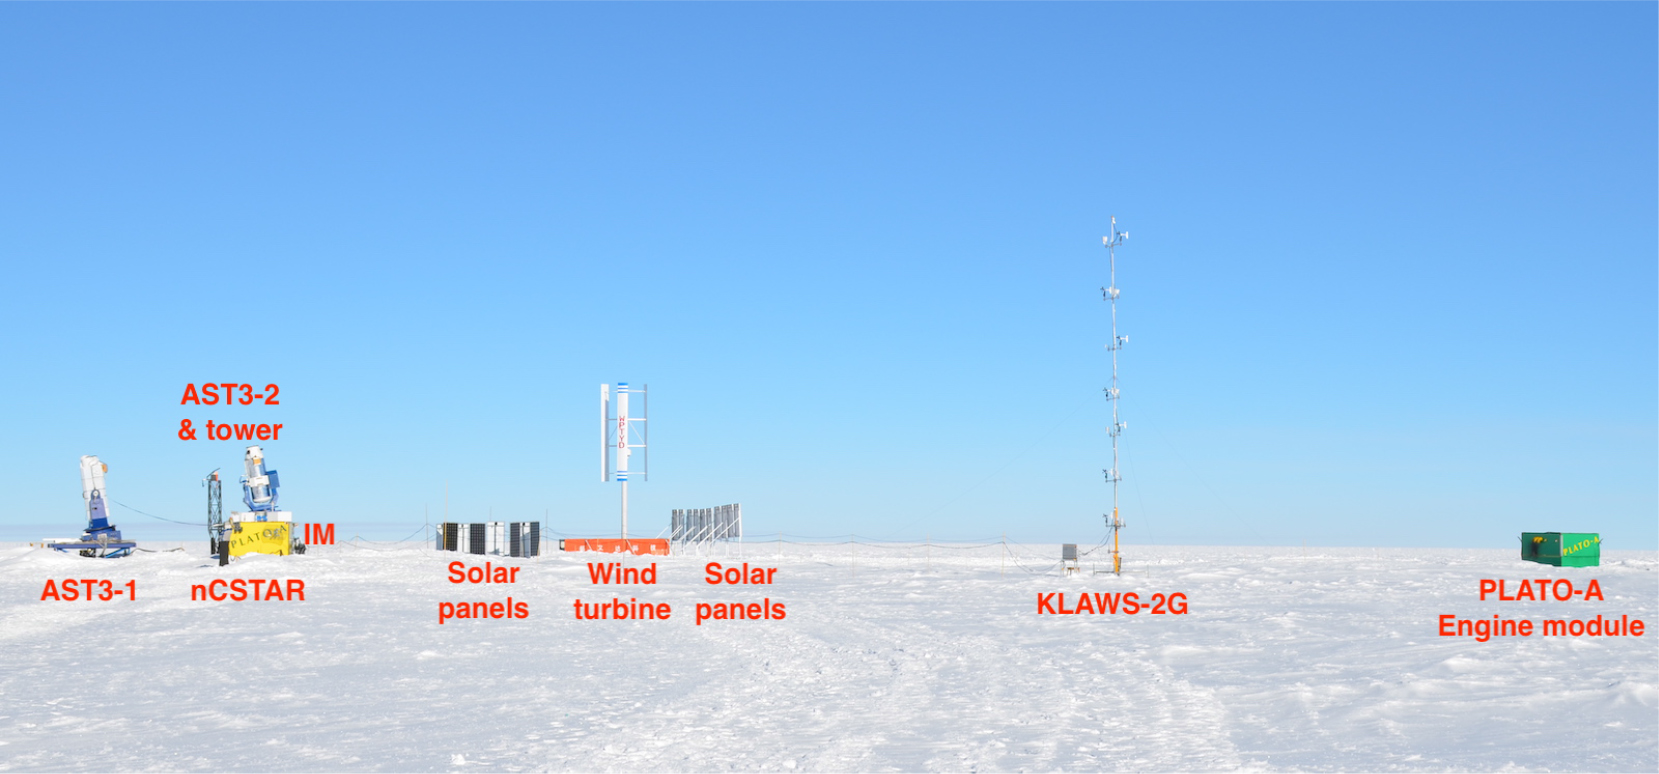
Fig. 7 A photo showing the instruments at the new astronomy site in early 2016 during the 32nd CHINARE. The CSTAR-II is small and in front of the AST3-2 tower. Courtesy of Ce Yu.
Download figure:
Standard image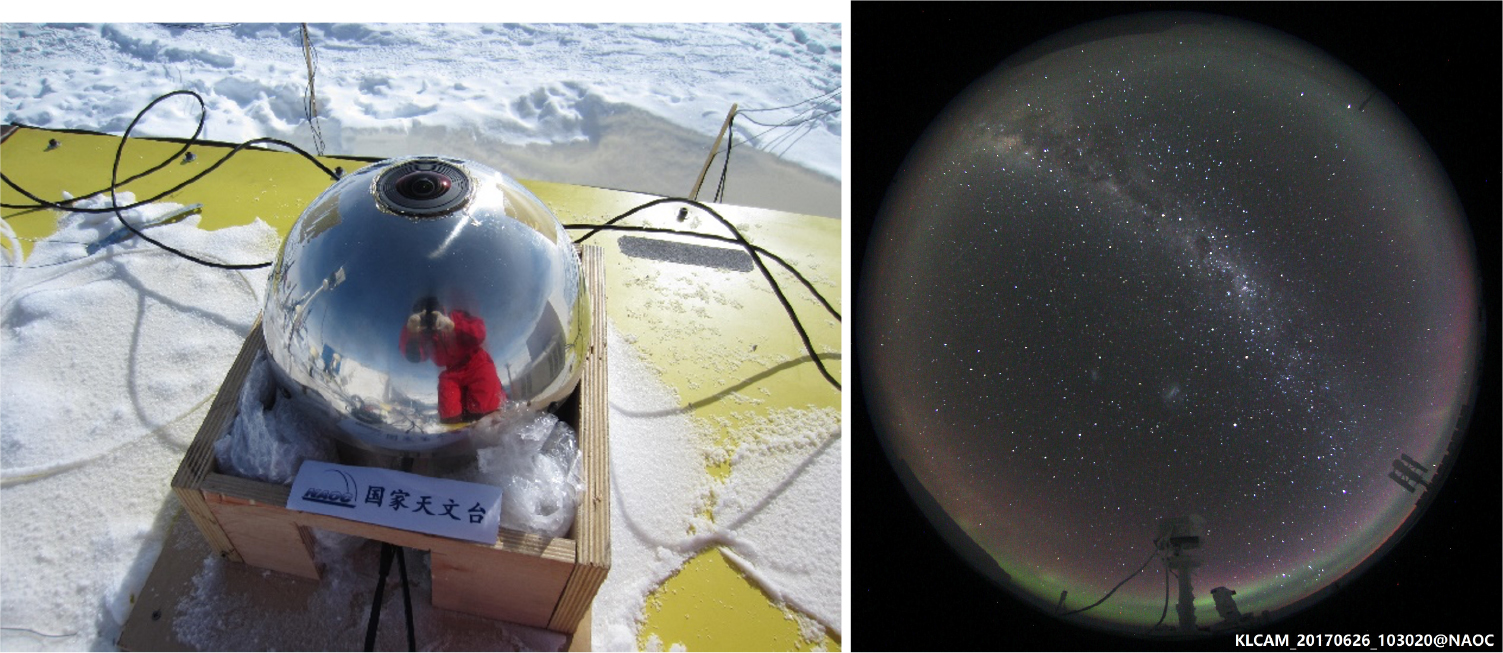
Fig. 8 Left: KLCAM on the roof of PLATO-A IM. Right: A typical all-sky image taken by KLCAM. The Milky-way, LMC, and SMC are visible. Around the horizon are aurorae in green and purple. At the bottom are a webcam on the roof and AST3-2 in the background. The wind turbine appears at the lower-right corner. Courtesy of Bin Ma and Xu Yang.
Download figure:
Standard imageThe team brought a DIMM tube again for daytime seeing measurements (Pei et al. 2012). It was installed on the larger telescope tube of AST3-1, sharing the mount. They managed to obtain daytime seeing measurements for the first time for 3 days (Sect. 4.2).
At the old site, the mast of KLAWS fell partially like an arch and could not be fixed. Its power and data cables were also damaged later (Sect. 2.4.1). FTS and Snodar, as well as the old PLATO, were maintained, but did not really work again for some reasons. The old site for astronomy was virtually decommissioned during this traverse.
The team uninstalled CSTAR, Gattini, and the SEU Platform and brought them back.
2.5.1. The AST3 project
AST3 is the second-generation optical telescope project of CCAA. The project was designed to run three identical 50 cm telescopes (Cui et al. 2008) with different filters simultaneously, so as to obtain multi-color light curves for early SN discovery, exoplanet search, and other time-domain studies (Fig. 6).
The AST3 telescopes, with full pointing, tracking, and focusing capabilities, have a modified Schmidt design, achieving a wide FOV as well as a good image quality with 80 per cent of a point source's energy encircled within 1''. Each telescope has an entrance pupil diameter of 50 cm and a focal ratio of f/3.73 (Yuan et al. 2010; Yuan & Su 2012).
Each telescope is equipped with an STA1600FT CCD camera built by Semiconductor Technology Associates, Inc (STA). Each camera has a single-chip CCD of 10560×10560 9μm pixels, giving a plate scale of 1'' pixel−1. To minimize mechanical failure in winter, there is no shutter for the camera. Instead, the camera is operated in frame-transfer mode, using the top and bottom 10560×2640 areas as buffers and the central 10560×5280 pixels as the exposing area. This results in an effective FOV of 2.92° × 1.46° (4.26 deg2). The CCD cameras went through detailed lab tests in order to thoroughly understand their performance as they cannot be easily accessed once they were deployed to Dome A with the telescopes (Ma et al. 2012). A rare problem was found and studied that the photon transfer curve became non-linear at a level around just 25000 ADU, causing the brighter-fatter effect, and could affect photometry of bright sources (Ma et al. 2014a). Other special treatments have also been studied for data reduction of AST3 images (Ma et al. 2014b; Wei et al. 2014) and will be discussed in Section 3.1.
A dedicated and customized Control, Operation and Data System (CODS) was developed to run the unattended AST3 automatically through winter at Dome A (Shang et al. 2012, 2016). CODS had three subsystems: a main control system (MAIN) a data storage array (ARRAY) and a pipeline system (PIPE). Each subsystem has an identical backup for redundancy (Sect. 5). Over years, a suite of software has also been developed and optimized for AST3, such as survey planning (Liu et al. 2018c), real-time photometry pipeline, etc., as well as a sophisticated operation management system that can be used for any robotic observatory (Hu et al. 2016, 2018).
As designed for AST3 to run at Dome A, everything for the operation, from observation planning to data reduction, had to be fully automated. To do so, CODS communicates, through MAIN, to the telescope via a native software that actually drives the telescope (Li et al. 2012a; Li & Wang 2013), takes exposures with CCD, distributes raw images to ARRAY for permanently storage and to PIPE for real-time photometry, and sends transit candidates and alerts back to NAOC to display on a web page for further confirmation and decisions on follow-up observations. A more detailed description of the survey automation and data reduction can be found in Ma et al. (2020b).
AST3-1 had an i-band filter and the second telescope AST3-2, installed in 2015 during the 31st CHINARE (Sect. 2.7), was equipped with two filters (i and R-bands). For the future, the third telescope AST3-3 has a modification by adding a fold mirror to move the focal plane outside the tube. This could largely solve the problem of CCD heat dissipation to improve tube seeing (Sect. 2.7.1), simplify the camera mounting and maintenance, and give the possibility of adding an IR camera (Lawrence et al. 2016).
2.5.2. AST3-1
The functionality and operation of AST3-1 were confirmed during a testing period of a couple of months at Xuyi Station of Purple Mountain Observatory (PMO) right before it was deployed to Dome A. An altazimuth mount was used for AST3-1 during the test because its equatorial mount was designed specifically for the latitude of Dome A. Very short time exposures showed good and uniform image quality, demonstrating that the optical system was assembled and aligned well (Li et al. 2012b). Data reduction and analysis of the first AST3 images was also done. The camera of AST3-1 had an engineering-grade CCD as no science-grade CCD was available by STA then. The camera was replaced with one with a science-grade CCD three years later during the 31st CHINARE.
AST3-1 was installed at Dome A in January 2012 on a 1.5 m-tall platform (Fig. 6) placed on the foundation prepared during the 26th CHINARE. The top of the telescope can reach up to 4 m. Having developed a new method using no star during the daytime (Li et al. 2012b; Li & Yuan 2014), the team did an excellent job aligning the telescope and its optics.
A light, tent-like foldable dome covered the body of the telescope, leaving the mirror outside, and moved with the telescope (Yuan et al. 2010). The dome was designed to keep snow away from the telescope, however, it seemed to be problematic for telescope tracking and moving when there were gusts. It was adjusted the next year and was eventually removed during the 32nd CHINARE when the problem was further confirmed.
A first version of CODS was also deployed to conduct the observing. The commissioning started in early March 2012 when there was twilight and confirmed the good image quality and alignment of the telescope. The polar axis of the telescope was only off by 0.7° which was small compared to its large FOV, and the pointing was improved to better than tens of arcseconds after a pointing model was established with observing data and the tpoint2 software.
Later it seemed that the mechanical part of the telescope suffered some problems — the telescope could stop moving sometimes in the declination (Dec) direction during tracking while the right ascension (RA) axis worked well. This was attributed to possible icing in the gears and also some deformation of the Dec axis during transportation (Yuan et al. 2014). Therefore, although CODS was designed to run an automated survey, manual operation had to be done remotely from NAOC and a team of more than 20 people from AST3 collaboration were involved in the 24-hour non-stop operation. Valuable data were obtained for the first season for about 50 days until early May (Ma et al. 2018a) before the operation unfortunately stopped due to a power supply problem to the telescope.
2.5.3. PLATO-A
PLATO-A is an optimized version of PLATO (Sect. 2.1.1) with only five engines in the engine module (Ashley et al. 2010b). The functionality and size, etc. did not change, but the new design of EM allows an easier access to the improved engine systems for maintenance. The size of the fuel tank increased to 6000 liters. It was maintained by every traverse team and has been supporting AST3 and other instruments to the date.
2.6. The 29th CHINARE
Most of the devices in the instrument module of PLATO-A were still working when the team arrived. PLATO-A was serviced just like for PLATO (Sect. 2.2).
AST3-1 was checked and serviced, and its tent-like dome was re-adjusted. A new set of CODS system replaced the old one, and AST3-1 data from last season were retrieved. However, it was found later that the CCD controller did not work and thus only engineering work was done with the telescope for the season until more problems emerged in winter (Yuan et al. 2014).
A new HRCAM was installed on the roof of PLATO-A IM. Nigel from old PLATO was decommissioned.
2.7. The 31st CHINARE
The expedition team returned to Dome A after two years with a very ambitious plan. The second telescope AST3-2 was installed and operated. The second generation weather tower, KLAWS-2G, was established as well as a near-IR spectrometer NIRSPEC. CSTAR was brought back as a new instrument CSTAR-II.
PLATO-A and AST3-1 were serviced and revived. It was found that the stuck problem with its Dec axis was caused by its dome which was then removed, and one of the two motors which was also removed. Its CCD camera controller was dead and it was upgraded with a new controller and a new camera with a science-grade CCD.
FTS was uninstalled and returned to PMO, data were retrieved.
2.7.1. AST3-2 and AST3-1
AST-2 is almost identical to AST3-1. It was first tested at Xinglong Station of NAOC on an altazimuth mount that did not allow CODS to automate sky survey (planning, observing and data reduction, etc.) like at Dome A. Later during November 2013 to April 2014, AST3-2 was winterized at Mohe, the coldest place in northeast China. With a customized mounting structure, the telescope was able to run on an equatorial mount and the automated operation at Dome A was simulated. It was demonstrated for the first time that the system could carry out the automated sky survey around the clock with real-time data reduction and transient detection.
However, the weather situation at Mohe was still very different from that at Dome A. The lowest temperature was only –40°C here compared to –70°C to –80°C at Dome A. Frosting on the front mirror was seen and different methods had been studied for defrosting, but suspected icing on gears was not found.
AST3-2 was installed successfully near AST3-1 (Fig. 7) and both telescopes worked well after the team left Dome A. Lots of engineering tests on the telescopes were done remotely with when solar power was enough and they got stuck occasionally. The new CCD camera for AST3-1 had problems in TEC cooling and configurations as it was shipped in a rush.
As it got dark and the temperature dropped, the two telescopes could still work, but not smoothly. Engineering tests still dominated, because more and more problems emerged with electronics, computers, and defrosting, etc. Also as the Sun went down, solar power decreased. It was a mistake that some instruments/devices were not designed with careful consideration of minimizing power consumption. PLATO-A was not designed to provide more than 1kW in average. In order to pursuing overall success for the season, decisions had to be made in early April to keep AST3-2, and shut down AST3-1 and CSTAR-II based on their performance and possibility of getting scientific data.
Even for just AST3-2, along with other problems, frosting on the front mirror became more and more severe. To defrost, the ITO coating on the mirror was found to be not enough and warm air from a blower inside the tube was used from time to time. This resulted in very large tube seeing and bad image quality. In May, the blower failed and extinction on images became larger and larger as frost gradually covered the whole mirror. The season was ended without starting automatic operation and everything was done manually as for AST3-1 three years before (Sect. 2.5.2). Exoplanet search was attempted at a time, but there were no real scientific data obtained. A lot of lessons have been learned from this season.
2.7.2. KLAWS-2G
Weather information is critical for running an observatory, especially for unattended instruments like AST3. KLAWS-2G was built for this purpose and was very useful in guiding the operation of AST3 this season. It was also used to monitor the boundary layer, so the design of KLAWS-2G also followed that of KLAWS with a 15m mast and temperature sensors at 10 heights from –1m to 14m (every 2m from 0–14 m), and seven propeller anemometers at the seven heights above 1m (Hu et al. 2019). There was also one air pressure sensor and one relative humidity sensor at 2m height. A data acquisition electronic box was placed at the foot of the mast and connected to PLATO-A, sharing the MAIN computer of AST3. A web page was developed to show real-time data from KLAWS-2G and historic data could also be visualized3.
KLAWS-2G collected data since January 2015 continuously for 20 months until the top part of the mast above 5m was broken due to a loose guy-wire and strong gusts, as was concluded during the 33rd CHINARE.
2.7.3. CSTAR-II
The original CSTAR was decommissioned and later modified to have pointing capability. Two of the four telescopes were co-mounted on a AP 1600 equatorial mount to build the new CSTAR (CSTAR-II) with different filters of i and R, respectively.
Tests of CSTAR-II were also done at Mohe with AST3-2 for about 5 months (Zhu et al. 2020) and it was able to run automatically through a night once started manually at twilight. It was installed and tested at Dome A successfully before it was turned off in early April due to frosting, stuck mount, and the fact that it drew too much power compared to its small size and potential of producing science data.
2.8. The 32nd CHINARE
Besides servicing PLATO-A, the team focused on making AST3-2 work again. A lot of work was done on its motion control system, CCD heat dissipation system, and defrosting blower inside tube, etc. An external defrosting blower system was installed on a tower in front of the telescope (Fig. 7). An upgraded CODS system replaced the old one for AST3-2 and AST3-1.
To solve the problem of limited power, a clean energy system was developed at PMO and deployed to Dome A. It had more solar panels and a wind turbine designed to generate power at low wind speed (e.g., 4m s−1). However, the wind turbine did not work at all and did not help with the power issue in winter, while the solar panels provided great power when the Sun was up.
AST3-1 telescope was not maintained and the rack of its native control system was moved to a new small cabin with thermal insulation for storage in order to free space inside the IM of PLATO-A. The cabin was originally planned to get power from PLATO-A and run AST3-1, but the plan was abandoned after the situation of AST3-1 and power budget was evaluated.
Efforts had been made to fix the problems of defrosting and stuck mount of CSTAR-II. It was tested to work well before the team left, but the mount stopped moving later when temperature dropped.
KLAWS-2G had been working for a full year. An air pressure sensor at 2m and an anemometer at 4m were replaced to restore its full power.
Some more webcams were installed and turned out to be very useful in assisting AST3-2 operation in winter. Lots of engineering works and tests were carried out remotely before twilight. Later, AST3-2 was able to observe with occasional problems of getting stuck. The CODS system ran the SN survey fully automatically with no need of intervention by a remote observer unless the survey was interrupted by instrument problems. The exoplanet search was allocated the best dark time of polar nights for non-stop short-period transit search which was run with semi-automatic scripts supported by CODS software. Lots of scientific results were obtained from this season in 2016 (Sect. 3.2).
AST3-2 had been collecting data until 2016 June 23 when there was a high wind above 8m s−1. The operation was stopped to protect the telescope, which however could not move again likely due to snow/ice accumulation.
Besides the astronomical activities at Dome A, a telescope was also installed at Zhongshan Station for winterover. The Bright Star Survey Telescope (BSST) is optimally designed for searching planetary transits of bright stars (Li et al. 2015; Tian et al. 2016; Zhang et al. 2016). The telescope has an aperture size of 30 cm with a 4k×4k CCD camera, resulting in an FOV of 3.4° × 3.4°. It is able to run robotically, and the winterover personnel at Zhongshan Station could help to fix small problems if there was any. BSST operated for one season in 2016 before being brought back.
2.9. The 33rd CHINARE
PLATO-A was able to run through the winter on engines and then mostly on solar power until the traverse team arrived. The focus of this team was still to revive AST3-2 and service PLATO-A. It was confirmed that the gears of AST3-2 were jammed by ice especially for the RA axis and more protections were added to prevent this from happening again. The CODS system was upgraded and valuable data from last year retrieved. Following this service mission, AST3-2 operated through the whole observing season for the first time (Li et al. 2018).
Since AST3-1 had been at Dome A for 5 years and problems could not be solved on-site, it needed a thorough maintenance. So decisions were made for the team to disassemble AST3-1, carefully pack the parts including optics, and bring them back.
KLAWS-2G stopped working shortly after the top part of its mast above 5m broken in August 2016 after collecting data for 20 months. The team concluded that the mast was damaged by strong gusts after a guy-wire broke and failed to stabilize the mast. It was then maintained and the sensors below 5m resumed to work for another 17 months when PLATO-A ran out of fuel.
2.9.1. KLCAM
KunLun Cloud and Aurora Monitor (KLCAM) is an all-sky camera similar to HRCAM (Sect. 2.3.2) or HRCAM2 that was decommissioned the year before. KLCAM was developed because long-term monitoring of the sky for cloud cover and aurora contamination is crucial for site testing at Dome A. KLCAM has different but enhanced thermal control designs to cope with the harsh winter at Dome A (Shang et al. 2018). The optical system of KLCAM includes a commercial Canon EOS 100D camera and a fisheye lens (Sigma 4.5mm F2.8) to cover essentially the entire 180° sky. A customized ARM-based embedded computer operates the camera as well as an active thermal control system for keeping the camera at its working temperature above 0°C even when the ambient temperature drops below –80°C.
KLCAM was installed on the roof of PLATO-A IM. It collected very useful images continuously for 17 months before power was off, and it also helped with AST3-2 operation in winter.
2.9.2. WiFi link
A WiFi link was established from PLATO-A IM to the sleeping quarters of the team about 400m away by using a parabolic antenna booster. This made it very convenient and more effective for controlling PLATO-A and communicating off the site for astronomy.
2.10. The 35th CHINARE
Since there was no Dome A traverse during the 34th CHINARE, PLATO-A struggled to operate for a second year and finally ran out of fuel on 2018 May 27 after 17 months. KLCAM and KLAWS-2G also stopped collecting data then.
Although KLCAM was intact, two new redundant KLCAMs were deployed and replaced the old one to guarantee continuous long-term data collection and avoid any possible problems developed in the old one, such as the shutter lifetime. A new 15m tall KLAWS-2G was set up and replaced the damaged one of only a 5m tall mast remained, restoring its full power of profiling the boundary layer and vertical temperature inversion (Hu et al. 2019).
PLATO-A was serviced with new engines and batteries, etc. and revived. Lots of other work was done on supervisor computers, power distribution boxes, iridium system, solar panels, etc., either replacing devices or fixing problems on-site.
AST3-2 was also maintained with new cabling, mirror defrosting system, and protection mechanisms preventing gears from icing, etc., making it fully functional again. However, as the Sun set, AST3-2 started to suffer from problems of moving difficultly possibly because of snow and ice accumulation again. Some engineering work was done as well as some experiments, such as using very short exposures of star pairs to measure seeing, a new technology developed with the AST3 project (Hickson et al. 2019).
PLATO-A suffered from communication problems from time to time, likely due to a conflict in local network setting because there were many new instruments installed. This seemed to be resolved after turning off the instrument. On 2019 August 3, followed that PLATO-A stopped communicating, a power outage occurred. Instruments that were still working thus stopped observing. In addition, PLATO-A was unfortunately not able to recover as expected with solar power when the Sun was up. Moreover, there was no Dome A traverse during the 36th CHINARE in the 2019/2020 season. A service mission is expected to return to Dome A for the 2020/2021 season by the 37th CHINARE.
2.10.1. KL-DIMM
Astronomical seeing is one of the crucial parameters in evaluating a site for optical/IR observations. Attempts had been made during the 27th and 28th CHINARE and daytime seeing measurements were obtained for 3 days (Sect. 4.2). The KunLun Differential Image Motion Monitor (KL-DIMM) was therefore developed to measure and monitor the night-time seeing for a long period so as to obtain convincing statistics and a conclusive assessment.
It is hard to operate a DIMM telescope at Dome A because it requires pointing and tracking a bright star, but its FOV is usually very small, around 10'. Furthermore, it also has to cope with the adverse conditions that AST3 faces. On the other hand, lessons learned and experience gained from CSTAR, AST3, and CSTAR-II have helped the development of KL-DIMM.
KL-DIMM has an equatorial mount, a 10-inch (25 cm) telescope, and a customized mask of two subapertures attached with a 5 cm prism each. The GSO 10'' f/8 R-C telescope has a carbon fibre tube which is light and more importantly has a much smaller thermal expansion coefficient than metal ones, minimizing focus change. An AP 1600GTO mount was chosen as it had been used for CSTAR-II and at Dome C. However, lots of modifications on its electronics and mechanical parts were made for automated operation in low temperatures and with problems of icing/frosting in winter (Ma et al. 2018b).
The system also has a finderscope with f = 50mm and a focal ratio of f/1.4. Two industrial IMPERX cameras with interline CCDs of 1600 × 1200 pixels and 3296 × 2472 pixels are equipped for the DIMM telescope and the finderscope, respectively. This results in an FOV of about 20° × 15° for the finderscope and about 15' × 11' for the DIMM.
To avoid ground-layer turbulence, a customized 8m tall tower was set up with another 1.5m base under snow surface. One of the key requirements for the tower design was that the jitters of the top platform cannot exceed 1' under a 8m s−1 wind in order to better keep a star inside KL-DIMM's small FOV.
Dedicated software was developed for automating the operation of KL-DIMM, including observation planning, a pointing model built with tpoint, and data reduction, etc. All raw image data were saved and backed up on disks while seeing measurements were transferred back in real-time.
For overall success, two KL-DIMMs with identical optics but different thermal protections and mechanical modifications were deployed, installed on the tower and started to operate during the daytime. They worked fully automatically, staring at Canopus all the time, as designed after the team left Dome A. KL-DIMM1 had some problems of defrosting and images out-of-focus, while KL-DIMM2 worked nearly perfectly through winter, collecting seeing measurements in polar nights for the first time and demonstrated the superb seeing at Dome A (Ma et al. 2020a, Sect. 4.2). KL-DIMM stopped working in August 2019 when communication and power were lost.
2.10.2. NISBM
The near-infrared sky brightness monitor (NISBM) used the InGaAs photoelectric diodes as detectors for three bands of J, H, and Ks (Zhang et al. 2019c). Each band had an independent unit with Ks band having an extra blackbody calibrator. They were successfully installed and operated for three months including about one month with nighttime (Fig. 9). Data analysis is in progress (Tang et al. 2020).

Fig. 9 A photo taken in early 2019 showing two KL-DIMM telescopes on an 8m tower, the 15m tall KLAWS-2G, and the NISBM installed on top of a modified shipping container that was used as a working cabin during the 35th CHINARE.
Download figure:
Standard image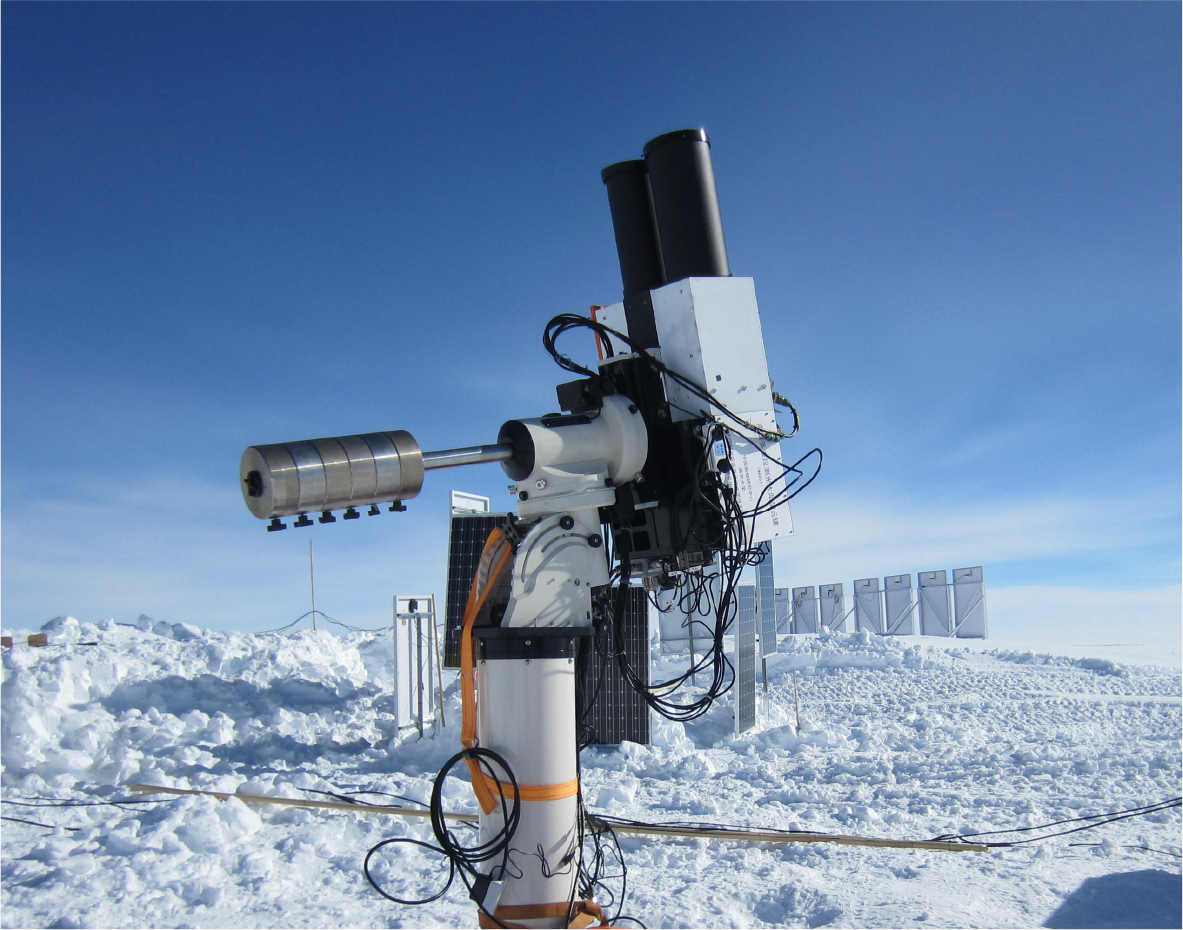
Fig. 10 MARST at Dome A.
Download figure:
Standard image2.10.3. MARST
The Multi-band AntaRctic Solar photometric Telescope (MARST) was designed to have two telescope tubes co-mounted on an AP 3600 mount for observing solar photosphere and chromosphere at the same time, respectively. The telescope aperture is 15 cm for photosphere and 13 cm for chromosphere. Both telescopes have an FOV of 40'×40', covering the entire solar disc (Haiping Lu & Peng Jiang, private communications). MARST was installed and operated successfully during the daytime.
Moreover, daytime observations of stars were also carried out. Benefited from the extremely clean air and clear sky, late type stars as faint as 5 mag were observed in visual band during the daytime. This demonstrated the advantages and great potential of daytime astronomy at Dome A. MARST was left at Dome A for operation again by the next traverse team.
2.10.4. Microthermal experiment
Another daytime experiment was to measure optical turbulence of near-ground atmosphere. Five microthermal sensors were attached to the 8m KL-DIMM tower at different heights above 1.5m and the vulnerable sensors could be replaced by the team if needed. A sonic anemometer was installed at about 6m height. The experiment collected data for about 20 days and was decommissioned before the team left.
3. Astronomical Research
Both CSTAR and AST3 were designed for imaging observations of time-domain monitoring to take advantage of the uninterrupted dark time in austral winter, although CSTAR was also the first Chinese instrument for site testing (Zhou et al. 2013, Sect. 2.1.2).
Figure 11 illustrates the available dark time at Dome A in 2020. Astronomical twilight is defined as when the elevation angle of the Sun θ⊙ is between 12° and 18° below horizon. If taking this definition, there are 1677 hours for astronomical night/darkness between dusk when twilight ends and dawn when twilight starts (θ⊙ < –18°), but no continuous dark time is available. In fact, astronomical observations can usually start even when the Sun is at about –10° with somewhat high sky background. This almost doubles the observing time to 3112 hours and gains 68 day continuous dark time. For more strict requirements, a new astronomical dusk and dawn can be defined when the sky background becomes minimal and stable. Benefiting from the extremely clean air, this happens when the Sun is below –13° at Dome A (Zou et al. 2010, Sect. 4.4), providing 2605 hour observing time with 32 day uninterrupted dark time.
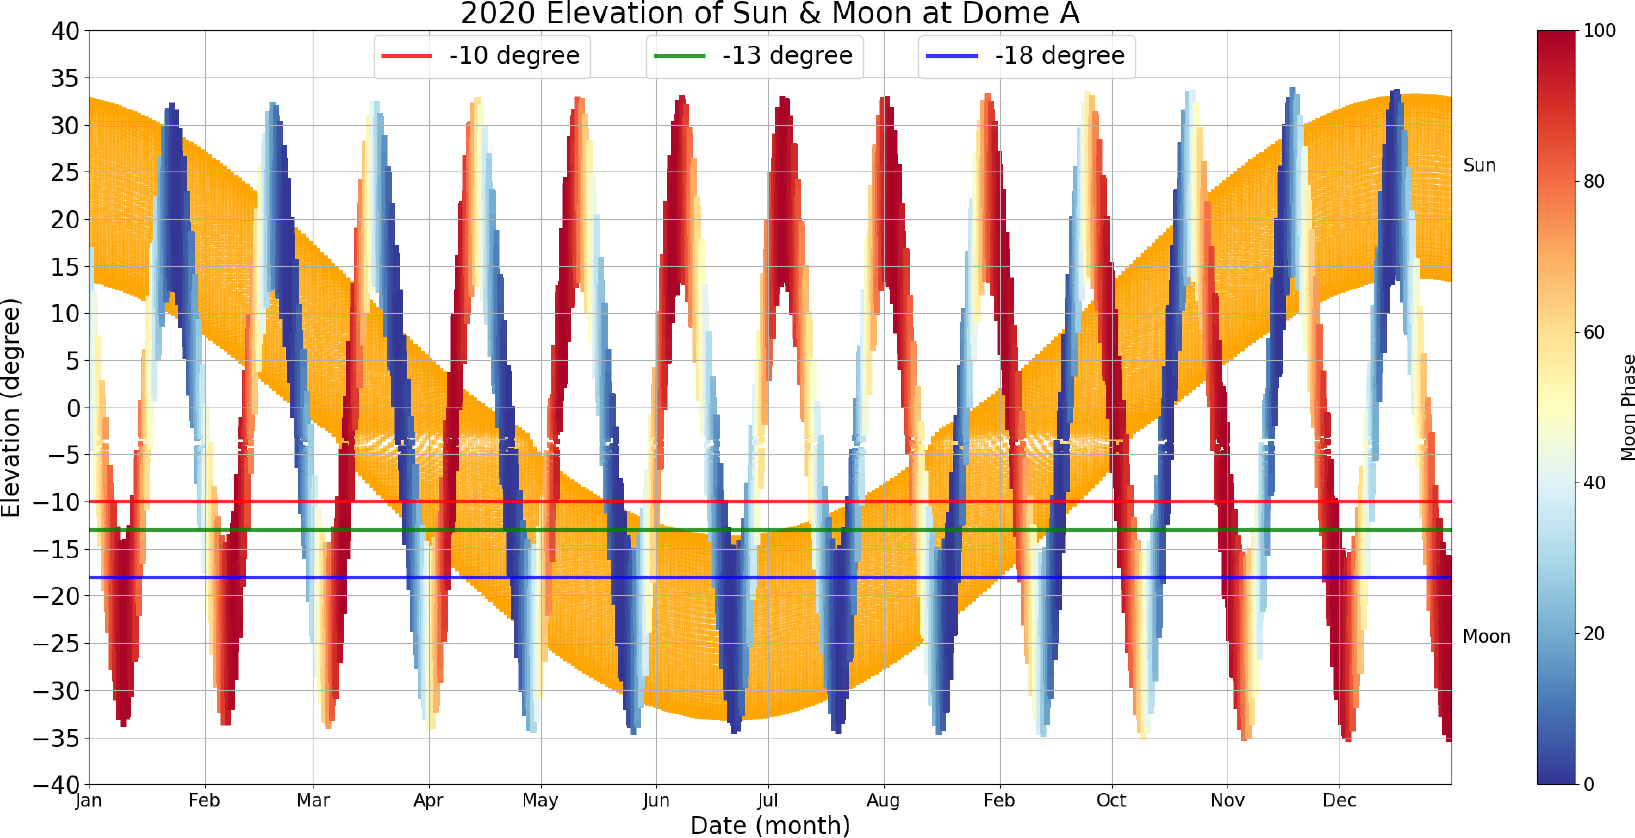
Fig. 11 The elevation angles of the Sun and the Moon in 2020 at Dome A, showing available dark time. The three horizontal lines indicate the Sun's elevation at –10°, –13°, and –18°. The phase of the Moon is also shown using the color scale. Courtesy of Xu Yang.
Download figure:
Standard imageIt should be pointed out that even with the new definition of astronomical dawn/dusk at Dome A, the observing time of a year is still less than the total observing time by regular definition of astronomical twilight/night (θ⊙ < –18°) at Mauna Kea, North Chile, and La Palma which all have more than 3300 hour dark time.
3.1. Photometry and Data Products
3.1.1. CSTAR data products
The data obtained with CSTAR were unprecedented, as the telescopes stared at an area of about 20 deg2 centered around the south celestial pole for the entire observing season every year, taking an image every 20 or 30 s. As CSTAR did not track, the sky area rotated on the CCD images one cycle every day, but most of the stars were the same in the images. Due to technical problems, the most useful data are i-band data in 2008 and 2010, as well as defocused g and r band data in 2009. The well-focused i-band telescope did not take data in 2009 for some technical reasons.
The first catalog from 2008 data was released for i-band with a limiting magnitude down to about 16th mag (Zhou et al. 2010b). There are usually 10 000 stars on each of the 300 000 images. The images were corrected with a 'super' bias frame created during testing observations (Zhou et al. 2010a), and a 'superflat' from science images with high sky background. There was also a special 'residual flat-field' correction that used stars as illuminating sources as they moved across different pixels during their daily circular motion on images. Aperture photometry was performed and the error is 0.1 mag with S/N = 10 at 13th magnitude. More than 10 000 stars were detected in the field and most of them have more than 300 000 measurements in the 2008 season.
To further improve the photometric precision, a series of follow-up corrections of instrument effects have been studied and carried out using the catalog data, including ghost image correction (Meng et al. 2013), inhomogeneous extinction (cloud) correction (Wang et al. 2012), and diurnal effects from imperfect flat-fielding (Wang et al. 2014a). The photometric precision has been improved to about 4 mmag at i = 7.5 mag and about 20 mmag at i = 12 mag (Wang et al. 2014b). A review on these efforts can be found in Zhou et al. (2013). The latest CSTAR i-band catalog and light curves are available online 4.
Images from the other three telescopes with filters g, r, and clear have defocused PSFs. Efforts were made to employ difference image analysis on 800 000 useful images of 2009, reaching a limiting magnitude of about 13.5 mag for both g and r bands (Oelkers et al. 2015).
Photometry on the 2010 data were also performed and light curves were used to identify variable sources (Wang et al. 2013). Combining 2009 and 2010 data, (Oelkers et al. 2016) carried out an in-depth search for transients, stellar flares, and variables. More importantly, through rigorous inspections, they identified many systematic effects that could have resulted in erroneous claims in some analyses using the same dataset.
3.1.2. AST3 data products
AST3-1 obtained useful science data in 2012, and AST3-2 in 2016 and 2017. Both were operated in i-band. General catalog from 2012 data has been published (Ma et al. 2018a) 5 and photometry of the exoplanet search fields, observed during the best polar nights in 2016, has been released (Zhang et al. 2019a) 6. Other data from 2016 and 2017 are being released soon (Yang et al. 2020).
Given some special difficulties with AST3 operating at Dome A, some new methods were developed for flat-fielding and dark corrections. Twilight flats were studied and taken at optimal conditions at Dome A, towards anti-sun direction with altitude about 75° (Wei et al. 2014). However, the sky is still not flat, with a gradient of 1% across the large FOV of AST3. The slope was fitted and removed from each flat image before combining them into a master flat-field image.
Due to heat dissipation problems, the CCD camera was often operated at temperatures between –40 to –50°C, resulting in a high dark current. Since AST3 cameras did not have a shutter, dark frames could not be taken on-site while lab dark images had different patterns. A new method was developed to derive a dark frame from science images and it turned out to be efficient and greatly improved the photometric precision (Ma et al. 2014b, 2018a).
Electrical cross-talk from multi-channel readouts appeared on images when there were saturated stars. It was studied and corrected for better photometry (Ma et al. 2014b; Zhang et al. 2019a). Obvious diagonal stripes on raw images due to interference from telescope electronics were also observed in 2016 and a method targeting the origin of the problem was developed to remove them well (Ma et al. 2020b).
The commissioning of AST3-1 in 2012 surveyed about 2000 deg2 sky area for SN as well as the LMC and SMC, and monitored a dozen fields including the LMC center, a testing field for exoplanet transits, and some Wolf-Rayet stars. For a typical 60 s exposure, the 5σ limiting magnitude is i = 18.7 with a typical FWHM of 3.7 arcsec. The observed 1σ astrometric precision is 0.1'' in both RA and Dec while the internal precision can be much better for bright stars. Flux calibration was based on the AAVSO Photometric All-Sky Survey (APASS)7 DR9 catalog (Henden et al. 2016).
The data release consists of 14 000 scientific images, 16 million sources brighter than i = 19 and 2 million light curves. However, most observed fields did not have many repeated observations, so most light curves are not very useful (Ma et al. 2018a).
In the 2016 season, AST3-2 covered some SN survey fields from 2012, but the main focus was the exoplanet project named the CHinese Exoplanet Searching Program from Antarctica (CHESPA). The program selected target fields that would be later scanned by TESS and was allocated polar nights in May and June for continuous monitoring of short-period exoplanets (Zhang et al. 2019a). A group of 10 adjacent fields was planned and scanned for 37 nights with some interruptions caused by instruments, weather, and other programs. This resulted in an overall time coverage of about 40% while it was improved to about 80% in 2017 when a group of 22 fields was scanned. The rotating monitoring takes three 10 s exposures of each field each time, and the overall cadence was about 12 minutes.
The FWHM of stars in images has a wide range with a median value of about 4.5'' although AST3 has a pixel scale of 1'' pixel−1. This was mostly due to the tube seeing caused by heat from the defrosting blower (Sect. 2.7.1) and CCD camera inside the telescope tube. The large FWHM was actually good for exoplanet search observing bright stars, but the limiting magnitude could not go deep for other studies of faint sources, such as SN search.
More than 35 000 images were taken for CHESPA in 2016 and from this dataset more than 26 000 light curves of stars brighter than i = 15 mag were obtained and released with and without detrending and binning to a cadence of 12 minutes. The best photometric precision at the optimum magnitude around 10 mag is around 2 mmag.
3.2. Exoplanet
The continuous dark time at Dome A and the short cadence design of CHESPA are sensitive for searching short-period transiting exoplanets. The scanning fields were chosen specifically within the Southern Continuous Viewing Zone (CVZ) of TESS, so as to maximize follow-up observations and the chance of detailed studies of their atmosphere and internal structure.
More than 200 objects with plausible transit signals were detected from the 2016 AST3-2 data and 116 of them were classified as candidates of transiting exoplanets based on their stellar properties and reasonable planetary radii derived (Zhang et al. 2019b).
Figure 12 shows an example light curve of one candidate. Detailed fitting to the transit signals has revealed their parameters, including period, transit depth, and duration, etc. The host stars range from i = 7.5 mag to 15 mag and the typical transit depth are 20–50 mmag. The orbital periods of the candidates are from 0.2 to 6 days. Follow-up confirmation with radial velocity observations are in progress. Using the same dataset, methods involving machine learning and image subtraction to detect transients were studied (Huang et al. 2020).

Fig. 12 The phase-folded light curve of an exoplanet candidate. Shown on the top are its AST3 name, i magnitude, period in days, transit depth in mag, and duration in hours. Courtesy of Hui Zhang.
Download figure:
Standard imageIn addition to AST3, data mining through the i band CSTAR catalog was also productive. Although CSTAR was not specifically optimized for transit search, its observing mode and the improved photometric precision of the catalog made it suitable for this purpose.
In 2008, CSTAR stared at an area of 20 deg2 centered at the south celestial pole for more than 100 days, taking an exposure every 20 or 30 s. The photometric precision of light curves for 20 s exposures is ∼4 mmag for the brightest stars of i = 7.5 and ∼20 mmag for i = 12. The transit search limited to sources of 7.5 < i < 14. After applying very strict criteria of selection and false-positive ejection, Wang et al. (2014b) found 10 candidates of exoplanets. Follow-up spectroscopic observations of the candidates were carried out with the Wide Field Spectrograph (WiFeS) on the Australian National University 2.3m telescope and four of them were ruled out because of their nature of giants. For the remaining six dwarf candidates, RV measurements were obtained with WiFeS. None of the candidates showed RV variation beyond the intrinsic uncertainty of 2 kms s−1 of the instrument, indicating that they are not unblended eclipsing binaries. Therefore, higher resolution RV observations are needed for confirmation.
At Zhongshan Station in 2016, BSST monitored Proxima Centauri for over 10 nights shortly after the discovery of the Earth-mass planet Proxima Centauri b which has an orbital period of about 11.2 days. Liu et al. (2018a) proposed to search for transit signals of the planet and if confirmed, its atmospheric properties and habitability, etc. can be well studied. They reported a tentative transit event at a confidence level of 2.5σ and expected more high-cadence observations to be done.
3.3. Stellar Variability
3.3.1. Variable stars
For synoptic surveys like CSTAR and AST3, variable stars are always expected to be detected. Two groups worked on the CSTAR data independently. Without using the published CSTAR catalog (Zhou et al. 2010b), Wang et al. (2011) carried out a time-series photometry on the same dataset of 2008 and reached a similar photometric precision (Sect. 3.1.1). Over 70% of their bright-star sample has more than 20 000 photometric measurements, and among many sources of error, the internal statistical uncertainty only is less than 1 mmag for stars with i ≤ 13.5 mag. They discovered 157 new variable stars with many kinds (Fig. 13). The group did the same analysis of more than 9000 stars down to i ≤ 15.3 mag in the 2010 data (Wang et al. 2013). They detected 188 variable stars, including 67 new ones, but some in the previous studies were not recovered for various reasons.
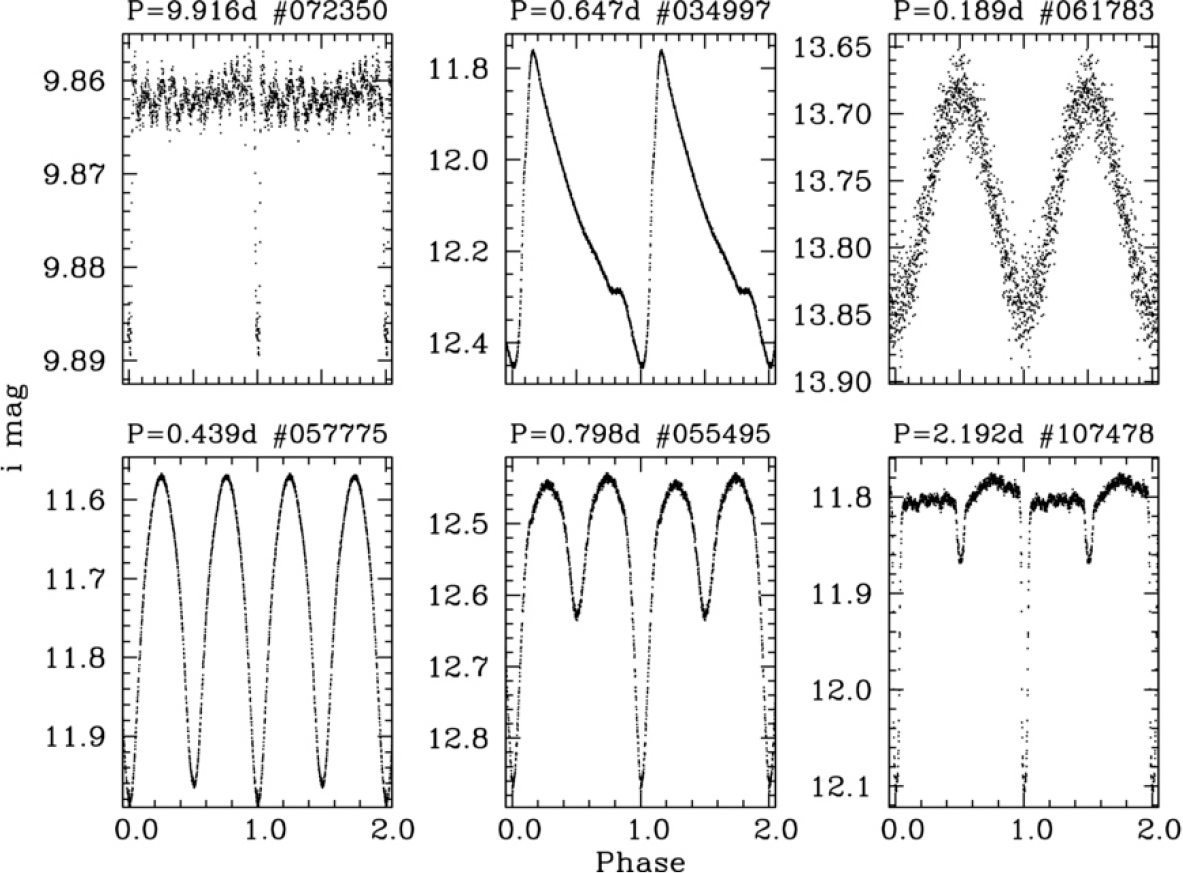
Fig. 13 Examples of phased light curves of CSTAR variables (Wang et al. 2011). From left to right, top: transit source, RR Lyrae, and δ Scuti; bottom: eclipsing binaries with contact, semi-detached, and detached configurations. Printed with permission from the authors and by permission of the AAS.
Download figure:
Standard imageUsing the CSTAR catalog of 2008 data, Wang et al. (2015) carried out a time-series analysis and recovered most of the variables previously reported by another group (Wang et al. 2011, 2013). However, there exist some discrepancies that some variables were not confirmed while 83 new variables were reported. Yang et al. (2015) identified and studied 53 eclipsing binaries and presented their orbital parameters. In addition, by studying eclipse timing variations for semi-detached and contact systems, they identified two interesting triple systems and derived the orbital parameters of the third body in one system. Another detailed study on CSTAR eclipsing binaries focused on three individual objects (Liu et al. 2018b).
The defocused images from three telescopes of CSTAR (g, r, and clear) in 2009 were also systematically analyzed (the i-band telescope did not take data in 2009 for some reasons). Oelkers et al. (2015) applied the difference image analysis method (Alard & Lupton 1998) and identified 105 variable stars, of which 37 were not detected in previous papers. Although not all of the stars have both g and r colors, and i-band data were taken at different years, the color information helped the classification and understanding of normal pulsators, irregular variables, and eclipsing binaries in the sample.
Colors (g and i) were also obtained with CSTAR-II during its testing run of nearly 5 months at Mohe (Sect. 2.7.3). The detection limit was about 13–14 mag. With nearly 7000 light curves of each color and the best overall photometric precision of about 3 mmag for brightest stars of 9 mag, 63 variable stars were detected and 48 of them were identified as new variables of eclipsing binaries or pulsating stars (Zhu et al. 2020).
CSTAR has provided the most complete dataset for studying variable stars of periods shorter than 180 days and magnitudes down to about i ∼ 15 mag and g ∼ r ∼ 13.5 mag in the sky area around the south celestial pole. Those who wish to use the data should refer to all the studies as there are many differences.
AST3 has a much larger aperture than CSTAR and therefore reached a deeper limiting magnitude despite that it was not working under the ideal conditions due to technical problems. From the i-band photometric catalog of AST3-1 2012 data (Ma et al. 2018a), Wang et al. (2017) selected the testing field for transiting exoplanets on the Galactic disk and carried out a time-series analysis. This field had the most monitoring observations with more than 3500 images of total 38.9 hour integration time over 8 days. There are more than 90 000 sources down to i ≤ 16.5 mag in this single field and they detected 560 variable stars, of which 339 were new detections with both eclipsing binary stars and pulsating stars. A few variable stars show unusual behavior, such as a plateau light curve or a secondary maximum, etc., and need to be investigated further.
Using light curves of the same field as for the above study, Shi et al. (2019) analyzed three W UMa-type contact binary systems and derived their degrees of contact, mass ratios, and physical parameters. Some interesting results were obtained. They found that the orbital period of one system (AST19571) is increasing, possibly indicating mass transfer in the system from the less massive star to the more massive one. Another system (AST38503) is a deep-contact binary with a degree of contact of 66% and a mass ratio of 0.314, which is possibly evolving into an extremely deep overcontact state and could eventually merge into a single star with large angular momentum loss. A pioneer work of this subject was also done using CSTAR data on one W UMa-type system and suggested the presence of a close-in third body (Qian et al. 2014).
Other than AST3 and CSTAR, although the main purpose is for site testing to monitoring the sky background and extinction, the data of wide-field cameras, such as Gattini, HRCAM, and KLCAM, can also be used for time-serious analysis of very bright stars (Yang et al. 2017; Sims et al. 2013; Yang et al. 2020) and the potential is yet to be explored more.
3.3.2. Asteroseismology
High-precision, high-cadence time-series photometry from Dome A are ideal for asteroseismology study to probe the internal structure of stars (Fu et al. 2014).
Using CSTAR light curves spanning three years in three colors (i-band in 2008 and 2010, g and r-bands in 2009) and having total more than 250 periods, Huang et al. (2015) carried out a detailed analysis on a single RR Lyrae variable Y Oct. Fourier analysis of the data revealed only the fundamental frequency and its harmonic frequencies in three bands, indicating the source being a non-Blazhko RRab. Combined with archival data, they derived a period change rate of –0.96 ± 0.07 days Myr−1, much smaller than typical RRab stars. The physical parameters, such as metallicity, Teff etc., were also derived for this star.
Similarly, using more than 1950 hours of high-quality light curves in CSTAR g and r-bands from 2009, Zong et al. (2015) discovered low-amplitude oscillations in the star HD92277, which was classified as a δ Scuti star. They detected 14 and 21 pulsation frequencies in the g and r bands, respectively. An accurate period of 0.0925 days was also derived. Multi-color observations were shown to be valuable for mode identification.
3.3.3. Stellar flares
Stellar flares are common but rarely recorded, because only long-term, uninterrupted observations can detect them systematically. Data from CSTAR and AST3 during Dome A winter are therefore very valuable for identifying and studying these events.
Qian et al. (2014) presented 15 stellar flares when studying a contact binary system in 2010 CSTAR data. However, Oelkers et al. (2016) pointed out that this was a false detection due to the diurnal motion of a ghost image of a bright star. They claimed that ∼ 20% of 2010 CSTAR light curves exhibit similar features that could be mistaken as flares. After carefully rejecting ghosting signals and other global artifacts, they identified 29 flaring events in 2009 and 2010 CSTAR light curves and derived a flare rate of 7 ± 1 × 10⁻⁷ flare h−1 for the entire CSTAR field, 5 ± 4 × 10⁻⁷ flare h−1 for late K dwarfs, and 1 ± 1 × 10⁻⁶ flare h−1 for M dwarfs in halo.
Liang et al. (2016) searched for flares in the 2008 CSTAR light curves and identified 15 flare events in 13 out of > 18 000 stars. They modeled the flares and presented flare amplitudes between 1% – 27% and durations from 10 to 40 minutes. They also found a linear relationship between flare decay time and total duration. The same group also carried out a similar analysis of the 2016 AST3-2 data of exoplanet transit search in the CHESPA program, 20 stellar flares from different sources were identified (Liang et al. 2020). They were able to model the stellar flares to obtain their properties, including duration, amplitude, energy, and skewness, for future study. The durations of the flares in this study range from 28 to 119 minutes, with most within an hour.
3.4. SN and Other Transients
Very early discovery of SNe was one of the key programs for AST3. However, due to problems of large FWHM from tube seeing and large extinction from frosting, the limiting magnitude of either AST3-1 or AST3-2 was optimal for faint sources. Nevertheless, there were SNe detected and discovered by the AST3 automated survey.
As early as in 2014 during the field test in Mohe (Sec 2.7.1), AST3-1 recorded SN 2014J in M82 (Ma et al. 2014c), but did not discover it in real-time. Shortly after that, a new type Ia SN was discovered with spectroscopic confirmation as SN 2014M (Ma et al. 2014d). After being deployed to Dome A, AST3-2 discovered another one, a Type IIP SN 2017fbq. The real-time pipeline of AST3 was also very powerful in detecting other variable sources, such as dwarf novae (Ma et al. 2016), minor planets, AGNs, and variable stars, but most of these were not reported in real-time and they are yet to be studied.
In 2017, AST3-2 contributed to the campaign of seeking and successfully detected the first optical counterpart of the gravitational wave source GW170817 (Hu et al. 2017; Andreoni et al. 2017; Abbott et al. 2017).
4. Astronomical Site Testing
Besides months of continuous dark time in winter, the nature of Dome A being a good optical, infrared, and THz observatory has long been discussed qualitatively based on its stable atmosphere, low temperature and low water vapor, etc. However, quantitative measurements must be made in order to be able to help the science expectations, the designs of telescopes and instruments, the construction planning, and future operations.
Years of site testing efforts have greatly advanced our knowledge about Dome A. Studies have revealed a median free-atmosphere seeing of 0.31'', a median boundary-layer height of 13.9 m, the PWV in the 0.1–0.2mm range, and darker sky background, etc. These have demonstrated the best observing conditions and the merits of Dome A for ground-based astronomical observations, as will be discussed in the following sections.
4.1. Meteorological Parameters and Boundary Layer
Since Dome A is covered by ice as thick as about 3000 meters, due to radiative cooling of ice, atmosphere often shows temperature inversion, an extreme stable situation in which colder, heavier air stays below warmer, lighter air (Fig. 14). Coupled with low wind shear, this can result in very weak turbulence and good seeing.

Fig. 14 An example of temperature inversion in 2016 KLAWS-2G data. Different colors indicate the temperatures at different heights. Courtesy of Yi Hu.
Download figure:
Standard image
Fig. 15 Plot of temperatures of 2015 from KLAWS-2G. Different colors indicate the temperatures at different heights. Courtesy of Yi Hu.
Download figure:
Standard imageWith a full-year monitoring in 2011 from KLAWS, Hu et al. (2014) found a strong temperature inversion existed for more than 70% of the time above snow surface, and up to 95% above 6 m. The temperature gradient was often greater than 10°C from 0m to 10 m. These were further confirmed with 20 month data from KLAWS-2G in 2015 and 2016 (Hu et al. 2019).
Moreover, the temperature gradient, regarded as the strength of temperature inversion, was shown to be anti-correlated with the thickness of the turbulent atmospheric boundary layer (Hu et al. 2014). At Dome A, most ground turbulence exists in the boundary layer, above which is the free-atmosphere where there is minimal energy exchange with the earth surface and thus weak turbulence and good seeing are expected. Therefore, thin boundary layer and strong temperature inversion happen at the same time, indicating a stable atmosphere and that free-atmosphere is easy to access with superb seeing.
The thickness, distribution and variability of the boundary layer at Dome A was characterized using Snodar in 2009 (Bonner et al. 2010). They presented a median thickness of 13.9 m, with the 25th and 75th percentiles at 9.7m and 19.7 m, respectively. Compared to Dome C, the median thickness of its boundary layer was 33 m, with the 25th and 75th percentiles at 25m and 42 m, respectively (Trinquet et al. 2008).
This has been one of the most important and exciting site testing results for Dome A, as it implies that not only good free-atmosphere seeing is easy to access but the constructions of future large facilities are also feasible. The statistics of the boundary layer thickness as well as the temperature inversion can help to guide the decision of heights for telescopes and their domes, etc.
The ground temperature at Dome A ranged from –30°C in summer to about –80°C in winter. During winter observing seasons, the temperature were usually between –50°C and –80°C with small annual variation. Since katabatic wind dominates the Antarctica continent, the wind speed should be very low in general with random directions at Dome A. These were confirmed and an average wind speed of 1.5m s−1 was recorded at 4m in 2011 (Hu et al. 2014), but it was about 4m s−1 in 2015-2016 (Hu et al. 2019). They concluded that the difference reflects the annual climatological change.
4.2. Seeing
There are many ways to profile the vertical turbulence structures in the atmosphere and derive seeing values, but the most direct and commonly used instrument is DIMM (Sarazin & Roddier 1990) which measures a total seeing above the telescope aperture. A DIMM is usually placed on a tower to avoid strong turbulence close to the ground. As discussed in Section 4.1, only the free-atmosphere seeing is of great interest at Dome A when it is measured above the boundary layer.
Very recently, first night-time seeing as good as 0.13'' was reported based on winter data from KL-DIMM on an 8m high tower at Dome A in 2019 (Ma et al. 2020a, Sect. 2.10.1). The KL-DIMM took one seeing measurement every minute from April to August with occasional interruptions for defrosting, etc. The measurements show a median free-atmosphere seeing of 0.31'', and the chance of KL-DIMM reaching free-atmosphere was 31% of the time at 8m (Fig. 16, Table. 3). It is estimated to be 49% at 14m based on the strong correlation between the near-surface temperature gradient and the boundary-layer thickness. The temperature gradient is also strongly correlated with seeing and therefore can hopefully be used to estimate and/or derive seeing in the future for Dome A.

Fig. 16 Distribution of night-time seeing measurements from KL-DIMM in 2019. The sampling rate was one measurement per minute. Three log-normal components (green lines) were fitted to the data, from left to right, corresponding to free-atmosphere, intermediate and boundary-layer components, respectively. The red line is the sum of the three log-normal components and the blue line indicates the cumulative probability. Courtesy of Bin Ma.
Download figure:
Standard imageThese results have demonstrated that Dome A has the best seeing condition on the ground. Table 3 compared the night-time seeing for several good sites. It is worth to note the median free-atmosphere seeing and their fractions of time as these are the really important ones for Dome A and Dome C.
Table 3. Statistics of the Night-time Seeing
| Site | height | 25% | median | 75% |  FA FA |
IN |
BL |
fFA | fIN | fBL |
|---|---|---|---|---|---|---|---|---|---|---|
| m | arcsec | arcsec | arcsec | arcsec | arcsec | arcsec | % | % | % | |
| Dome A | 8 | 0.41 | 0.89 | 2.02 | 0.31 | 0.57 | 1.97 | 31.0 | 30.1 | 38.9 |
| Dome C | 8 | 0.83 | 1.65 | 2.32 | 0.33 | 0.54 | 1.73 | 16.2 | 14.4 | 69.4 |
| Dome C | 20 | 0.43 | 0.84 | 1.55 | 0.30 | 0.42 | 1.17 | 15.7 | 29.3 | 55.0 |
| Mauna Kea | 7 | 0.57 | 0.75 | 1.03 | ||||||
| Armazones | 7 | 0.50 | 0.64 | 0.86 | ||||||
| La Palma | 5 | 0.62 | 0.80 | 1.06 |
The columns are the names of sites, the heights of towers for DIMMs, the 25th, 50th (median) and 75th percentile values of DIMM seeing, the median values of the free-atmosphere seeing FA, intermediate seeing IN and BL seeing BL, and their fractions of time fFA, fIN, and fBL, respectively. The entrance pupils of DIMMs are usually ∼ 1m above the top of towers. The decomposition results for three log-normal components in seeing histograms is only for Dome A (Ma et al. 2020a) and C (Aristidi et al. 2009). The seeing statistics are also shown for three best mid-latitude sites: Mauna Kea 13N in Hawaii(Skidmore et al. 2009), Cerro Armazones in Chile(Skidmore et al. 2009) and La Palma in Canary Islands(Vázquez Ramió et al. 2012). Adapted from Ma et al. (2020a) with permission from the authors and by permission of Springer Nature.
Prior to the KL-DIMM results, daytime seeing measurements of 3 days with a DIMM mounted on AST3-1 tube in 2012 revealed a median seeing of ∼0.8'' at a height of 3.5m (Pei et al. 2012, Sect. 2.5).
At Taishan Station, daytime seeing measurements of 2 days in January 2014 have shown a median value of 0.73'' at a height of 2.5m above snow surface (Tian et al. 2020). As is reasonable, they also reported a correlation between the seeing minimum and the minimum of the atmospheric structure constant of refractive index  which was measured simultaneously using a microthermal sensor at a single height of 2.0 m. As the time span is not long, it is hard to draw statistical conclusions yet.
 is an important parameter denoting atmospheric turbulence. It is related to total integrated seeing from a height of h0 and above through
where λ is the wavelength of interest. In reality,  can be derived from microthermal measurements.
where P is the air pressure in hPa, T is the air temperature in K, and  is the structure constant of temperature index which can be directly measured with microthermal sensors at different heights. At a certain height,

where DT(r) is the structure function of temperature and r is the distance traveled by air between two sampling.
There are many ways to profile  vertically. Specifically developed for and from AST3, Hickson et al. (2019) proposed the Multistar Turbulence Monitor (MTM), a new technique using short-exposure images of a star field. Differential motion between any pair of star images can be used to computer the structure function and the different angular separations between two stars in pairs corresponds to different heights. The actual data analysis needs to be verified (Ma et al. 2020c) and this technique can be generalized to use a small telescope at any site.
Another method was also developed with AST3 and attempted to measure atmospheric seeing from bright star trails on images (Ma et al. 2016). Since frame-transfer CCD was used and there was no shutter (Sect. 2.5.1), during the transfer phase, a bright star will leave a trail on the image, which is a time-series of very short exposures (about 1 ms) of the star. The atmospheric turbulence can cause jittering of the centroid of the trail and therefore can be measured. However, this was just to use the by-products of AST3 data and it was coupled with telescope vibration due to wind or tracking, etc., further investigation are yet to be realized.
4.3. Extinction and Cloud Cover
Cloud cover and the fractions of photometric and observable time are important in characterizing a site for optical/IR. Zou et al. (2010) first studied the cloud cover using CSTAR i band data in 2008. They were not able to obtain the absolute extinction not just because the airmass did not change much in the CSTAR FOV, but clouds, the atmosphere and frosting all contributed and could not be easily distinguished. Therefore they calculated relative transparency variations from images and used their statistics to derive upper limits of the cloud cover. Based on excess extinction values of < 0.11, 0.11 – 0.31, 0.31 – 0.75, and > 0.75 mag, they defined four corresponding categories and found their fractions of time as 51% for little/no cloud, 23% for thin cloud, 17% for intermediate cloud, and 9% for thick cloud. They concluded that the cloud cover condition is better than that at Mauna Kea, with a time fraction of 67% at Dome A compared to 50% at Mauna Kea (Gemini) for extinction < 0.3 mag in V band. More details are listed in Table 4.
Table 4. The Comparison of Cloud Cover between Dome A and Mauna Kea
| Fraction | |||
|---|---|---|---|
| Cloud Cover | Extinction (V) | Mauna Kea | Dome A |
| Clear | <0.3 | 50% | 67% |
| Patchy cloud | 0.3 – 2 | 20% | 31% |
| Cloudy | 2 – 3 | 20% | 2% |
| Any other usable | >3 | 10% | 0% |
The good extinction condition at Dome A was also confirmed by others with CSTAR data. Based on 2008 and 2010 i-band data, Wang et al. (2013) found that the extinction due to clouds was less than 0.1 and 0.4 mag for 40% and 70% of the dark time, respectively. Oelkers et al. (2015) reported consistent results in 2009 g and r data with the extinction due to clouds to be less than 0.1 and 0.4 mag for 40% and 63% of the dark time, respectively. Wang et al. (2012) investigated the inhomogeneous extinction due to clouds over CSTAR's FOV of 20 deg2 and corrected the effects to improve the photometric precision of the CSTAR catalog. They reported an even transparency in 83.7% of images and concluded that more than 80% of observation time during 2008 was suitable for accurate photometry.
The results from CSTAR data are convincing but only representative of the area around the south celestial pole which is about 80° above the horizon. However, Gattini's GASC has an FOV of 90° × 90°, also pointed near the SCP and could extend down to 35° above horizon. Although GASC was mainly for sky brightness monitoring in three colors (Sect. 4.4), estimation of cloud cover was also done by following the methods and criteria for CSTAR in Zou et al. (2010). Comparable results were obtained except that the fraction of time for the category of the lowest extinction (< 0.11) dropped from 51% for CSTAR to 34% for GASC.
There are many factors that could complicate the estimates of cloud cover (extinction) from images. Frosting on the windows or entrance pupil of instruments was probably the worst as its effects could not be decoupled from those of real clouds on images. Since AST3 has a much smaller FOV and suffered the most severe frosting problem, no attempt has been tried to use its data for cloud cover study.
Apart from studying extinction through photometry of wide-field images, the most direct assessment of cloud cover usually uses monitoring images produced by all-sky cameras such as ASCA for the TMT site testing (Skidmore et al. 2011) or KLCAM for Dome A.
KLCAM worked continuously for 490 days since January 2017, taking an image every half an hour. Visual inspection has been employed to analyze the night-time images when the Sun was 13° below horizon (Yang et al. 2020). Since clouds at Dome A are always diffuse, a semi-quantitative image classification was first defined for clouds as clear, light, heavy, or covered. Each image was visually checked independently by five individuals who classified the image into one of the four categories defined above, and the median value was taken as the image's classification. A confusion matrix of statistics show very high level of agreement among the inspectors.
The results show that 83.3% of images are classified as 'clear', 11.2% 'light', 2.8% 'heavy', and 2.7% 'covered'. The 'clear' fraction is the highest compared to other best temperate sites which have a fraction between 70% and 82%. Moreover, the 'clear' fraction are higher in May to July when the dark time is long. Unlike CSTAR or Gattini, KLCAM was free from icing or frosting problem owing to its special design. Therefore, although semi-quantitative, the results are reliable and expected. More quantitative work is necessary, such as machine-learning analysis or photometry on the images.
4.4. Sky Background
The clean atmosphere with low aerosol content guarantees dark sky background at Dome A and it also makes the sky darken earlier. The i-band sky background from 2008 CSTAR data revealed that the sky brightness became dark and stable when the Sun was below –13° (Fig. 17), and therefore the astronomical night (between dusk and dawn) at Dome A can be redefined as such instead of –18° (Zou et al. 2010). Using spectroscopic data from Nigel, a similar conclusion of –12.6° was reached when the end of twilight was quantitatively redefined as when the sky brightness increased by 0.5 mag above the median moonless dark sky (Sims et al. 2012a). They also presented the annual dark time available as a function of wavelength between 300–850 nm.
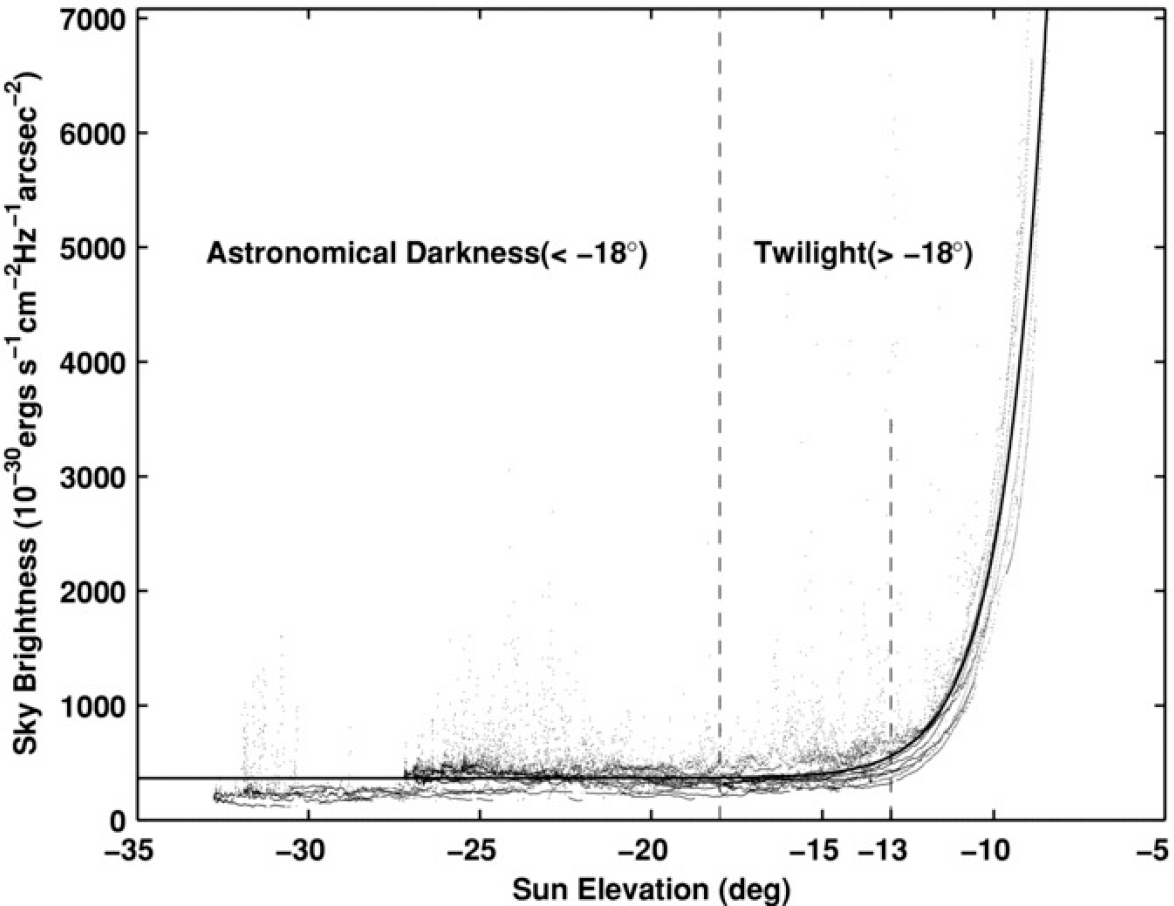
Fig. 17 Relation between the sky brightness and the elevation of the Sun, showing the sky becomes dark and stable when the Sun is below –13° (Zou et al. 2010). Printed with permission from the authors and by permission of the AAS.
Download figure:
Standard imageThe median i-band sky background of moonless clear nights was 20.5 mag arcsec−2 in 2008. This is the darkest compared to 20.10 mag arcsec−2 at La Palma, 20.07 at Cerro Tololo, and 19.93 at Paranal (Zou et al. 2010). The 2010 data showed consistent results with the darkest sky background of 20.9 mag arcsec−2 (Wang et al. 2013).
Gattini's GASC was designed specifically for investigating optical sky brightness over a large FOV of 90° × 90°. Measurements in three colors were made using 2009 data and the darkest 10% in the cumulative distribution marks sky brightness of B = 22.98, V = 21.86, and R = 21.68 mag arcsec−2. These are comparable to the values during solar minimum at other best optical observatories in Mauna Kea or northern Chile.
Currently, no IR sky background measurements have been published for Dome A.
4.5. Aurora
One complication for astronomical site testing and observation in Antarctica is the aurora contamination in the optical/IR bands. Auroral emission is composed of spectral lines from atomic oxygen and bands from molecular nitrogen and oxygen, and only a few of them are prominent including the most common green [Oi] 557.7 nm and purple  391.4 and 427.8 nm lines. Customized filters can be designed to exclude these strong auroral lines from desired bands, but numerous weak lines still contribute to the sky brightness. Figure 18 shows a useful summary of the auroral and airglow emission lines (Sims et al. 2012a).
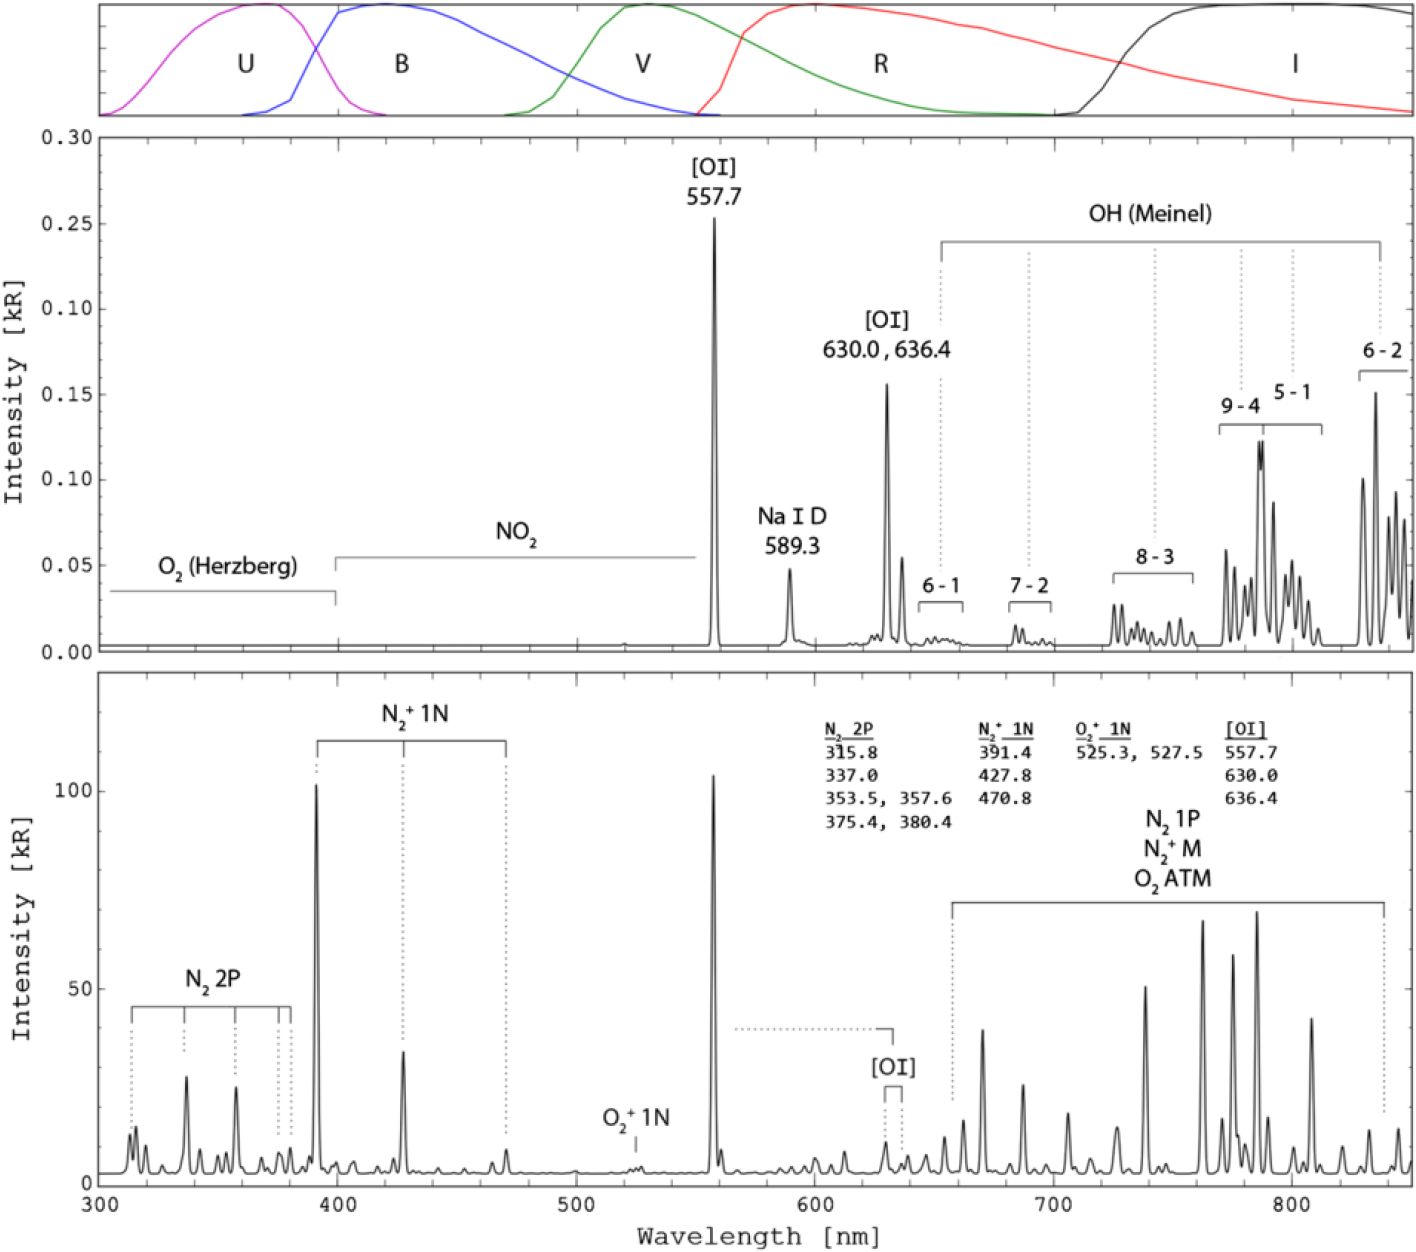
Fig. 18 Synthetic airglow (middle) and auroral (bottom) spectrum, showing typical intensities (in kilorayleighs) of dominant emissions in the 300–850 nm range (Sims et al. 2012a). Note that the [Oi] 557.7 nm emission is hundreds times greater in the typical aurora than in the typical airglow. Printed with permission from the authors and by permission of the AAS.
Download figure:
Standard imageZou et al. (2010) reported that only 2% of the CSTAR images in 2008 were affected by aurora. This is certainly not representative because of the relatively small FOV of CSTAR and the fact that aurorae usually occur in the "auroral oval", a ring of 3–6° wide in latitude and between 10–20° from the geomagnetic poles (Fig. 19). Fortunately, Dome A lies inside the "auroral oval", just 6° from the South Geomagnetic Pole, therefore aurorae there generally lie below horizon or close to horizon, leaving less contamination to the sky areas of low airmasses.

Fig. 19 Illustration of the typical location of "auroral oval" centered on the South Geomagnetic Pole (black dot) in Antarctica. It is clear that Dome A and C are in better situation than Dome F and the South Pole in terms of auroral pollution.
Download figure:
Standard imageThe frequency of occurrence and the intensity of aurorae depend upon the solar activity and solar cycles, but it is still important to characterize the aurora conditions at Dome A. Both airglow and auroral lines were clearly detected in the spectra from Nigel in 2009 close to solar minimum. Having managed to separate aurorae from airglow and calibrated the spectra with Gattini photometry, Sims et al. (2012a) studied the dominant emission lines and found the median auroral contribution to the B, V, and R bands is 22.9, 23.4, and 23.0 mag arcsec−2, respectively. They also noted that up to 50% of observations were above general airglow intensities, indicating aurora contamination.
Similar to the classification of clouds in KLCAM data (Sect. 4.3), aurorae were also visually inspected by five individuals independently on each of thousands of all-sky images taken at night in 2017 and 2018 (Yang et al. 2020). Again they defined four categories semi-quantitatively according to the intensity and extent of auroral contamination and found that 55.3% of the images are free from aurora, 12.8% with contamination at high-airmass areas, 22.9% with contamination at low-airmass areas, and 9% with aurorae all over the sky. This is consistent with the above quantitative Nigel results, although the data were taken in different years.
It has been noticed from KLCAM data that the intensity of aurorae has a very wide distribution, therefore weak aurorae probably occur more frequently than what naked eyes can detect. Quantitative analyses on the data are necessary and expected, and monitoring should continue to span multiple years.
4.6. THz Transmission and PWV
Site testing for terahertz or sub-mm (1 THz ≡ 0.3 mm) is less complicated because the ultimate determining factor for the atmospheric transmission in this spectral region is the perceptible water vapor. Studies have confirmed Dome A being the best site on the ground for THz observations.
The first direct measurements of the THz atmospheric transmission above Dome A were made with Pre-HEAT at 661 GHz (453μm) in 2008. The best 25% atmospheric transmission in winter was 80%, corresponding to a PWV of 0.1 mm, and daily averages could be as low as 0.025 mm. This suggests that new far-infrared spectral windows are opened at Dome A for many sciences like star formation, the life cycle of interstellar matter, and evolution of galaxies, etc.
By modeling the water absorption bands at 710–740 nm and 800–840 nm in the Nigel spectra and calibrating against satellite data, Sims et al. (2012b) managed to derive the best 25% of PWV of 0.09 mm, consistent with Pre-HEAT results. They also demonstrated, through modeling, the benefits of the dry air to optical and near-IR transmission between 700 nm and 2.5μm.
The measurements of atmospheric radiation from 20μm to 350μm was carried out by FTS (Sect. 2.3.1) in 2010–2011 and transmittances were derived for the whole spectral region. Substantial transmission in atmospheric windows throughout the whole band was revealed, such as the windows above 7.1 THz with transmittance greater than 40%. Moreover, the time fraction of the extremely dry conditions, thus opening the observing windows, is much greater than at other sites where observations in these windows can be attempted (Shi et al. 2016). Based on current modeling, the derived median PWV is 0.16mm in winter (April to September) and 0.19mm for the entire year (Qijun Yao and Zhenhui Lin, private communications).
Given that "Ridge A" is in the vicinity of Dome A and its similar altitude, the dry conditions there are expected to be similar or even slightly better than at Dome A based on estimates with satellite data (Saunders et al. 2009). This is yet to be verified by the actual measurements and results from HEAT (Sect. 2.1.3) 8.
5. Instrumentation
Although the atmospheric properties favor Dome A to be the best site on earth for optical, IR, and THz astronomical observations, there remain great challenges in instrumentation as well as logistics, some are even comparable to space. Tremendous efforts have been made to address the issues that include low temperature, easily icing/frosting due to saturated water vapor in the air, limited power supply, limited bandwith of communication, etc. Most of the difficulties were known from earlier experiments in Dome C and South Pole and they were taken into account for development of instruments.
Conquer low temperature
PLATO and PLATO-A provided a thermal-controlled space in the IM for electronics as well as small instruments that could look through the windows on the roof (e.g., Gattini, Nigel, Pre-HEAT, FTS, etc.). For others, they could be placed outside on the roof (e.g., HRCAM, KLCAM etc.) or had to be installed on the snow surface separately (e.g., CSTAR, AST3, Snodar, KL-DIMM, etc.).
As the first experiment, CSTAR did not have any moving parts to avoid possible mechanical failure, so it did not have a focusing mechanism. To deal with focus change due to the huge temperature difference between +30°C during assembly and –80°C at Dome A, the main structure that supports its optical system was made of INVAR36 which has very low coefficient of thermal expansion (CTE, Yuan et al. 2008). This was also applied to AST3 (Yuan et al. 2014, 2016; Li et al. 2019). For the same reason, KL-DIMM selected a telescope tube made of carbon fiber to work between –30°C and –80°C as its focus could be adjusted on-site in summer (Ma et al. 2018b).
Low temperatures can easily cause mechanical failures, such as stuck moving parts, because materials of different CTEs are used for gears or the gear grease is not of the grade for temperature low enough. This often happens with commercial products and can be fixed with applying proper grease and upgrading some parts made with the same material. These approaches have been successful for the AP 1600 mount of KL-DIMM (Ma et al. 2018b).
To make sure the moving parts can work at Dome A, it is very necessary to test in a cold chamber all moving components as well as the whole instrument if size permits. Cooling a part down to a temperature and then checking its functionality at room temperature only verifies its storage temperature, not working temperature, as was a mistake made with the wind turbine experiment. Therefore, simulating the actual operation of instruments at a winter temperature of Dome A is extremely important as it will reveal the weak links.
Cold tests should also be applied to computers or other electronic equipment down to –20°C if placed inside PLATO or to the lowest temperature in the specification if installed outside. For example, the AST3 CCD controller was tested to work well at –55°C as specified, but it would be damaged at a lower working temperature. Therefore, thermal protection must be provided, usually using insulation materials to keep it at a working temperature with heat generated from its own operation. This has been a common practice at Dome A. However, a danger in this practice is that, if there was an extended power outage, the temperature of the electronic equipment could drop below its specification and a cold start would damage it.
To solve the above problem, an active thermal control system with temperature sensors was introduced and it has an external heating component to warm up the equipment to its working temperature before turning it on after it stopped work for a while. The active thermal control system also has an internal heating component that can be modulated for the equipment to work in a proper temperature range, also avoiding overheating. This active approach worked perfectly for KLCAM, the electronic boxes of KLAWS and KL-DIMM, and CODS even during power outages in winter (Shang et al. 2016, 2018).
In many cases, laptop computers had to be used outside close to instruments at a temperate down below –30°C and often shut themselves down for protection in a very short period if not kept warm. It has been verified that it is actually the battery that cannot withstand the low temperature, so a modification of the power supply to laptops made the work outside much easier and more efficiently during the 35th CHINARE (Keliang Hu, private communications).
For future large telescopes, vertical temperature gradient also has to be addressed in order to keep an ideal shape of a mirror or an antenna.
Defrost and deice
Although the PWV at Dome A is very low (Sect. 4.6), the relative humidity is usually close to 100% (Hu et al. 2018). Because of the saturated water vapor in air and frequent temperature fluctuation, it is common for surfaces to suffer from frosting in Antarctica. Frosting on mirrors or glass windows exposed to open air was known, but cannot be simulated in a cold chamber. ITO conductive coating was used, once turned on, to generate heat to sublimate frost or prevent it from building up. This worked greatly for CSTAR and KL-DIMM, but not very efficiently for AST3, possibly because of the much larger area of its aperture. Other approaches were developed for AST3, such as the inner and outer air blowers, but the blowers could not be replaced if failed and negative tube seeing could arise if turned on. So more efficient defrosting methods need to be explored.
Ice was found in between the teeth of AST3 gears and they are considered the main reason of the RA or Dec axis getting stuck. The ice could be the compressed frost or blowing snow, but there was not enough power of heat to remove it in winter. The current approach was to make good gear covers to prevent snow being blown in as much as possible, but frosting could still occur as it was not possible to make airtight covers because of wiring. This worked well only in 2017, but improvements or new approaches are still needed.
Careful thermal design can also help to solve the frosting problem. KLCAM is a good example with intensive thermal control designs (Shang et al. 2018). Besides a low-power active thermal control system mentioned above, the inner structure of KLCAM was designed to guide any heat generated inside only to the lens at the top and therefore prevent any frost from building up. This kind of designs certainly works for small instruments, but the design concept can also be learned for large ones.
Cope with low power and low bandwidth
PLATO-A can provide 1kW in average in winter to support everything on-site. Not planning the power budget carefully would cause struggled operations which had happened. Any purchased devices and equipment must be selected to run on low power if available, and customized equipment have to take every watt into consideration, such as the data storage array in CODS which turns on only one disk at a time to save power and also for data safety (Shang et al. 2012, 2016, Sect. 2.5.1).
With Iridium Openport, an affordable plan can provide data of only hundreds of MByte per month. This is far from enough for transferring image data from CSTAR, AST3, or even KL-DIMM. Therefore, real-time pipelines were developed and only useful results can be retrieved promptly from Dome A. The most complicated pipeline so far is for AST3 (Ma et al. 2020b).
The monitoring and operational data for instruments can be transferred back with scientific results. However, since the bandwidth over Iridium is limited, expensive, and sometimes unstable, a dedicated narrow-band file transfer protocol was developed and implemented (Huang et al. 2020). This demonstrates one of numerous examples of customized solutions for astronomy from Dome A.
Unattended operation with redundancy
It must be emphasized that instruments operated at Dome A are not just robotic, they are unattended for at least a year until the next traverse team arrives, and are prone to single points of failure in the harsh environment. Therefore, reliability ultimately determines the success of an instrument or device. Among the techniques in reliability engineering, avoidance of single point of failure is crucial in this situation and redundancy is an effective solution.
Redundancy was taken into account since the beginning of CSTAR project. Four telescopes served as backups for each other and were complementary with different filters if all had worked well.
For an individual instrument, such as one AST3 telescope, redundant devices and equipment were provided wherever it was possible. An example of success was the CODS system which had an identical backup for each of its three subsystems (Sect. 2.5.1). Even for the single CCD camera and controller, redundant operating system was developed to enable image acquisition from two computers by splitting the signals over optical fiber from one CCD to two acquisition cards (Shang et al. 2016). This is certainly not necessary for a normal observatory. However, this technique had saved the 2017 observing season when one acquisition card was damaged by cosmic rays early in the season.
To achieve fully automatic and unattended operation of instruments, customized software are inevitable, not just for pipeline, but also for observing planning (Liu et al. 2018c), data acquisition and storage, coordination of devices (Hu et al. 2016) and communication with the telescope (Li & Wang 2013). A complicated software suite was developed for AST3 sky survey (Hu et al. 2016) and it can be generalized for any robotic, unattended observatory (Hu et al. 2018).
To aid the operation and sky survey, monitoring information including the status of instruments were always made online in real-time. Remote, manual operation was possible and available, but it is the last resort for a telescope at Dome A. A summary of automation of AST3, the representative instrument, can be found in Ma et al. (2020b).
Unstable ice sheet
There remains a very important, but currently neglected problem that will challenge future instrumentation at Dome A. Zhou et al. (2013) found that the south celestial pole moved around in CSTAR images although CSTAR had no moving parts and was supposed to stare at the south celestial pole all the time. This indicates that the entire ice sheet is moving around.
The 2008 CSTAR images have shown that the moving is roughly random during a day and can be up to 45''; while for the whole observing season in 2008, the locus covered a range up to 5' with a preferred direction.
This did not affect either CSTAR or AST3 very much as they all have very large FOVs. However, for future large telescopes and/or spectrographs that require accurate pointing, this issue has to be studied carefully and taken into consideration.
6. Future
Over more than ten years, Dome A has been gradually confirmed to be the best site on earth for optical, infrared, and THz astronomical observations. To take advantage of the unique resources sooner than later, large projects have been proposed.
Kunlun Dark Universe Survey Telescope (KDUST) will be a 2.5m optical/IR telescope with a large FOV of 1.5° × 1.5° and an image quality of 0.2'' FWHM to match the free-atmosphere seeing (e.g., Zhu et al. 2014). It is expected to be able to compete with 6m class telescopes at the best mid-latitude sites. The main research areas by KDUST survey include dark energy, dark matter, Galactic structure, and exoplanets, etc. (e.g., Zhao et al. 2011).
The 5m Dome A TeraHertz Explorer (DATE5) will work at wavelengths around 350μm (FOV 10'×10') and 200μm (FOV 5'×5') in the THz frequencies (e.g., Yang et al. 2013). These wavelengths are chosen based on the dry conditions at Dome A and also for studies of starburst galaxies and star formation, interactions between black holes and stellar/interstellar matter, life cycle of matter in the near universe, molecular clouds in Milky Way, and origin of solar system, etc.
These two telescopes are also planned to be unattended before Kunlun Station becomes a winterover station. The demands for logistics including power are huge but manageable. The construction is expected to take 5 years after the projects are approved.
In the meantime, the current site testing instruments will still be operating not just to collect more monitoring data, but also provide long-term assessment of the site and critical information for the design, construction, and operation of KDUST and DATE5.
Further site testing is still needed because parameters like the vertical turbulence profile ( ), and thus the coherence time and isoplanatic angle, etc. are still not clear, but these need to be understood for future adaptive optics and interferometry applications. Relevant instruments have been proposed such as the Multistar Turbulence Monitor (Hickson et al. 2019, Sect. 4.2). Moreover, A Lunar Scintillometer (Hickson & Lanzetta 2004) called KunLun Turbulence Profiler (KLTP) is being developed. KLTP will have multiple photo-diodes arranged linearly with different separations to measure scintillation from the Moon. The correlations between intensities from the pairs of detectors with different baselines can lead to the measurements of turbulence at different heights.
Daytime observations of the Sun and bright stars will continue to explore more potential of Dome A, and AST3-2 could be revived.
The expected low IR sky background are yet to be confirmed with measurements at Dome A. Nevertheless, a new project named Kunlun Infrared Sky Survey (KISS) was proposed to equip an infrared camera to the third AST3 telescope AST3-3. KISS also plans to carry out time-domain studies, but specifically in the 2.36μm Kdark band which benefits very low background in Antarctica. For this project and also for solving the problem of heat dissipation inside the telescope tube, AST3-3 has a modified design to move the focal plane outside its tube by adding a fold mirror. With a 2k×2k HgCdTe detector, the IR camera will have a plate scale of 1.35' pixel−1 and an FOV of 46'×46' (Lawrence et al. 2016), and it is being built at Australian Astronomical Observatory based on the collaboration between China and Australia.
Depending on the outcome and experience from KDUST and DATE5, even larger projects are expected, but this has to develop with the logistic support from Kunlun Station which will evolve into a winterover station.
Acknowledgements
The author is grateful to the CHINARE teams supported by CAA and PRIC. The author thanks M. Ashley, K. Hu, Y. Hu, P. Jiang, Y. Li, Z. Lin, B. Ma, X. Pang, J. Wang, S. Wang, X. Yang, Q. Yao, for materials and helpful comments. We are also thankful for AAS and Springer Nature for granting us permission for figure reproduction. Z. Shang has been supported in part by the National Natural Science Foundation of China (Grant Nos. 11733007, 11673037 and 11273019) and the National Basic Research Program (973 Program) of China (Grant No. 2013CB834900), the Chinese Polar Environment Comprehensive Investigation & Assessment Program (Grant No. CHINARE2016-02-03).
Footnotes
- 1
- 2
- 3
- 4
- 5
- 6
- 7
- 8