Abstract
The Moon has no significant atmosphere, thus its surface is exposed to solar ultraviolet radiation and the solar wind. Photoemission and collection of the solar wind electrons and ions may result in lunar surface charging. On the dayside, the surface potential is mainly determined by photoelectrons, modulated by the solar wind; while the nightside surface potential is a function of the plasma distribution in the lunar wake. Taking the plasma observations in the lunar environment as inputs, the global potential distribution is calculated according to the plasma sheath theory, assuming Maxwellian distributions for the surface emitted photoelectrons and the solar wind electrons. Results show that the lunar surface potential and sheath scale length change versus the solar zenith angle, which implies that the electric field has a horizontal component in addition to the vertical one. By differentiating the potential vertically and horizontally, we obtain the global electric field. It is found that the vertical electric field component is strongest at the subsolar point, which has a magnitude of 1 V m−1. The horizontal component is much weaker, and mainly appears near the terminator and on the nightside, with a magnitude of several mV m−1. The horizontal electric field component on the nightside is rotationally symmetric around the wake axis and is strongly determined by the plasma parameters in the lunar wake.
Export citation and abstract BibTeX RIS
1. Introduction
Celestial bodies exposed to the space environment will accumulate charge due to the incident solar radiation and space plasma, resulting in an inhomogeneous plasma sheath around the body. Previous research has shown that the equilibrium potential of a celestial body can be determined by balancing all charging currents, and among them transfer of charge from the ambient plasma, photo-electron emission and secondary electron emission of the surface are most important. Moreover, all currents are determined by the surface characteristics and environmental conditions. Without photoemission, the incident electron flux from the ambient plasma is usually larger than the ion flux, and the equilibrium surface potential will have a negative value, with the potential in V on the same order of magnitude as the plasma electron energy in eV. However, if the photoelectron emission dominates, the equilibriumsurface potential will have a positive value on the same order of magnitude as the photoelectron energy in eV (Whipple 1981).
The lunar exosphere is extremely tenuous, thus it is usually negligible. As a result, the lunar surface is exposed to solar radiation, the solar wind or the Earth's magnetosphere plasma. The incident ambient plasma injection, photoelectrons and secondary electrons emitted by the lunar regolith can all cause charging of the lunar surface. From the ion measurements on the lunar surface by Apollo 14, Freeman & Ibrahim (1975) deduced that the surface potential is a function of the solar zenith angle (sza), with the highest potential at the subsolar point (sza = 0), which is about +10 V. The surface potential declines with sza. At the terminator, the potential drops to about −100 V. From the electron reflectometry of Lunar Prospector (Halekas et al. 2002), the potential difference between the nightside lunar surface and the spacecraft is found to be −35 V, and hence the scale thickness of the electric double layer is 1 ∼ 2 km on the nightside. However since the potential of the spacecraft is unknown, the lunar surface potential on the nightside cannot be deduced. The surface charging is a result of several coupled mechanisms, and the electric condition on the surface should be much more complicated than the scenario depicted by such limited measurements.
Classic plasma sheath theory can help in understanding the lunar surface charging and surface electric field. By solving Poisson's equation, the potential and electric field inside the sheath, as well as their variations with sza, can be calculated (Manka 1973). In recent years, a Particle-In-Cell (PIC) simulation has been applied to the lunar sheath. Through one dimensional (1D) PIC simulation, the effects of the non-Maxwellian distribution of photoelectrons, and the solar radiation variation on the lunar sheath were investigated (Poppe & Horányi 2010). PIC can also be extended to the three dimensional (3D) context to simulate the local electric field resulting from small scale lunar topology (Anuar et al. 2013).
Due to uncertainty about the plasma environment inside the lunar wake, previous simulations of the lunar sheath and surface electric field are usually limited to the dayside, where the reflection of the solar wind by the lunar surface is not considered, and the solar wind is treated as undisturbed at the upper boundary of the lunar sheath. Our knowledge about the ambient plasma around theMoon mainly comes from spacecraft observations at altitudes of tens kilometers above the lunar surface. Results show that, on the nightside, the ambient plasma is quite different from the undisturbed solar wind upstream of the Moon (Halekas et al. 2005).
Both observations and theoretical works agreed that the surface potential is a function of sza (Freeman & Ibrahim 1975; Manka 1973), since both the solar radiation and solar wind change with sza. It follows naturally that a large scale horizontal electric field exists on the Moon in addition to the vertical electric field, especially at the dawn-dusk region, where the solar radiation and solar wind conditions change dramatically. In this paper, based on the lunar plasma observations in recent years, based on a 1D sheath model (Lei et al. 2016), potential distributions at different sza are analyzed and a global 3D electric field distribution is deduced when the Moon is submerged in the solar wind.
2. Lunar surface sheath model
In the solar wind, the Debye length (λd) is much smaller than the radius of the Moon (Rm). Ignoring local geological features, a 1D model is suitable to describe the plasma sheath over the surface of the Moon (Nitter et al. 1998). Supposing x is perpendicular to the lunar surface, the angle between x and the Moon-Sun line is the sza. Ignoring aberration of the solar wind, the solar radiation and solar wind impact the lunar surface along the same direction, which makes an angle of sza with respect to x. The lunar regolith emits photoelectrons under the impact of solar UV. Moreover, the incoming solar wind mostly has low energy, and the secondary electrons emitted by the lunar regolith resulting from bombardment of the solar wind can be neglected (Whipple 1981).
At thermodynamic equilibrium, the potential V and charged particle density n in the sheath are governed by Poisson's equation,
where subscripts i, e and ph represent the solar wind proton, solar wind electron and photoelectron emitted by the lunar surface respectively; e is the elementary charge and ε0 is the vacuum permittivity.
The motion of charged particles satisfies the continuity and energy conservation equations, ignoring gravity, which can be written as


where m, v, q and x are particle mass, velocity, charge and position respectively; q = e for protons, q = −e for electrons; V is the electric potential at x; the subscript 0 denotes the initial state. Usually, the thermal velocity of a proton is much lower than its bulk velocity, so v in Equation (1) is approximately equal to the proton bulk velocity; on the contrary, the electron thermal velocity is much higher than its bulk velocity, and v in Equation (1) is taken as its thermal velocity.
It is assumed that both solar wind electrons and the photoelectrons emitted by the lunar surface are Maxwellian. The distribution function can be written as
where me is the electron mass, nj is the number density, Tj is the electron temperature, k is the Boltzmann constant, j = e for solar wind electrons and j = ph for photoelectrons. Integration of Equation (2) in the velocity space yields the electron density ne and nph at x. Since the proton is mono-energetic, ni can be obtained through energy conservation and the continuity equation,
where subscript 0 represents the incoming solar wind parameters.
Combining Equations (2), (3) and (4), together with the quasi-neutrality and zero net current conditions at infinity, a steady state sheath model can be established to determine the potential distribution inside the sheath, which is expected to depend on the solar radiation and solar wind conditions.
3. Sheath profile at different sza
3.1. Solar Wind Conditions Near the Moon
Early studies believed that the solar wind plasma is absorbed by the lunar surface, leading to the formation of a plasma wake behind the Moon, meanwhile the interplanetarymagnetic field (IMF) passes through theMoonwithout significant distortion in its direction or magnitude.
The characteristics of solar wind electrons and the magnetic field near the Moon are well understood thanks to Lunar Prospector's long term observations at altitudes of several tens of kilometers. Halekas et al. (2005) give the normalized solar wind electron and temperature binned by the angle from the wake axis, which is aligned with the solar wind flow direction. Since we ignore the solar wind aberration here, the angle from the wake axis coincides with sza. The solar wind electron density and temperature stay largely undisturbed on the dayside. At sza > 90°, the density decreases monotonically to a minimum at the center of the wake, while the temperature increases first, shows a high level of variability around sza = 150°, and then decreases towards the center of the wake (Fig. 1). Here we should note that although the electron temperature inside the wake might be several times that of the undisturbed solar wind, it is still too low to produce significant secondary electron emission when the solar wind electrons impact on the lunar surface (Whipple 1981).
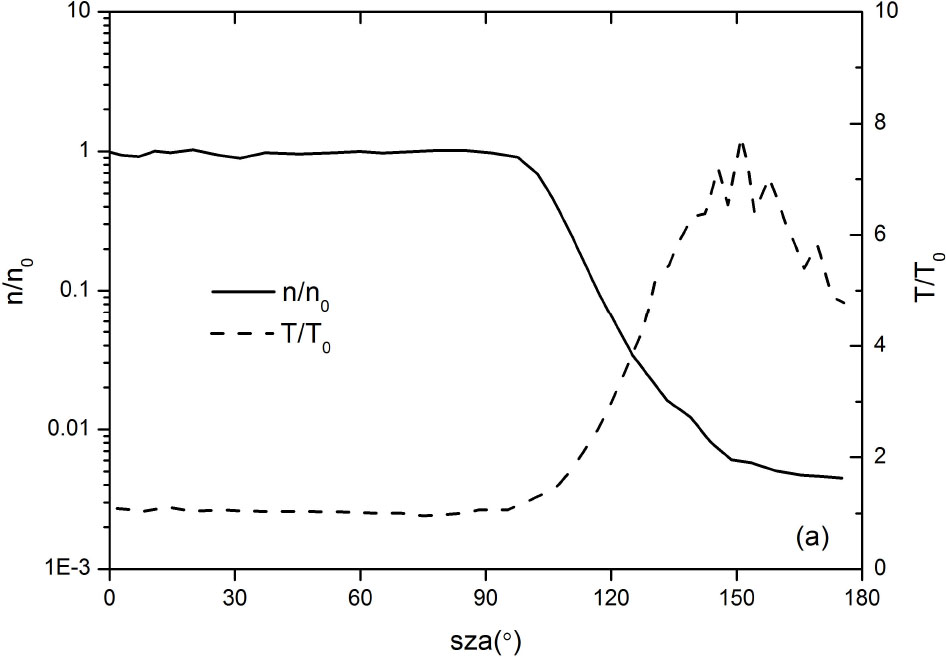
Fig. 1 Normalized solar wind electron density and temperature versus sza in the quasi-perpendicular wake regions, adapted from Halekas et al. (2005).
Download figure:
Standard imageHowever, the proton behavior is not so well known in the wake. With higher thermal velocity, the electrons refill the wake along the magnetic field lines much more quickly Fig. 1 Normalized solar wind electron density and temperature versus sza in the quasi-perpendicular wake regions, adapted from Halekas et al. (2005). than the ions. So for a long time, it was believed that the near wake is a negatively charged region. The scale height of the electric double layer in the near wake can be as large as 200 km (Borisov & Mall 2002). However, recent observations suggest that the ambipolar electric field at the lunar wake boundarymay accelerate the solar wind protons deep into the lunar wake (Nishino et al. 2009). Furthermore, the solar wind particles impacting on the dayside are not totally absorbed by lunar regolith, with 1% or more protons reflected or scattered by the lunar surface (Saito et al. 2008); meanwhile, the lunar regolith may also be sputtered by the solar wind. All the charged particles, which are reflected, scattered and sputtered, may be accelerated by the solar wind electric field, moving around the Moon into the near wake (Nishino et al. 2009; Wang et al. 2010). It can be inferred from these observations that the near wake is not a negatively charged region, but a region with quasineutrality (Nishino et al. 2009).
Based on these observations, it seems reasonable to assume that the protons and electrons have the same density to keep quasi-neutrality in the near wake. We also assume that the protons have the same temperature as the electrons. Because the proton velocity is much lower than the electron thermal velocity, its effects on the sheath are relatively minor. The uncertainty in the temperature might cause error in the sheath potential, but no significant influence is expected.
In the following calculation, the undisturbed solar wind parameters on the dayside are v0 = 400 km s−1, n0 = 5 cm−3 and Te = 15 eV, while the nightside parameters follow LP's observations (Fig. 1). The solar wind temperature in the wake is fitted with a Gaussian function centered at sza = 150°. The temperature of a photoelectron emitted by the lunar regolith is 1.47 eV, and the photoelectron current density is 4.5 × 10⁻⁶ cos(sza) A m−2 (Nitter et al. 1998). The photoelectron emission is cut off when sza ≥ 90°.
3.2. Sheath Profiles vs. sza
3.2.1. Dayside sheath
On the dayside, the photoelectron current density, as well as the solar wind proton normal incident flux, depends on sza. The sheath potential profiles for sza = 0°, 50°, 80° and 90° are shown in Figure 2. As expected, the sheath potential profile changes significantly with sza. When sza is low, photoelectron emission is high. Near the surface, the photoelectrons have a much higher concentration than the solar wind particles (see Fig. 3, sza = 0°), so the sheath is also called a "photoelectron sheath." The equilibrium surface potential is positive. Accumulation of photoelectrons inside the sheath leads to a potential trap as seen from the non-monotonic potential profile. The photoelectron emission and normal incident proton flux decrease with increasing sza. At sza = 80°, the entire sheath, including the surface, has a negative potential. At sza = 90°, there is no photoelectron emission, but the solar wind electron with high thermal velocity can still impact the surface to build up a negative potential (Fig. 2, sza = 90°). At the same time, the proton can still move into the sheath with the thermal velocity although its normal bulk velocity is 0. Consequently, we set the minimum velocity of the proton as the ion acoustic velocity (Nitter et al. 1998). Otherwise without positive ion charge, no stable sheath can form in front of a negatively charged absorbing surface (Riemann 1991). Under the attraction of the negatively charged surface, protons are gathered around the surface (Fig. 3, sza = 90°), forming an ion sheath, screening the effect of negative surface potential within a distance of about 100 m.
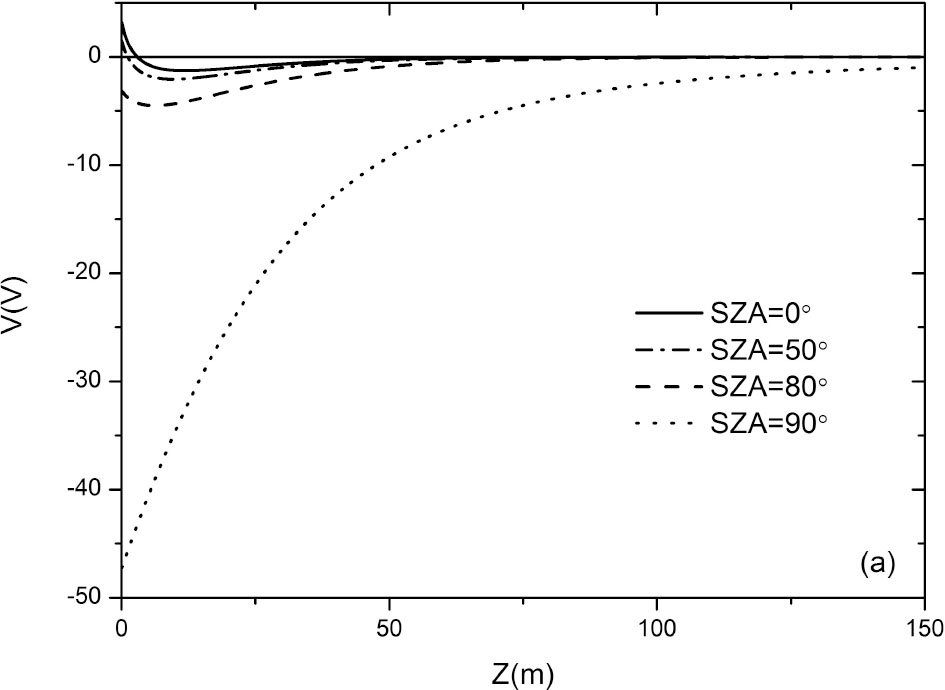
Fig. 2 Sheath potential profiles from the subsolar (sza = 0°) to the terminator on the dayside, for sza = 0°, 50°, 80° and 90°.
Download figure:
Standard image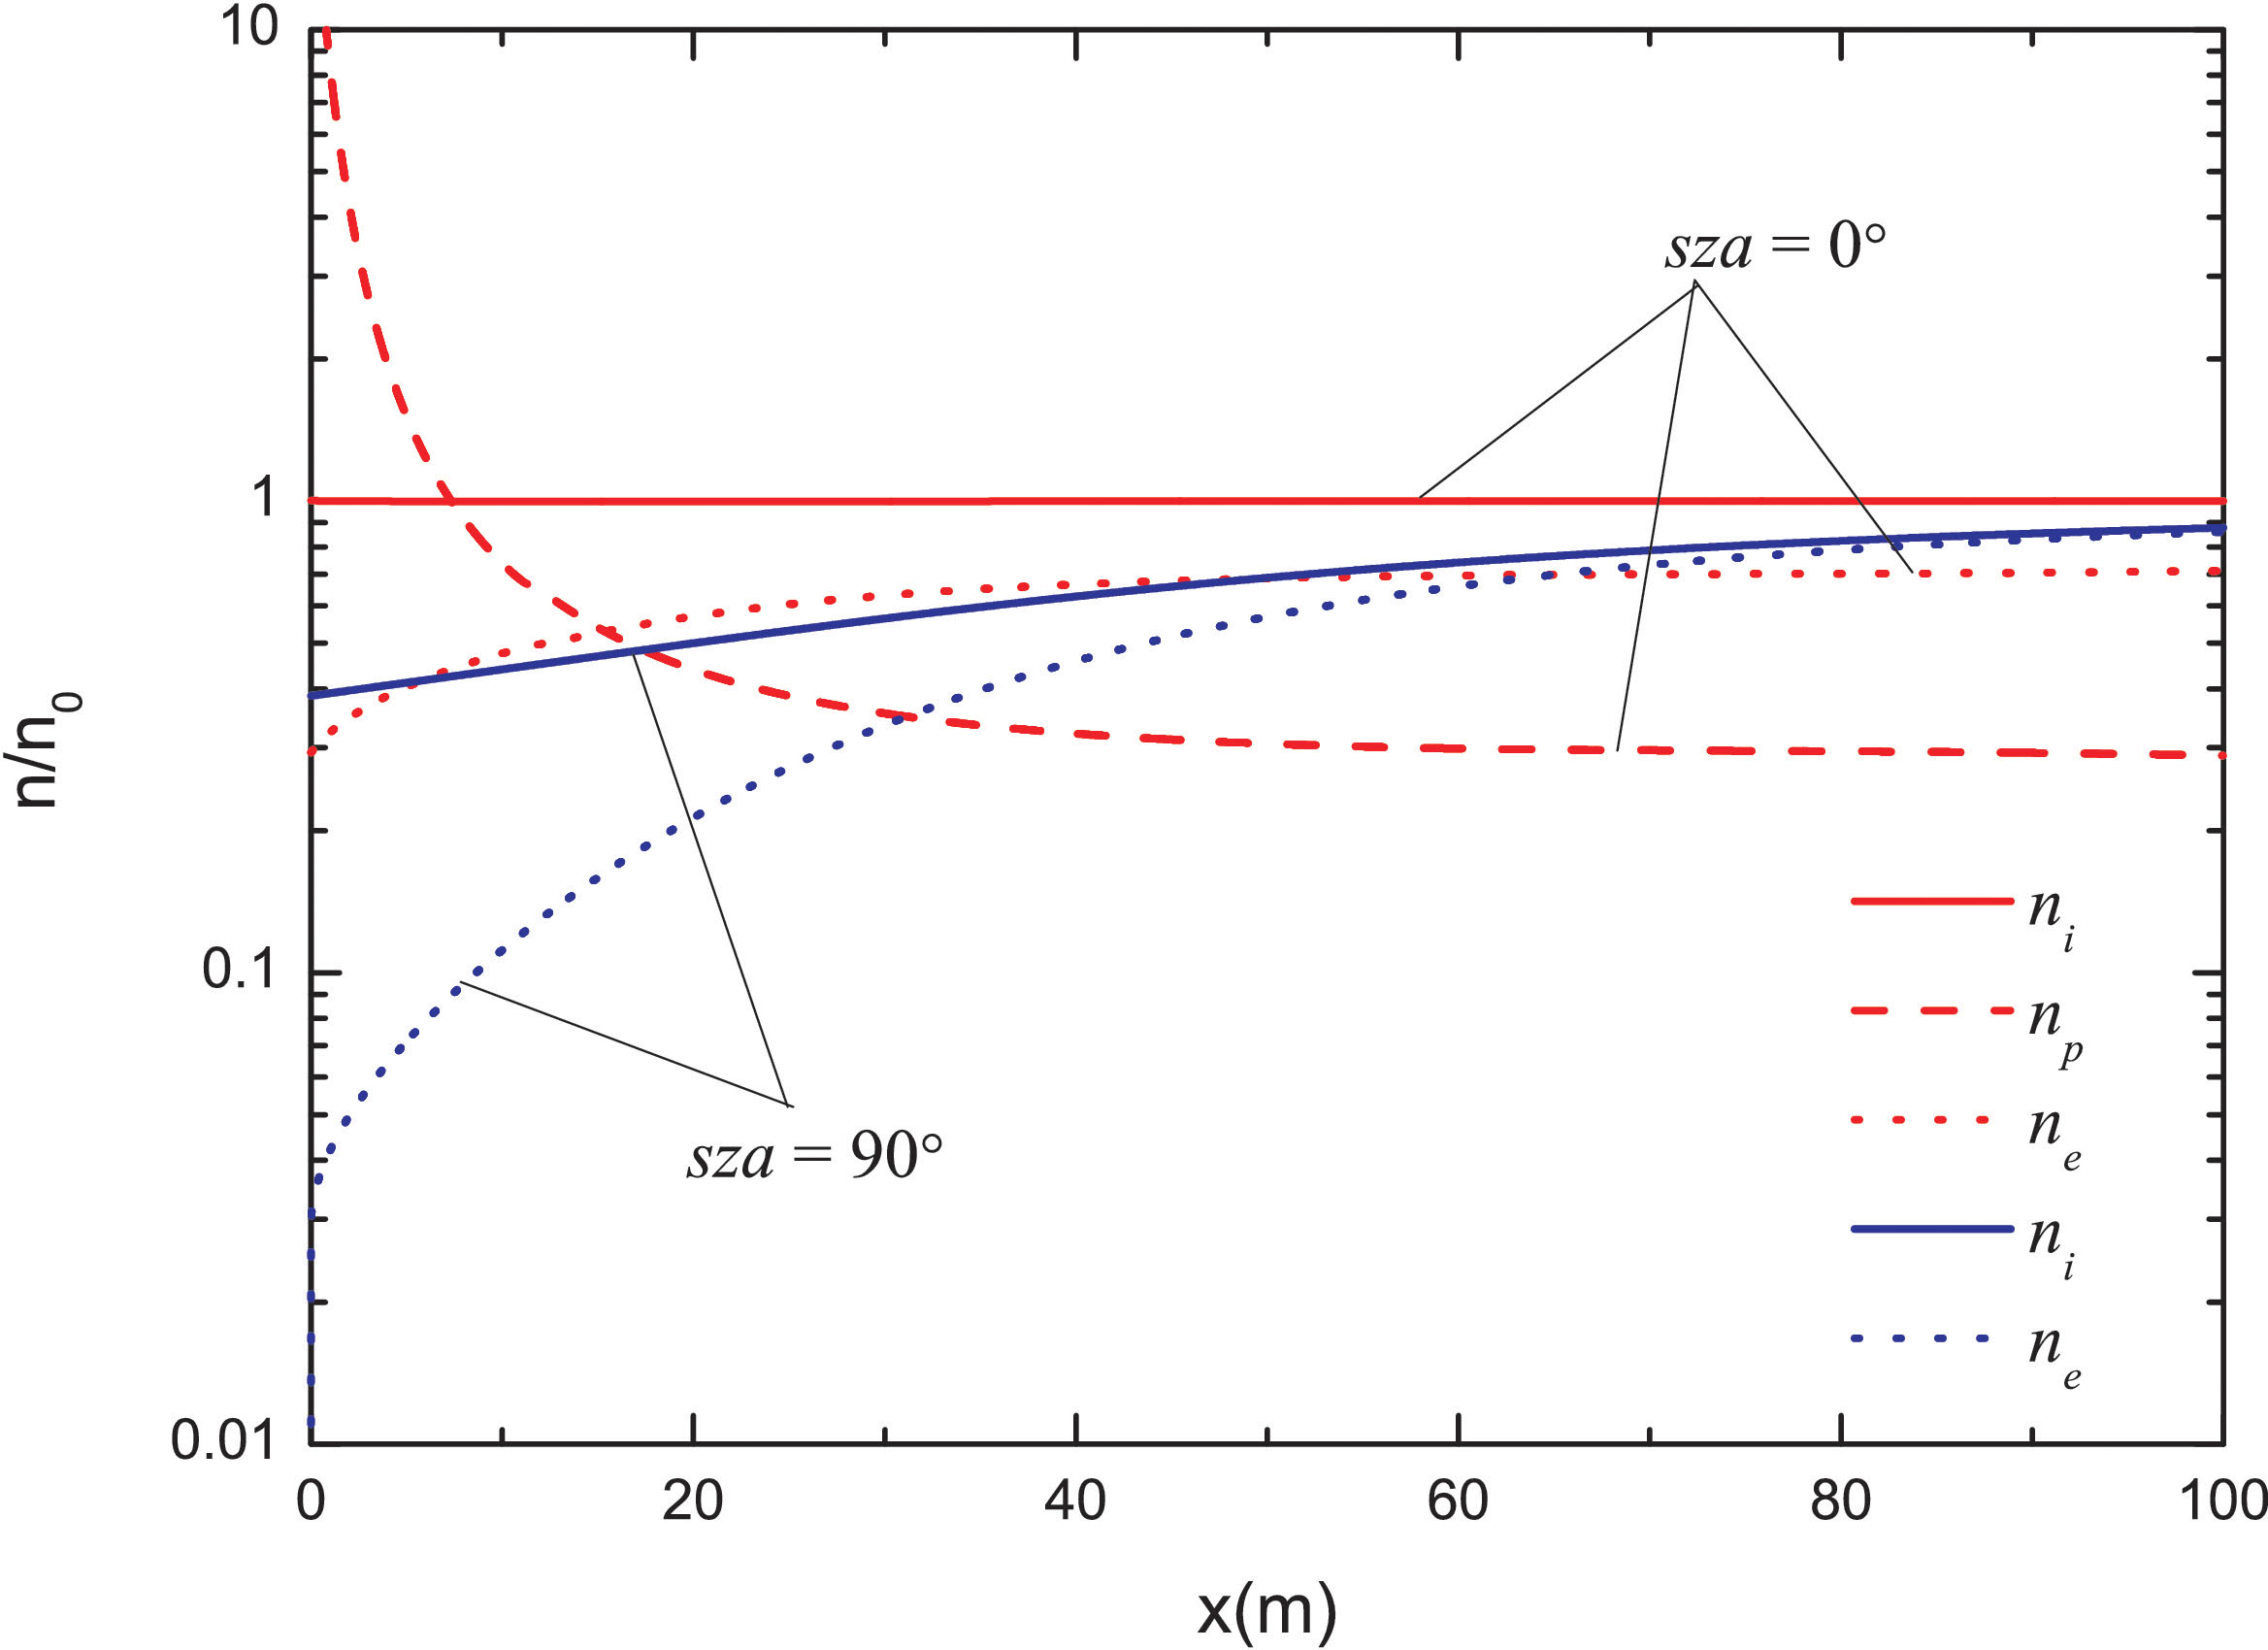
Fig. 3 Charged particle densities in the sheath when sza = 0° or 90° (Color version is online).
Download figure:
Standard imageIn a photoelectron sheath (sza = 0°), photoelectrons dominate near the surface. The proton density stays almost constant throughout the sheath. The proton serves as a component in current balance, especially far away from the surface where the proton and electron density are nearly equal. On the contrary, in an ion sheath (sza = 90°), the proton density is higher than the electron density in the whole sheath.
3.2.2. Nightside sheath
When sza is above 90°, although there is no surface photoemission, and the plasma density inside the wake is very low, the lunar surface can still accumulate charges due to its low conductivity (Borisov & Mall 2002). Referring to the result of particle simulation (Ye 2010), we assume that a proton in the wake has no drift velocity toward the surface, but can reach the surface with the ion acoustic velocity to maintain a stable sheath.
As expected, the surface potential stays negative due to the higher mobility of electrons in the wake. The surface potential decreases with sza as the electron temperature increases in the wake, and reaches a minimum value of −300 V at sza = 150° (Fig. 4), but increases when sza > 150°. At the center of the wake (sza = 180°), both the electron temperature and density are lower, and the surface potential is higher than that at sza = 150°. Figure 4 suggests that the electron temperature inside the wake is a dominant factor in determining the surface potential on the nightside. According to Figure 4, the thickness of the sheath is more than several hundred meters on the nightside. Our result is close to the observation results by LP (Halekas et al. 2003), but much smaller than that estimated by the model which assumes that the near wake is negatively charged with an electric double layer as thick as 200 km (Borisov & Mall 2002).
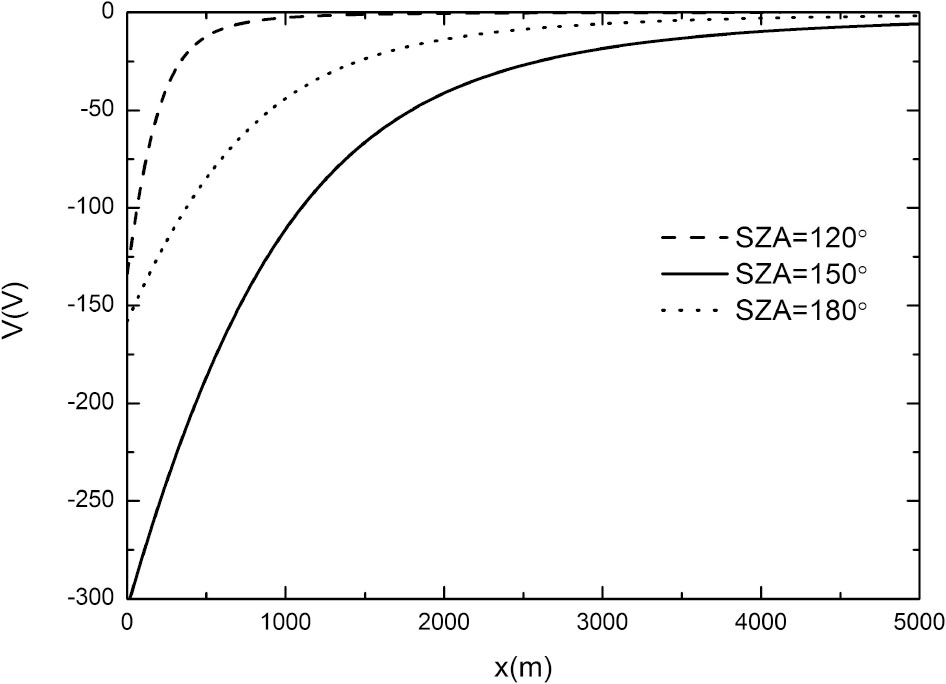
Fig. 4 Sheath potential profiles on nightside.
Download figure:
Standard image3.3. Global Electric Field
The changes in the surface potential and Debye length vs. sza are summarized in Figure 5. At sza ≤ 80°, the surface potential changes by several volts from positive to negative; while the Debye length stays around 1 m. Around the terminator (sza = 90°), as the solar wind parameters change abruptly with sza, the surface potential drops while the Debye length increases sharply. On the nightside, the surface potential can reach negative several hundred volts, and the Debye length can be as large as several hundred meters (Fig. 5). The slope discontinuity at sza = 90° is caused by the abrupt cutoff of solar radiation at the terminator.
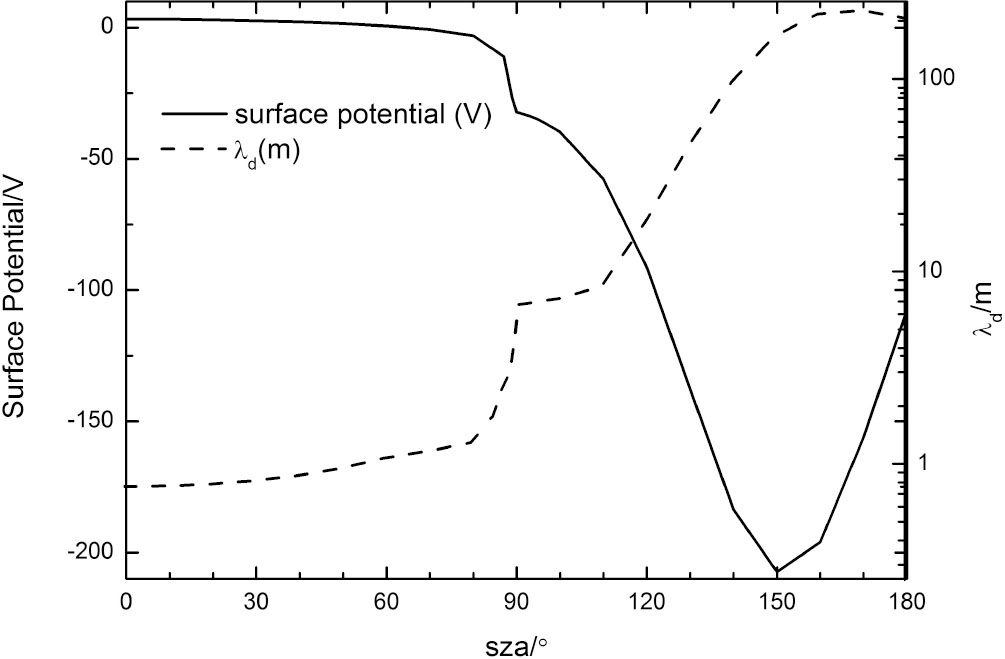
Fig. 5 Lunar surface potential and Debye length versus sza.
Download figure:
Standard imageThe changes in the surface potential and sheath thickness vs. sza imply that there is a horizontal gradient of the surface potential besides the vertical gradient. Theoretically, determining the 3D potential distribution needs a 3D plasma sheath model. However, a 3D global lunar surface sheath model will encounter difficulty because of the large difference between the vertical and horizontal scales. As a measure of the vertical scale, the Debye length is on the order of 100m (Fig. 5), corresponding to a vertical potential gradient of several V m−1. The horizontal scale is measured in sza. For example, a 1° change in sza at the equator corresponds to a horizontal distance of 30 km. From Figure 5, when sza changes from 0° to 80°, the surface potential has a change of ∼10 V, or the horizontal gradient is on the order of μV m−1. Even at the terminator and on the nightside, the horizontal potential gradient is several mV/m, still 3 orders lower than the vertical gradient. So when solving a 3D global sheath model, if the computation domain is meshed according to the vertical scale, the horizontal gradient might be overwhelmed by numerical error. In other words, the horizontal gradient can be ignored compared with the vertical gradient, or the 3D model degrades into a 1D model. So, we can use the 1D model above to calculate the sheath potential profile at different sza to establish a 2D data set V (x, sza), from which the 3D electric field on the surface and in the sheath can be calculated globally.
In a spherical coordinate system (r, θ, ϕ) centered at the Moon's center, on the surface, θ = 0° is the zenith, and θ = 90°, ϕ = 0° correspond to the subsolar point. sza is a function of θ and ϕ, or sza = cos−1 (sin θ cos ϕ). The electric field components can be calculated by differentiating the potential V (x,sza) according to Equation (5):


The results are shown in Figure 6, with 6(a) and 6(b) showing the vertical and horizontal components respectively. From the figure, the vertical component is mostly positive on the dayside, pointing away from the surface. Near the terminator, the vertical component switches polarity, staying negative on the nightside. At the subpolar point, although the surface potential is not high, the vertical component is largest since the sheath is thinnest there. The horizontal component is actually the intensity, which stays positive as shown in Figure 6(b). The distribution of the horizontal component is quite different from that of the vertical one. On the dayside, the horizontal component is usually very small, except around the terminator, where the horizontal component becomes significant. On the nightside, the horizontal component is larger due to the relatively quick variation of the potential vs. sza. At sza = 150°, the horizontal component is zero since the potential has no gradient there (Fig. 5). The horizontal component is further decomposed into eastward and northward components as shown in Figure 6(c) and Figure 6(d) respectively. The eastward component is in the magnitude of mV m−1 from the terminator to the nightside, pointing to midnight at sza < 150° and pointing to dawn/dusk at sza > 150°. The northward component is relatively large on the nightside (Fig. 6(d)), at sza < 150°, pointing to the equator; at sza > 150°, pointing to the poles.
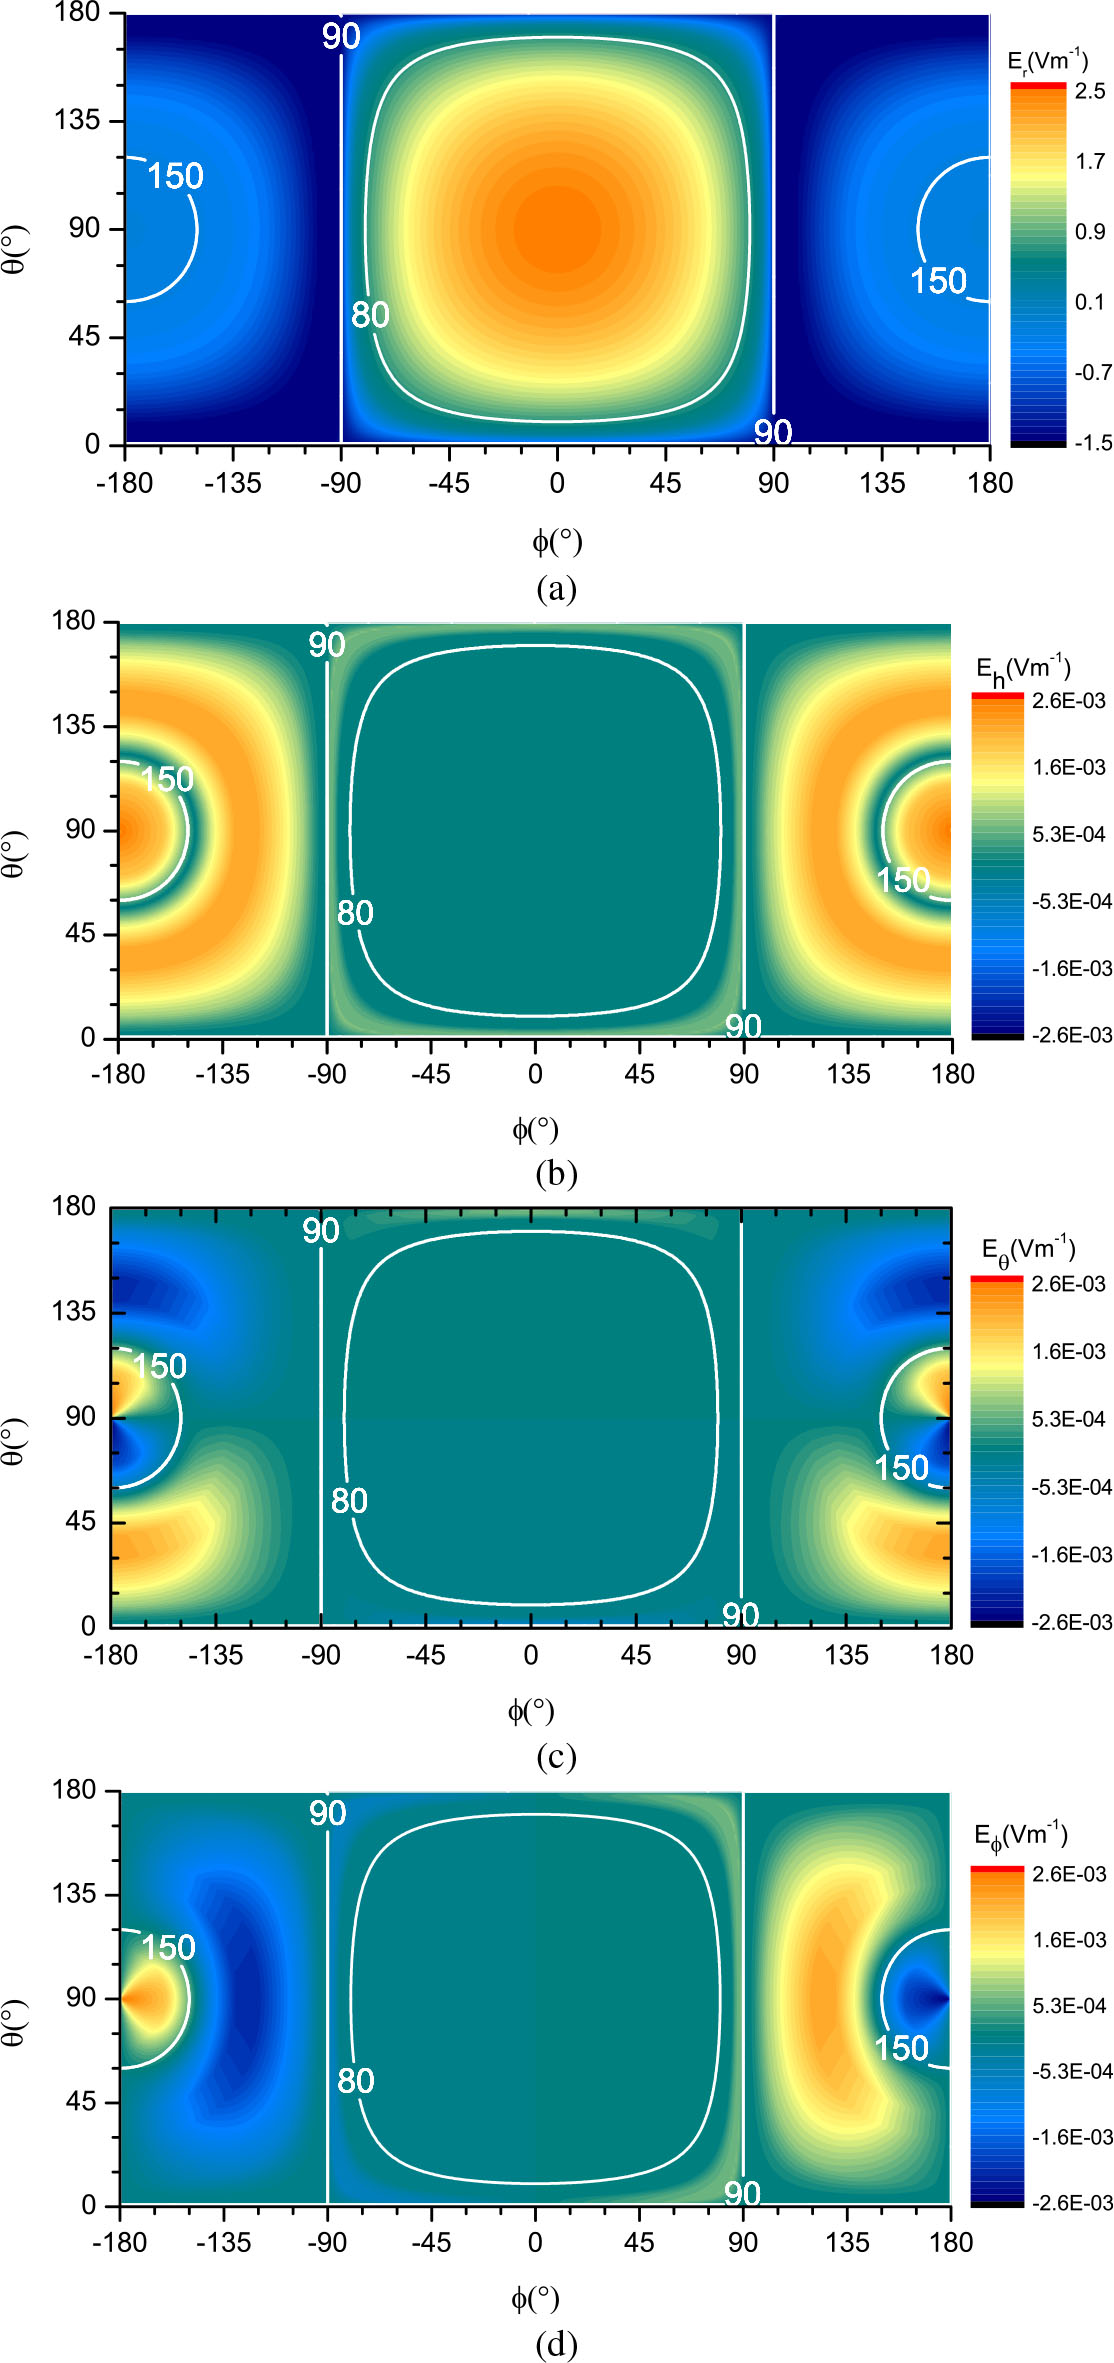
Fig. 6 Electric field components at the lunar surface: (a) vertical; (b) horizontal; (c) eastward; (d) northward. White lines show where sza = 80°, 90° and 150°. Here θ = 0° is the zenith; and θ = 90°, ϕ = 0° correspond to the subsolar point.
Download figure:
Standard imageTo check the details in Figure 6, Figure 7 gives the vertical and horizontal components vs. sza around the terminator. From the dayside to the nightside, the vertical component switches from positive to negative at about 86°; while the horizontal component increases towards the terminator, decreases at sza ≥ 90° corresponding to the potential distribution in Figure 5 and increases again when the solar wind electron temperature increases deep into the wake. We should note here that the vertical and horizontal components are on different scales. Except in a very narrow region where the vertical component switches polarity, the magnitude of the vertical component is always much larger than that of the horizontal component.
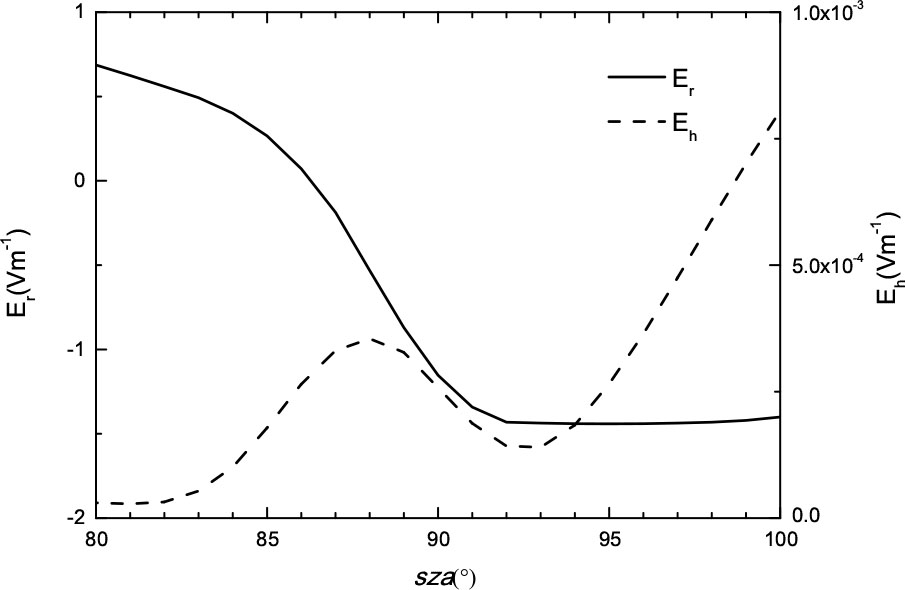
Fig. 7 The change of vertical and horizontal electric field components versus sza at the lunar surface around the terminator.
Download figure:
Standard image4. Conclusions and discussion
Based on the plasma sheath model, the lunar sheath is discussed at different solar zenith angles with different solar radiation and solar wind conditions. A global large scale electric field is deduced from the sheath profiles:
- 1)On the dayside, mostly the lunar surface sheath is dominated by photoelectrons emitted from the lunar surface. The surface potential is positive, and is modulated by the solar wind parameters. On the nightside, the sheath profile is controlled by the plasma distribution inside the lunar wake and the surface potential is negative. The surface sheath thickness varies with sza. At the subsolar point, the scale length of the sheath is smallest, while the scale length of the sheath on the nightside can be 100 times larger than that at the subsolar point.
- 2)The variations of sheath potential and thickness with sza result in the horizontal component of the electric field, besides the vertical one. On the dayside, the vertical component is the main component. The largest vertical component appears at the subsolar point with a magnitude of 1 V m−1. The horizontal component enhances at the terminator and on the nightside, with a magnitude of mV m−1. Around the terminator, the horizontal component points toward the nightside; while on the nightside, the horizontal field may point to or be away from midnight.
The potential distribution in our paper agrees with the Apollo observations (Freeman & Ibrahim 1975), and is also on the same order of magnitude as the PIC simulation results at the subsolar point (Poppe & Horányi 2010). However due to the lack of direct measurements of the surface electric field, detailed comparison has to be made in the future.
Throughout this paper, the effects of themagnetic field on the sheath and electric field are not considered. In the solar wind magnetic field of 10 nT, even a low energy lunar photoelectron has a gyroradius of about 300m, which is much larger than the sheath scale length on the dayside. On the nightside, sza = 120° for example, the gyroradius of the solar wind electron is about 1800m, which is also much larger than the sheath scale length of 20m. A charged particle moves almost along a straight line inside the sheath, hence can be taken as unmagnetized. A sheath model omitting the ambient magnetic field should be reasonable at the lunar surface if the lunar crustal fields are weak. However, in the strong lunar crustal field regions, the sheath might be magnetized. Through solar wind interaction with the crustal fields, the incoming plasma is also quite different from the undisturbed solar wind (Xie et al. 2015), and higher surface potential is expected (e.g., Saito et al. 2012). So, our results are not applicable to the strong crustal field regions.
The nightside sheath and electric field are determined by the plasma distribution in the lunar wake, especially by the electron temperature. According to Halekas et al. (2005), the various electron parameters are smoothly varying and nearly perfectly rotationally symmetric about the wake axis, but the electron temperature has a high level of variability in the central wake. In our calculation, the electron temperature in the region quasi-perpendicular to the magnetic field is adopted and smoothed as input. Considering the variability in plasma conditions in the central wake, uncertainty may arise, which should be further studied and confirmed by future observations.
To simplify the calculation, we have set the incoming plasma potential V0 to zero in our work. Actually V0 may drop to −300V in the central wake, and change with the solar wind parameters (Halekas et al. 2005). If V0 has some non-zero value, the 1D sheath potential profile will have zero-offset, and an extra horizontal field will superpose on the present horizontal component according to the gradient in V0, which is almost zero on the dayside, but on the order of ∼0.2 mV m−1 deep in the wake.
Acknowledgements
This work is supported by the Key Research Program of the Chinese Academy of Sciences (Grant No. XDPB11).
Footnotes
- *
A contributed paper from the International Symposium on Lunar and Planetary Science (ISLPS) on 2018 June 12–15 at Macau University of Science and Technology.