Abstract
We reveal the electronic structure in YbCd2Sb2, a thermoelectric material, by angle-resolved photoemission spectroscopy (ARPES) and time-resolved ARPES (trARPES). Specifically, three bulk bands at the vicinity of the Fermi level are evidenced near the Brillouin zone center, consistent with the density functional theory (DFT) calculation. It is interesting that the spin-unpolarized bulk bands respond unexpectedly to right- and left-handed circularly polarized probe. In addition, a hole band of surface states, which is not sensitive to the polarization of the probe beam and is not expected from the DFT calculation, is identified. We find that the non-equilibrium quasiparticle recovery rate is much smaller in the surface states than that of the bulk states. Our results demonstrate that the surface states can be distinguished from the bulk ones from a view of time scale in the nonequilibrium physics.
Export citation and abstract BibTeX RIS
Angle-resolved photoemission spectroscopy (ARPES) is a powerful tool to measure the band structure in condensed matters directly.[1] Combined with pump-probe techniques, the technique of ARPES is extended to time realm, called the time-resolved ARPES (trARPES), with the function of measuring the ultrafast electronic dynamics, and has been widely used in probing the unoccupied states, ultrafast superconducting gap, ultrafast many-body effects, and so on.[1,2] In ARPES experiments, single crystal samples are usually cleaved in ultrahigh vacuum to get clean surfaces to ensure that the photo-emitted electrons bring the information about the electronic states in the bulk. However, due to the broken of the translational periodicity normal to the surface,[3,4] reconstruction of the surface,[5] or topological states,[6] there are usually two-dimensional surface states at the cleaved surface that can be probed by ARPES experiments. The surface states are usually determined by photon-energy-dependent ARPES measurements to track the dispersionless electronic structure perpendicular to the cleaved surface.[7] Such photon energy dependent measurements are usually conducted with synchrotron light source, of which the photon energy can be tuned continuously.
However, it is usually hard to identify the dispersionless surface states on the lab-based ARPES system, for the photon energy is fixed or can only be tuned in a narrow range, such as the laser light source and the noble gas discharge lamp. Since the ultrafast evolution of the non-equilibrium electronic states strongly depends on the many-body effects of electron–electron scattering, electron–phonon coupling, and so on,[8–10] the surface states can be potentially differentiated from the bulk ones by trARPES from the point of view of the decay rate due to the different energy dissipation channels of the photoexcited non-equilibrium electrons.
We applied the above idea on a thermoelectric material, YbCd2Sb2, which is a Zintl phase compound with direct and reversible conversion of heat and electricity.[11–13] It has a hexagonal lattice structure (Fig. 1(a))[14] and a hexagonal reciprocal lattice (Fig. 1(b)), similar to its europium isostructural compound EuCd2As2 which is a Weyl semimetal.[15] So far, there is no experimental and theoretical study of the band structure of YbCd2Sb2; the study of such Yb-, Cd- or Sb-based Zintl isostructural materials is incomplete. The direct measurement of the band structure would be helpful in the theoretical explanation and prediction of its electrical, thermal and optical properties.

Fig. 1. Calculated and experimentally measured band structures of YbCd2Sb2. (a) Schematic of the primary cell of YbCd2Sb2. (b) The first Brillouin zone and the high symmetry points (Γ, A, K, H, M, L). P is a point between Γ and A. 
 . (c) The calculated (solid blue lines) and measured band structures by 21.2 eV photon. (d) The band structure in the vicinity of the Fermi level about Γ, at
  . kx
is along Γ–K. Three bulk bands are marked as 1, 2 and 3, and the data was taken by p-polarized 6.05 eV laser. (e)–(f) The photoemission constant energy contour at the Fermi energy (e) and at E – EF = –0.25 eV (f). The fourth band can be resolved between bands 1 and 2, marked as band #4. Dashed lines are guides to the eyes.
. kx
is along Γ–K. Three bulk bands are marked as 1, 2 and 3, and the data was taken by p-polarized 6.05 eV laser. (e)–(f) The photoemission constant energy contour at the Fermi energy (e) and at E – EF = –0.25 eV (f). The fourth band can be resolved between bands 1 and 2, marked as band #4. Dashed lines are guides to the eyes.
Download figure:
Standard imageIn this paper we present a comprehensive trARPES study of the band structure of YbCd2Sb2, where we determined the band structure of YbCd2Sb2 by ARPES measurement and density functional theory (DFT) calculation.[17,18] We differentiated a band originated at the surface from the bulk energy bands based on the comparison of the ARPES results and the DFT results. Also, we observed a remarkable difference in the decay lifetime of the photoexcited nonequilibrium quasiparticles between the surface and bulk bands, which suggests a new means to distinguish them by ultrafast detection. In addition, circular dichroistic ARPES measurements also present a distinct photoemission response between the surface and bulk states.
In our trARPES experiments,[16] an infrared pump laser pulse with photon energy hν = 1.77 eV, the pulse duration of 30 fs, and a repetition rate of 500 kHz, drives the sample into a non-equilibrium state. The electrons are subsequently photoemitted by an ultraviolet probe laser pulse (6.05 eV) and are captured by a hemispherical analyzer in an ARPES setup. The overall time resolution is 113 fs and the energy resolution is 16.3 meV in the measurements. The regular ARPES measurements were conducted using the helium lamp light source (21.2 eV) and the 6.05 eV laser, and the circular dichroism ARPES measurements were taken with the 6.05 eV laser. The YbCd2Sb2 single crystals were grown by the flux method and cleaved under ultrahigh vacuum condition with a pressure below 3.5 × 10⁻¹¹ Torr. The lattice orientation was determined by the Laue back-diffraction, and the ARPES data were collected along the Γ–K direction. First-principles DFT calculations were performed using the Vienna ab initio simulation package (VASP) code.[19,20] The projector augmented wave (PAW) potentials were used to describe the core electrons. A plane-wave cutoff energy of 380 eV and a k-mesh of 6 × 6 × 3 were used for the atomic coordinates optimization and electron wave-function calculation. The Dudarev approach of the simplified LSDA +U was used to include the on-site Coulomb interaction, in which (U – J) is a tunable parameter.
Figure 1(c) shows the DFT calculated as well as the experimental band structure measured using the helium lamp. The value (U – J) of the Yb-f-orbit in the DFT calculation is set as 4.8 eV to make the two high-density-of-states (DOS) locate at –1.2 eV and –2.5 eV, as indicated by the experimental result. Higher U value means stronger band repulsion that the splitting of the two high-DOS regions is larger, and vice versa. Using the same parameters, we sketch the calculated band structure at  near the Fermi energy in Fig. 1(d) (solid blue lines). We note that the photoemission experiment with probe photon energy of 6.05 eV measures the electronic states at
  . The measured photoemission spectrum in Fig. 1(d) clearly shows three bands, labeled as bands #1, #2 and #3, consistent with the calculation (Figs. 1(c)–1(d)). In addition, an additional energy band (band #4) near the Fermi energy can be resolved in the experimental data shown in Fig. 1(d) (guided by the yellow dashed lines). The above bands can also be identified in the constant energy mappings at the Fermi level (bands #1 and #4, Fig. 1(e)) and at the binding energy –0.25 eV (band #2. Fig. 1(f)). The loss of spectra weight away from the high symmetry momentum is possibly due to the photoemission matrix element effect.
Since there is no additional band feature from the calculation apart from bands #1–3, the band #4 is possibly a surface band no matter what the origin is. Due to different energy dissipation channels between the surface and bulk, with ultrafast photon pump, the recovery time of the non-equilibrium electronic states at the surface is very possibly different from that in the bulk. Figures 2(a)–2(c) show the time-resolved spectra when the pump light is turned on. The delay time Δt equals zero when the pump and the probe pulses overlap in time. Before the arrival of the pump pulse (Fig. 2(a)), the photoemission spectra is just the same as that of the equilibrium result shown in Fig. 1(d). At a delay time of 0.2 ps, the band #4 extends to about 0.2 eV above the Fermi energy. In contrast, the band #1 extends to merely tens of meV due to the thermal effect of hot electrons. The missing of unoccupied states at higher energy in band #1 is possibly due to the relatively short lifetime of the non-equilibrium quasiparticles and cannot be resolved from a time resolution of 113 fs. At the delay time of 2 ps, the bulk band #1 is almost fully recovered to its equilibrium state while the band #4 is slightly weakened near the band top, indicating that the lifetime of the non-equilibrium quasiparticles in the band #4 is much longer than that in the band #1. The integrated photoemission intensities in windows (denoted by the boxes of corresponding colors in Fig. 2(e)) for bands #1 and #4 as a function of the delay time are shown in Fig. 2(d), from which the recovery rate of band #1 (1.75 ps−1) is about 2.5 times faster than that of band #4 (0.7 ps−1), and no significant fluence dependence was found in the fluence range we measured. We note that the energy of the integration window for band #4 is much higher than that of band #1, for no clear unoccupied states in band #1 are resolved at the same energy as that in band #4. However, even at much lower energy, the rate of non-equilibrium qausiparticle recovery of the band #1 is much faster than that of the band #4. This is quite abnormal because high energy states usually decay faster (the decay rate growing with energy in an exponential fashion) due to additional energy transfer channel from electron–electron interaction, indicating that the lifetime of the non-equilibrium quasiparticle of the bulk band (band #1) should be far more than 2.5 times faster than that of the surface states of band #4. Such a slow recovery of excited states in band #4 probably can be attributed to less energy dissipation channels from many-body effects at the surface. This is also consistent with previous reports that the non-equilibrium quasiparticle recovery rate in a surface state is quite long in other material.[21]
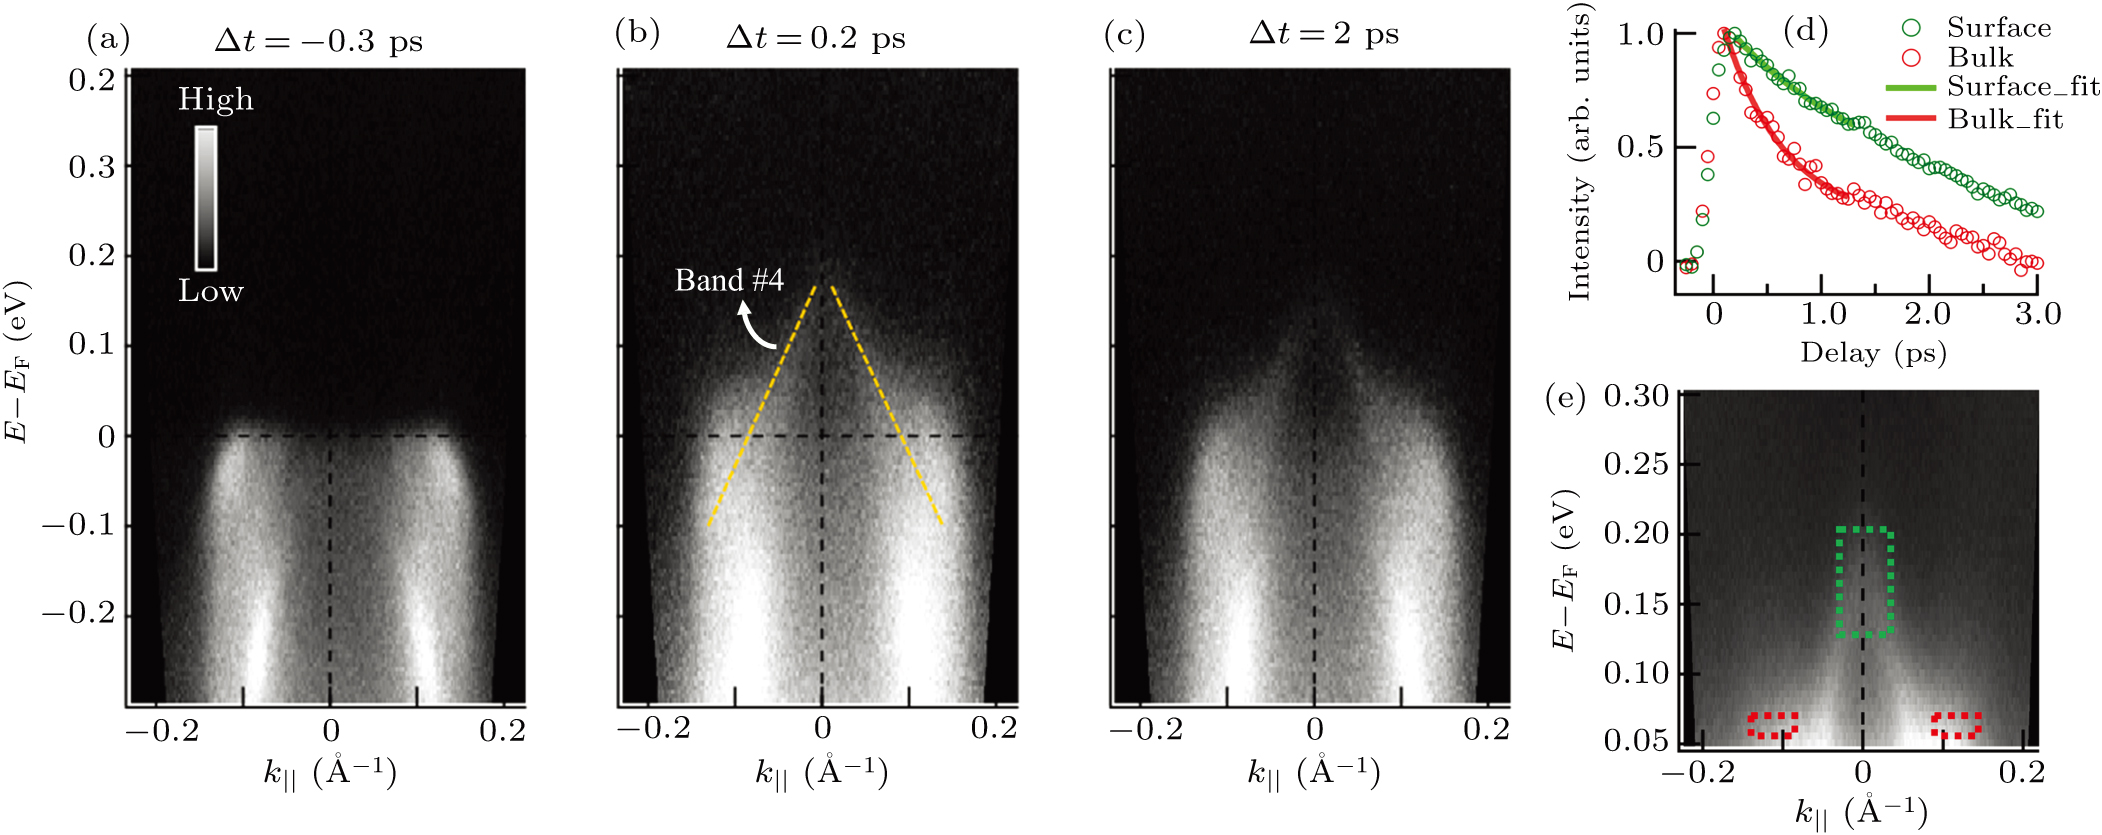
Fig. 2. The trARPES measurement. (a)–(c) The photoemission images before (a) and after (b), (c) the pumping. (d) The intensity of the non-equilibrium quasiparticles in the dashed boxes in (e) (denoted by corresponding color) as a function of delay time. Solid curves are exponential fittings to the experimental data. (e) A zoomed-in measurement of the unoccupied states near the Fermi energy at the decay time δt = 0.2 ps. The pump fluence is 110 μJ/cm2.
Download figure:
Standard imageFrom the band structure calculation, the bulk bands strongly disperse perpendicular to the sample surface (Γ–A, kz ), giving blurred photoemission spectra due to kz momentum resolution, as the bands #1–3 shown in Fig. 1(d). Thus, the well-defined unoccupied band structure of band #4 for an energy resolution of 16.3 meV strongly suggests its 2D behavior from the surface. The standout of the band #4 is due to much slower recovery rate from the surface than that from the bulk. The band #4 cannot be well resolved in the equilibrium data shown in Fig. 1(d) possibly due to much lower density of states from the surface than that from the bulk.
The band #4 is not a nontrivial topological surface band which is spin polarized due to the strong spin–orbit coupling. Circular dichroism ARPES measurement,[22–24] a commonly-used indirect method to check the spin-polarization of electronic states, was conducted on the sample after ultrafast photo-excitation. Figure 3 shows the measured band #4 using left-handed and right-handed circularly polarized probe, respectively. No photoemission intensity asymmetry around the high symmetry point (Γ) is found for both of the two photon chirality, different from the asymmetry surface band in the nontrivial topological insulator Bi2Se3.[22–24] The absence of the circular dichroism indicates that the band #4 is not spin polarized and the measured unoccupied energy band is not a Dirac dispersion with the cone at about 0.2 eV. Instead, the band #4 is more likely a regular hole surface state with band top at about E – EF = 0.2 eV.
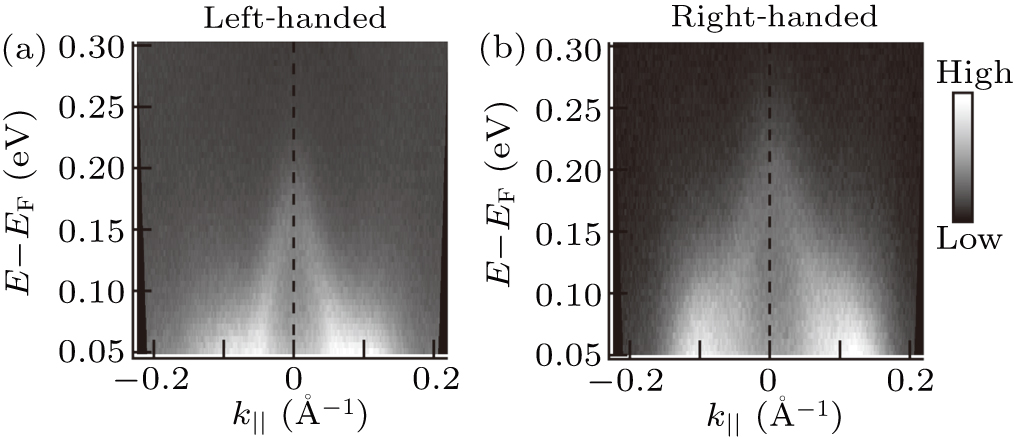
Fig. 3. Time-resolved photoemission images of the band #4 measured by circularly polarized light. (a) The probe light is left-handed. (b) The probe light is right-handed. The pump fluence is 150 μJ/cm2.
Download figure:
Standard imageHowever, the neighboring bulk bands #1 and #2, though not spin-polarized as well, react quite differently from band #4 to circularly polarized light. This interesting anomaly is summarized in Fig. 4. We find that the photoemission intensity reverses for the negative and positive kx when alternating the probe polarization. For example, when probed by left-handed light (Fig. 4(a)), the photoemission intensity in band #2 is stronger in region (kx < 0, ky = 0) and weaker in region (kx > 0, ky = 0), but when probed by right-handed light (Fig. 4(b)), the intensity becomes weaker in region (kx < 0, ky = 0) and stronger in (kx > 0, ky = 0). Circular dichroism results of band #1 show similar intensity reversion behavior. To make it more clear, we show the constant energy mapping at the Fermi level (Figs. 4(c) and 4(d), corresponding to band #1) and at –0.22 eV (Figs. 4(e) and 4(f), corresponding to band #2). In Figs. 4(g) and 4(h) we summarize the photoemission response of these two bands to the polarization of the probe by representing the outer band #1 by the solid-line hexagons and the inner band #2 by the dashed-line hexagons. It is quite complicated and even does not show apparent symmetry in the momentum space.

Fig. 4. The circular dichroism measurement results. The photoemission results at different ky with different photon chirality (left-handed polarized probe for (a) and right-handed for (b)). (c)–(f) Constant energy mappings at different binding energies (0 eV in (c) and (d), –0.22 eV in (e) and (f)) with different photon chirality (left-handed polarized probe for (c) and (e), right-handed for (d) and (f)). (g)–(h), A schematic to show how bands #1 and #2 response to circularly polarized light. Red and green represent higher and lower counts, respectively.
Download figure:
Standard imageThe circular dichroism effect in the photoemission intensity is usually attributed to the spin polarization of the energy band in the topological insulator, Weyl semimetal, and any other material with strong spin–orbit-coupling system. It seems from Fig. 4 that bands #1 and #2 are strongly spin polarized. However, in our DFT calculation, we did not find any spin-polarization in any bulk bands in YbCd2Sb2 even though the spin–orbit coupling was accounted, since the spin–orbit coupling is weak and no magnetic moment was identified in this material so far. We attribute the observed circular dichroism phenomenon to the experimental geometric effects in the photoemission process. The matrix element, related to the geometric factors like the incident angle and the rotational angle,[25] may contribute to the non-zero circular dichroism intensity, although we did not figure out how the matrix element in the photoemisson process gives such a complex circular dichroism pattern as we schematized in Figs. 4(g) and 4(h).
In those circular dichroism ARPES measurements, little attention has been paid to the effect of experimental geometry. Our result is a direct experimental evidence that unpolarized bands can also be selectively excited by circularly polarized probe, raising a question that the existence of the circular dichroism effect does not necessarily suggest the band's spin polarization. Similar abnormal circular dichroism was also identified in a non-spin polarized material,[26] and it possibly can be understood by the effects of experimental geometry[27] or attributed to the importance of assessing structural issues.[28] Further theoretical study is necessary to clarify such abnormal circular dichroism effects in the photoemission process.
The presence of circular dichroism effects in the bulk bands but absent in the surface state band #4 further suggests that the the surface state is not sensitive to the experimental geometry in the photoemission measurement. Thus, the circular dichroism effect is probably still a reasonable method to characterize the spin-polarization in the surface states, as it is widely used in the literature.
In summary, we measured and calculated the band structure of YbCd2Sb2. We found three bulk bands in the vicinity of the Fermi level, consistent with the DFT calculation, and an additional band with surface behavior. We found distinct recovery lifetime of non-equilibrium quasiparticle in the surface states from that in the bulk bands, suggesting a new method to identify the surface state from the bulk rather than measuring the kz dispersion by tuning the probe photon energy. In addition, we found complex circular dichroism effect in YbCd2Sb2 which is not a strong spin–orbit-coupling material, indicating that the circular dichroism effect should be considered carefully and the experimental geometry must be counted in justifying the spin polarized band. We hope our results would stimulate interests from theorists to work in this direction to resolve the problem.
Acknowledgements
W.T.Z. acknowledges support from the National Natural Science Foundation of China (Grant No. 11974243) and additional support from a Shanghai talent program. W.L. acknowledges support from the National Natural Science Foundation of China (Grant No. 11521404). Y.F.G. acknowledges the support by the Natural Science Foundation of Shanghai, China (Grant No. 17ZR1443300).