
Abstract
Graphene oxide (GO) has a wide fluorescence bandwidth, which makes it a prospective candidate for numerous applications. For many of these applications, the fluorescence yield of GO should be further increased. The sp2-hybridized carbons in GO confine the π-electrons. Radiative recombination of electron–hole pairs in such sp2 clusters is the source of fluorescence in this material. Palladium nanoparticles are good catalysts for sp2 bond formations. We report on the preparation of GO, palladium nanoparticles and their nanocomposites in two different solvents. It is shown that palladium nanoparticles can considerably enhance the intrinsic fluorescence of GO in the blue–green part of the visible light spectrum. Fluorescence enhancement has been attributed to the catalytic role of palladium nanoparticles in increasing the number of sp2 bonds of GO with the molecules of the surrounding media. It is shown that palladium nanoparticles could be the nanoparticle of choice for fluorescence enhancement of GO because of their catalytic role in sp2 bond formation.
Export citation and abstract BibTeX RIS
1. Introduction
Great interest in the preparation of graphene-based materials has grown over recent decades, owing to the excellent properties of the graphene sheet. It has been shown that newly discovered, atomically thin sheets of graphene oxide (GO) and reduced graphene oxide (RGO) are dispersible in basic media and have a substantial bandgap, distinct from graphene.[1,2] Graphite has been used for the preparation of GO, which in turn is widely used as a precursor for the synthesis of reduced GO.[3] Due to its unique electronic, thermal, and mechanical properties, GO has been used in different applications such as developing sensors,[4] medical applications,[5,6] ultrafast lasers,[7,8] etc. GO consists of intact graphitic regions interspersed with sp3-hybridized carbons containing carboxyl, hydroxyl, and epoxide functional groups on the edge, top, and bottom surface of each sheet and sp2-hybridized carbons on the aromatic network (Fig. 1).[9] The presence of the abundant oxygen functional groups provides GO sheet with large capability of loading of molecules through covalent or noncovalent approaches, facilitating development of a broad class of novel materials with enhanced properties, and even introducing new functionalities to GO sheet. Owing to these intriguing features, thus far, observation of near-infrared, visible, and ultraviolet fluorescence has been reported for GO.[1,10–14] The presence of other types of localized sp2 clusters are more likely to be responsible for the origin and enhancement of blue fluorescence.[11] The presence of localized finite-sized molecular sp2 clusters within an sp3 matrix can lead to the confinement of π-electrons in GO. Radiative recombination of electron–hole pairs in such sp2 clusters can give rise to fluorescence.[15–17]
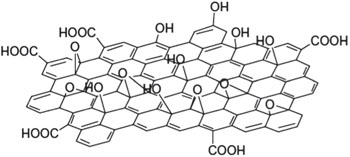
Fig. 1. Structure of graphene oxide.
Download figure:
Standard image High-resolution imageAs widely reported,[18,19] fluorescent intensity of GO is relatively low. It is acknowledged that metal nanoparticles (NPs) can intensify the fluorescence, by a process known as metal-enhanced fluorescence.[20,21] It is well proved that the interactions between fluorophores and metal NPs result in increased photostability, fluorescence enhancement, and a decreased lifetime due to the increased rates of system radiation decay.[22,23] Enhanced fluorescence in these studies is proposed to stem from the mechanism of surface plasmon enhancement[24,25] that modifies the optical properties of local fluorophores. Many studies have reported the fluorescence quenching graphene quantum dots (GQDs) by addition of metal NPs.[26–31] Compared with GO sheets (Fig. 1), GQDs have significantly lower surface-to-volume ratios and hence significantly fewer functional groups exist on their surfaces. However, fluorescence enhancement of GQDs has also been reported by synthesizing GQDs/Ag nanocomposite in the absence of any kind of stabilizer.[32] Enhancing the fluorescence of GO by well-controlled Au@SiO2 core-shell NPs has been reported[33] and it was shown that the distance between GO and metal NPs plays a crucial role in changing the fluorescence intensity. Fluorescence in nanocomposites is a complicated phenomenon and its intensity depends on the fluorophore type, the surrounding media, type of NPs, and the excitation wavelength.[34] Despite the considerable need for enhancing the fluorescence intensity of GO, thus far, only a few systematic studies have been reported to remedy this deficiency of GO by mixing it with NPs. Many more studies are required to investigate the role of various factors in changing the fluorescence intensity of nanocomposites of GO and different types NPs, and to clarify the predominant sources of the fluorescence changes.
Pd is an excellent catalyst for sp2 bond formations. It is known that the Pd-catalyzed Suzuki–Miyaura coupling reaction constitutes a powerful, versatile, and straightforward methodology for sp2 C–C bond formation.[35–37] It has also been shown that Pd NPs can be readily prepared by reduction of Pd2+ precursors[38] and that they serve as catalysts for C–C coupling reactions.[39] Furthermore, based on the catalytic role of Pd NPs for sp2 C–H reactions, a fluorescence turn-on sensor is made for detection of palladium ions.[40] The catalytic role of Pd in stimulating the sp2 C–N bonds is also well-known.[41]
In this work, we report on fluorescence enhancement of GO by addition of Pd NPs in the blue–green region of the visible spectrum. GO was made by a modified Hummer's method.[42,43] Pd NPs were also prepared using a chemical method. Structural and optical properties of GO/Pd nanocomposite in two different kinds of solvents have been investigated. It is shown that an increase in the number of sp2 bonds between GO and molecules of the solvents, stimulated by the presence of Pd NPs, is the main source of fluorescence enhancement.
2. Materials and methods
In the following, we will describe the experimental procedures employed in this work. First, the preparation of Pd NPs and synthesis of GO and GO/Pd nanocomposite will be explained in detail. The preparation of GO/Pd suspensions in the solvents will be described thereafter. At the end, the method used for measuring the fluorescence emission of materials will be explained. High-purity chemical reagents were purchased from the Merck and Aldrich chemical companies. All materials were of commercial reagentgrade.
2.1. Preparation of Pd NPs
In order to prepare the Pd NPs, 4.0 mL PdCl2 (7.72 × 10− 3 mol·L− 1) was first added into 50 mL doubly distilled water. Then, 102.8 mg of PVP (0.93 mmol of monomeric units) was added to the mixture as a stabilizer (n(PVP monomer) = n(PdCl2) = 30:1). The total volume of mixed solution was 75 mL. Subsequently, 17.6 mg NaBH4 was dissolved in 5.0 mL water. Then, NaBH4 solution was slowly added to the mixture under stirring (n(NaBH4) = n(PdCl2) = 15:1) to reduce the metal ions completely. The solution immediately turned from light yellow to brown and much bleb appeared, thus resulting in a transparent colloid. After stirring at room temperature for more than 6 h, the colloid was dialyzed six times against doubly distilled water to remove the rest of the redundant NaBH4 and other ions. The concentration of Pd colloids was 1.38×10− 4 mol·L− 1.
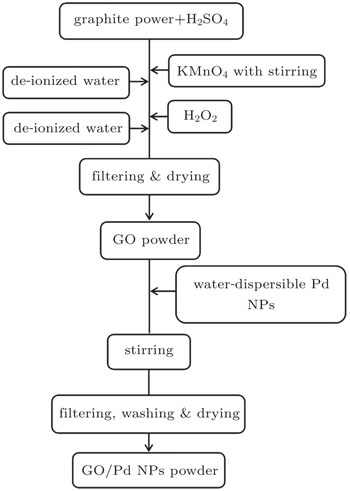
Fig. 2. Flowchart of GO/Pd NPs preparation.
Download figure:
Standard image High-resolution image2.2. Preparation of GO, GO/Pd nanocomposite, and dispersions of GO/Pd
GO was made by a modified Hummer's method.[42,43] Two grams of graphite powder was dissolved in the mixture of concentrated H2SO4 and NaNO3 under stirring. A strong oxidant, KMnO4, was added into the reaction container gradually under stirring in an ice bath for 2 h. The mixture was then kept at room temperature while stirring for another 96 h. Dilute sulfuric acid (5 wt%) and hydrogen peroxide were added to the reaction system. The mixture was then centrifuged and washed with dilute HCl aqueous solution and deionized water, and then dried at room temperature. GO was obtained by drying the precipitate at room temperature. 200 mg of as-made GO powder was dispersed in 800 ml of deionized water. The GO dispersion was treated with ultrasonic (400 W) for approximately 2 h to exfoliate into single layers of GO.
To prepare the GO/Pd nanocomposite, 0.3 mg of GO powder was mixed with 300 mL of Pd NPs colloid. The mixture was under stirring for more than 1 h. After stirring at room temperature, the solution was under reflux for 24 h at a temperature of 60 °C. The final solvent was filtered and was dried in an oven at 50 °C for 24 h. Figure 2 shows the preparation steps of GO-supported Pd NPs via a simple synthetic process. GO/Pd nanocomposites were dispersed in two different solvents: DMF (N,N-Dimethylformamide) and NMP (N-Methyl-2-pyrrolidone) with a concentration of 2 mg/mL. The dispersions in each solvent were prepared by 1 h sonication that was followed by centrifuging at 5000 rpm for 20 min.
2.3. Fluorescence measurements
Figure 3 shows a schematic of our designed optical setup for measuring fluorescence spectra. In this configuration, a CW He–Cd laser (442 nm, 25 mW) is used as the pump radiation for exciting the samples. The pump beam is focused by a 11 cm focal length converging lens into the quartz cuvette (1 × 1 × 3 cm3) containing the sample. The fluorescence emission converges at an angle of 90° relative to the pump radiation direction via a positive lens and enters a Czerny–Turner type monochromator. Collecting the fluorescence emission in the normal direction minimizes the amount of entering scattered light into the monochromator.[44] Furthermore, convergence of the fluorescence emission increases the value of the signal-to-noise ratio. The monochromator consists of a slit, which is placed at the effective focus of a concave mirror to collimate the light toward the grating direction. The holographic grating (1200 l/mm) diffracts the collimated light and another mirror refocuses the dispersed light. Owing to the fact that each color arrives at a separate point on the exit plane, grating rotation causes the band of wavelengths to move relative to the exit slit. Therefore, the desired wavelength exits from the second slit. The photodiode measures the power of the exit wavelength of light and records its value on a computer. The monchromator is kept in a dark room to prevent the influence of stray light on the measured signal. Before performing the experiments, the monochromator was calibrated using the well-known spectral lines of a mercury lamp.

Fig. 3. Schematic of the fluorescence measurement optical setup. L: He-Cd laser; L1, L2, and L3: lenses; S: sample; B: light blocker; F: fluorescence emission; S1 and S2: slits; M1 and M2: concave mirrors; G: grating; P: photodiode; O: oscilloscope; PC: personal computer.
Download figure:
Standard image High-resolution image3. Results
The resulting solution of Pd NPs was characterized by UV–Vis spectroscopy. Figure 4 shows a UV–Vis absorption spectrum of the Pd NPs solution. In this work, all the UV–Vis measurements were performed at room temperature by a Perkin Elmer 550ES from 190 to 700 nm with a resolution of 1 nm. Some indication of the absorption band related to the plasmon resonance can be seen around 257 nm. It is known that the surface plasmon resonance peak of small Pd NPs (typically ∼ 10 nm in size) is located in the UV region, which gives them a black color (see the inset of Fig. 4), and no resonance between 300 and 1500 nm can be seen on their optical absorption spectra.[45] As stated before, the metal-enhanced fluorescence is mostly assumed to stem from the mechanism of surface plasmon enhancement.[24,25] Therefore, it is of critical importance to determine the precise position of the surface plasmon resonance peak of the prepared metal NPs. In order to determine the plasmon resonance peak of the prepared Pd NPs, the Mie theory of scattering for spherical NPs is used.[46,47] According to this theory, the Mie total extinction Qext and scattering efficiency Qsca for a homogeneous sphere can be expressed as an infinite series


where m is the ratio of the complex refractive index of the sphere n to that of the surrounding medium nm, x is the Mie parameter given as 2πnmR/λ, ψn and ξn are the Riccati–Bessel functions, and the prime represents the first derivatives with respect to the argument in parentheses.[48] Numerical computations of the Pd NPs absorption were performed at discrete points in the wavelength range from 190 to 700 nm. For Pd, the real and imaginary parts of the refractive index at different wavelengths were obtained from Ref. [49] and corrected for NP size.[50] At intermediate wavelengths, where no experimental data was available, cubic interpolation of the MATLAB software was used to calculate the complex refractive index. The mean particle size R has been set equal to 11 nm as was measured for Pd NPs in this work. The computed absorption curve of Pd NPs is also shown in Fig. 4. It can be seen that the computed curve mimics the experimental one and a faint plasmon absorption can be discerned around 238 nm. The 19 nm shift in the position of the plasmon peak can be attributed to some misevaluation of the mean particle size in this work or to the slight deviation of the particles' shape from the spherical one. The main conclusion that can be drawn from the Mie theory calculation is that the observable faint absorption peak on the experimental curve around 257 nm is an indication of the plasmonic enhancement of the radiation field in this range. Knowing that the plasmonic enhancement of the fluorescence field by Pd NPs can be anticipated for exciting radiation fields in the vicinity of 257 nm, we have chosen an exciting source (He–Cd laser radiation, 442 nm) in our fluorescence measurement experiments (see Fig. 2). This way it would be possible to avoid the plausible plasmonic fluorescence enhancement of GO by Pd NPs and to concentrate on their catalytic role in stimulating the sp2 bond formations.

Fig. 4. Experimentally measured as well as the theoretically computed absorption spectra of Pd NPs solution. Inset shows a real-color photograph of the prepared Pd NPs solution.
Download figure:
Standard image High-resolution imageThe morphology of samples was studied by scanning electron microscopy (SEM) (Cam scan MV2300) and transmission electron microscopy (TEM) (Leo 912 AB). Figure 5 shows the SEM images of the prepared GO and GO/Pd nanocomposite. Wide sheets of GO can be seen in Fig. 5(a). Figure 5(b) shows the well-separated distribution of Pd NPs between the GO layers.
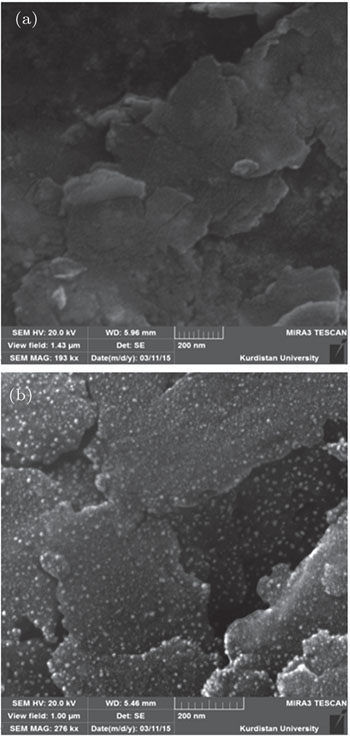
Fig. 5. SEM micrographs of (a) GO and (b) GO/Pd nanocomposite.
Download figure:
Standard image High-resolution image
Fig. 6. TEM micrographs of GO/Pd nanocomposite.
Download figure:
Standard image High-resolution imageFigure 6 shows TEM images of the prepared GO/Pd nanocomposite. The estimated mean particle size of the Pd NPs is approximately 11 nm. The elemental composition of the GO/Pd nanocomposite was measured by EDX performed in SEM. Figure 7 shows the EDX results as well as tabulated atomic and weight ratios. The results clearly confirm the presence of C, O, and Pd elements in the synthesized nanocomposite.

Fig. 7. EDX analysis of GO/Pd nanocomposite.
Download figure:
Standard image High-resolution imageAs shown in Fig. 8, the structural information of the GO and GO/Pd nanocomposite was analyzed by x-ray diffraction (XRD) measurements. XRD measurements were performed with a Philips powder diffractometer type PW 1373 goniometer that was equipped with a graphite monochromator crystal. The x-ray wavelength was 1.5405 Å and the diffraction patterns were recorded in the 2θ range (5°–80°) with a scanning speed of 2 min− 1. The observable peaks at 2θ values of 38.8° (111), 45.8° (200), and 65.8° (220) are consistent with the standard XRD data for Pd (JCPDS 46-1043). The peak at 2θ = 11.1° corresponds to the (001) reflection of GO and the broad and weak peak at 2θ ≈ 22.7° could be attributed to the corrugated structure of the GO sheet.[51]
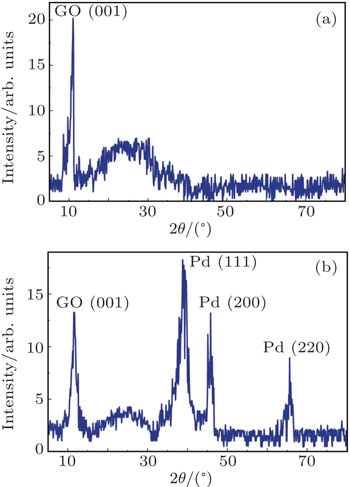
Fig. 8. XRD pattern of (a) GO and (b) GO/Pd nanocomposite.
Download figure:
Standard image High-resolution imageThe GO sheets and GO/Pd nanocomposite were studied by FT-IR spectroscopy (Fig. 9). The results from FT-IR spectroscopy show that the characteristic band of the carboxyl group in GO appears at 3430 cm− 1 (O–H stretching vibration), 1718 cm− 1 (C=O stretching vibration), 1600 cm− 1 (skeletal vibrations from un-oxidized graphitic domains), 1387 cm− 1 (O–H deformations in the C–OH groups), 1231 cm− 1 (C–OH stretching vibration), and 1034 cm− 1 (C–O stretching vibration in C–O–C in epoxide).[52] In the GO/Pd nanocomposites, the peaks at 3428 cm− 1 (O–H stretching vibration), 1630 cm− 1 (C=O stretching vibration), and 1115 cm− 1 (C–O stretching vibration) are clearly discernible. It is well known that some physical/chemical interactions such as the Vander Waals force, H-bonding and other bonds can form the GO/Pd bonds.[53] The most noticeable points in Fig. 9 are disappearance of the C–OH vibration mode (1231 cm− 1) and strength reduction of the O–H deformations in the C–OH groups (1387 cm− 1) in the GO/Pd nanocomposites. As it is well known, significant defects exist in GO, degrading its unique properties such as superior carrier mobility, mechanical strength, and chemical stability.[54] Different methods, like using chemical reducing agents,[55] thermal treatments,[56] laser treatments,[57] metal doping,[58] and tailoring with multi-layered graphene balls[54] are reported for repairing GO by removing hydroxyl and epoxide groups on the graphene sheets. Our FT-IR results also confirm the removal of C–OH bonds in GO sheets by addition of the Pd NPs.
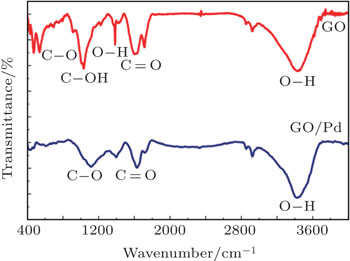
Fig. 9. FT-IR spectra of GO and GO/Pd nanocomposites.
Download figure:
Standard image High-resolution imageRaman spectra of GO and GO/Pd nanocomposite are shown in Fig. 10. Raman spectroscopic analysis is widely used to characterize the crystal structure and to analyze the vibrational motion of carbon materials. The characteristic G and D bands are attributed to the in-plane vibration of sp2-bonded carbon atoms and the vibrations of carbon atoms with the sp3 electronic configuration of disordered graphene, respectively. The G-band at 1592 cm− 1 corresponds to in-plane graphene sheet C–C vibrations of the sp2 carbon atoms, and the D-band at approximately 1350 cm− 1 is related to the presence of defects and disorders in the graphene plane. Enhancement of the G band strength in GO/Pd nanocomposite indicates that sp2 C–C bonds are catalyzed by Pd NPs. GO is known to contain functional groups including carbonyls, epoxides, hydroxyls, etc., which can act as strong anchoring sites for metallic NPs.[54] The anchored Pd NPs remove the C–OH bonds and repair the GO sheets by catalyzing the formation of sp2 C–C bonds. It is already proved that Pd NPs can be good catalysts for sp2 C–C cross-coupling reactions.[59] The intensity ratios of the D and G band (ID/IG) are also calculated. The intensity ratio for the GO/Pd nanocomposites (1.29) is lower than that (1.56) for GO. This result confirms the removal of defects and the restoration of sp2 carbons by the addition of Pd NPs, as the ratio of the D/G bands is directly related to the average size of the sp2 carbon domain.[54]
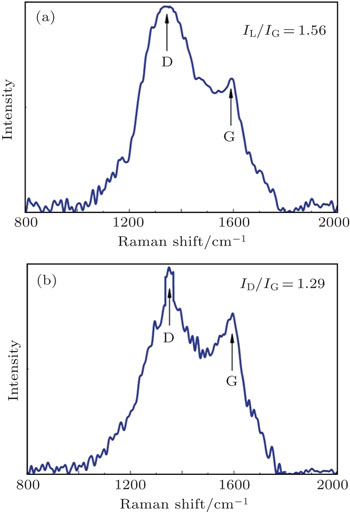
Fig. 10. Raman spectra of (a) GO and (b) GO/Pd nanocomposites.
Download figure:
Standard image High-resolution imageFigure 11 shows the UV–visible absorption spectra of GO and GO/Pd nanocomposites in DMF and NMP solvents. All the samples exhibit uniform absorption within the measured range and no absorption peak can be observed on the spectra. Indeed, strong absorption of GO in the UV region has overwhelmed the faint absorption peak of Pd NPs in Fig. 4.
In Fig. 12 the fluorescence spectra of GO and GO/Pd nanocomposites in DMF and NMP solvents are shown. Dispersion of GO in NMP shows a broad fluorescence emission from the violet to the red part of the visible spectrum. This broad spectrum is the most notable consequence of the heterogeneous atomic and electronic structures of GO.[1] Indeed, near-infrared (NIR), visible, and ultraviolet fluorescence of GO and reduced GO have been reported.[1,10–13,60,61] The tunable fluorescence of GO can open up new and appealing optical applications for graphene-based materials. Figure 12 shows that by changing the surrounding medium from NMP to DMF, the fluorescence intensity increases in the blue part of the spectrum. As already mentioned,[1] the shift in the fluorescence peaks of the suspensions may be attributed to the differences in the dielectric properties of the surrounding media.

Fig. 11. UV–visible absorption spectra of GO and GO/Pd nanocomposites in DMF and NMP solvents.
Download figure:
Standard image High-resolution image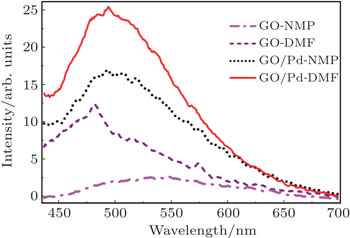
Fig. 12. Fluorescence spectra of GO and GO/Pd nanocomposites in DMF and NMP solvents.
Download figure:
Standard image High-resolution image
The most noteworthy point about Fig. 12 is the great enhancement of the fluorescence radiation in the blue–green part of the spectrum by addition of Pd NPs to the GO dispersions. As already mentioned, Pd NPs are good catalysts for the formation of C–C,[35–37] C–H,[40] and C–N[41] bonds. Therefore, addition of Pd NPs can increase the number of these bonds between the free functional groups of GO (Fig. 1) and the surrounding media. Formation of these bonds increases the number of sp2 hybrids and the fluorescence radiation increases owing to the higher number of π-electrons.[1] As we stated before, metal-enhancement fluorescence is mostly assumed to originate from the plasmonic enhancement of the radiation field.[24,25] Furthermore, in another report, fluorescence enhancement of GQDs is reported by mixing with Ag NPs in the absence of any kind of stabilizer.[32] Fluorescence enhancement in this case is attributed to the stabilizer-free method of preparation and the resulting direct contact between GQDs and Ag NPs. In this work, to be able to concentrate on the catalytic role of Pd NPs in sp2 bond formation and their effect on the fluorescence yield of GO, an exciting radiation wavelength far from the plasmonic absorption band of Pd NPs has been chosen. Furthermore, Pd NPs are synthesized using PVP as a stabilizer.
Another observation that can be made from Fig. 12 is that by addition of Pd NPs to the GO dispersions, the fluorescence peak is blue-shifted in GO/Pd-NMP and slightly red-shifted in GO/Pd-DMF. This feature can also be attributed to the different dielectric natures of the surrounding media.
4. Conclusion
The intrinsic broadband fluorescence of GO in the visible range makes it a prospective candidate for numerous applications. Recently, different biological applications of GO using the versatile optical fluorescence of GO have emerged.[1] A higher fluorescence yield of GO can broaden its applications in various fields such as biosensing and active media with tunable lasing characteristics in the construction of GO-based lasers. In this work, it is shown that, owing to the catalytic role of Pd NPs in the formation of sp2 hybrids, they can be used as NPs of choice to enhance the fluorescence yield of GO in the blue–green range of the visible spectrum. Indeed, GO with its high surface-to-volume ratio and excess of free functional groups can be favorably used in this case. An exciting radiation wavelength far from the plasmonic absorption band of Pd NPs has been used in this study. To further increase the fluorescence yield of GO, one can shift the exciting wavelength toward the plasmonic absorption peak of Pd NPs. Owing to the fact that the plasmonic absorption peak of chemically prepared small-sized Pd NPs is located in the middle-UV part of the electromagnetic spectrum (see Fig. 4) and this is the range that is typically used for exciting fluorophores, the plasmonic enhancement fluorescence property of Pd NPs can effectively be used. For other types of NPs, the Mie theory of scattering[46,47] can assist researchers to predict the position of the plasmonic peak based on the NPs' size and to choose the best method of preparation to achieve the desired size. Furthermore, adopting a stabilizer-free method of preparation of Pd NPs may also further enhance the fluorescence yield of GO.[32]
Fluorescence enhancement of GO by adding metal NPs is a topic that is less covered in literature. Other types of metal NPs with their own plasmonic characteristics can be used in this case. Dispersions of GO in different types of solvents and other excitation wavelengths can also be used in experiments. Such works are in progress and the results will be reported later.