


Abstract
Low-temperature dynamics in layered ensembles of core-double-shell colloidal CdSe/CdS/ZnS quantum dots is studied using different experimental techniques, including photoluminescence and absorption spectroscopy, luminescence microscopy, photon echo, transmission electronic microscopy and Raman scattering. A combination of different techniques clarify the nature and hierarchy of relaxation processes in the quantum dot (QD)-composite under study for a broad range of temperatures and timescales. The parameters of local phonons in QDs was found coincident by luminescence and Raman spectroscopies. Different contributions to optical spectra broadening has been recognized and attributed to certain properties of QDs: quantum size effect, electron-phonon coupling, spectral diffusion and natural excited state lifetime.
Export citation and abstract BibTeX RIS
1. Introduction
Semiconductor nanocrystals (quantum dots, QD) and especially colloidal QD are interesting objects with unique properties [1–3]. Due to their high quantum yield and photostability, the possibility of controlling the luminescence spectrum, and other characteristics, fluorescent QD-emitters are very prospective novel materials for different applications in photonics, material science, biology and medicine [4, 5]. One can use such structures as multiparameter nanosensors, since their physical properties (optical spectra, luminescence kinetics, spin dynamics) are essentially determined by the parameters of the local field and depend on the thermodynamic parameters of the system and external fields (see, e.g. [6–8]). The very relevant applications of semiconductor nanocrystals are sources of nonclassical light and quantum memory cells in quantum optics and computer science [9]. To use quantum dots and materials based on them in modern applied photonics a comprehensive study of their structure and dynamics is required in different scales of times, energies, sizes, temperatures, etc. Internal QD properties must be investigated as well as QDs interaction with each other and local surrounding in the host medium. Such kind of studies can be realized by combined use of different experimental techniques and comparative analysis of results.
The structural characterization of nanostructures like QD is subject to electronic microscopy [10]. The electronic properties and structure of QDs can be studied by probe techniques like atomic-force and scanning tunneling microscopy [11]. Raman spectroscopy, in particular, tip-enhanced one is a way to clarify internal vibrational dynamics of QD, hybridization of internal and host medium phonons, as well as exciton-phonon coupling [12, 13]. Optical methods, including absorption, photo- and electroluminescence spectroscopies and study of the luminescence kinetics allow to study the dynamics of electronic excitations in QD systems. In this way, single QD spectroscopy was especially productive and discover various interesting phenomena like photoluminescence blinking [14–17] spectral diffusion [18, 19] and local field effects [20].
The study of the ultrafast dynamics in QDs and QD-based composites is also of great interest. Namely, understanding of optical dephasing and spin dynamics is critically important for different applications of QD-composites. Such type of study can be performed utilizing time-domain spectroscopy (pump-probe) techniques. The technique that is widely used for such studies is the photon echo (PE) spectroscopy which is getting started in the 1960s [21, 22]. PE has been strongly developed worldwide and one of the main impacts in this history has the scientific group of Professor Vitaly Samartsev in Kazan Physical-Technical Institute of the Russian Academy of Sciences [23–25]. Various PE techniques have proven themselves as unique instruments for the study of ultrafast dynamics in different media. A large number of works were devoted to the using of PE technique to study disordered structures: polymers, glasses, and molecular crystals (see, e.g. [26] and references therein). In recent years, there is considerable interest to study semiconductor quantum dots and their ensembles using PE [27–31]. Finally, dependences of various characteristics of QD-systems (as obtained with the above-mentioned methods) on the temperature, external fields, and other parameters add new knowledge on the nature of processes therein [32, 33].
Here we try to bring together different experimental techniques (photoluminescence and absorption spectroscopy, luminescence microscopy, PE, transmission electron microscopy (TEM), Raman scattering) to study the properties of core-double-shell colloidal quantum dots CdSe/CdS/ZnS in a broad temperature range. By this, we clarify the hierarchy of different relaxation processes in thin layers of these colloidal QDs stacked on a glass substrate and determine different contributions to optical spectra broadening, which has been recognized and attributed to certain properties of QDs: quantum size effect, electron-phonon coupling, spectral diffusion and natural excited state lifetime.
2. Experimental techniques
TEM studies were performed on a JEM-2010 device in Joint Research Center 'Studies of nanostructured, carbon and superhard materials' in Technological Institute for Superhard and Novel Carbon Materials (accelerating voltage of 200 kV; resolution—0.14 nm). The microscope is equipped with an energy-dispersive spectroscopy attachment.
Absorption spectra of the samples were measured using a wide-range dual-beam spectrophotometer Specord M400 (Carl Zeiss Jena). The luminescent properties of the samples were analyzed using a Nikon Diaphot optical microscope combined with a confocal luminescence detection scheme and compact spectrometer (IS RAS, Moscow). Using this equipment we obtained luminescence images of the samples [34].
Luminescence microscopy of the samples with high spatial resolution was performed by a multifunctional fluorescence nanoscope for the investigation of single molecules and quantum dots developed over recent years at the Laboratory of Electronic Spectra of Molecules at the Institute of Spectroscopy RAS (see [35] for the details). It allows measuring optical spectra of single quantum emitters as well as their temporal behavior and luminescence kinetics, in a broad range of temperatures (from cryogenic to ambient).
Time-resolved measurements of the luminescence kinetics also were performed using this setup, equipped by the femto-picosecond laser TeMa-150 (Avesta) operating in the visible and infrared ranges. Avalanche photodiode EGG SPCM-PQ-200 operating in the photon counting mode was used as a detector. The characteristics of the detector: quantum yield in the region of 600 nm–60%, dark time—100 ns, and dark readouts at 20 Hz. For correlated photon counting, a DPC-230 electronic circuit (Becker & Hickl) with a temporal resolution of 160 ps was used.
An incoherent PE (IPE) spectroscopy technique was used for the study of low-temperature ultrafast dynamics [36]. Nowadays this experimental setup is based on a super-luminescence Rhodamine-dye source (operated in the wavelength range 575-600 nm), which is transversally pumped by second-harmonic of a solid-state Nd:YAG pulse laser LS-2131M-10-FF (LOTIS TII, Belarus). Detailed description of the setup was given in [37, 38]. The optical scheme of the spectrometer consisted of two optical delay lines, forming two laser pulses delayed to each other. The delay between pulses is regulated by changing the optical length in the first channel and it can be adjusted in the range of 5.6 fs–4 ns with a step multiple of 5.6 fs. PE signals were detected by a high-speed CCD camera (Cooke Corporation SensiCam HighSpeed).
To make cryogenic measurements, the samples were placed into optical helium cryostat (RTI, Chernogolovka). Temperature was measured and controlled using a Lakeshore Cryotronics DRC-91CA temperature controller with a precision of 0.1 K.
Low-frequency Raman spectra of the sample were measured at the right scattering angle using a triple-grating TriVista 777 spectrometer and a 532 nm solid-state laser (Millenia, Spectra Physics) in the Institute of Automation and Electrometry SB RAS. Spurious background of the laser was suppressed by a monochromator [39]. The power of the laser beam focused on the sample by a lens with 60 mm focal length was 40 mW. Anti-Stokes spectra for the Raman shift from −230 to −6 cm−1 were recorded. More details about the low-frequency Raman experiment can be found in [40].
3. Sample preparation and general characterization
Let us note that the synthesis of quantum dots and fabrication of nanocomposites based on them is a particularly important task, which can be solved using different approaches, including colloidal synthesis, self-assembly, and electrical gating. There are some specific techniques to product QD-based nanocomposites with controllable luminescence properties, e.g. the growth of semiconductor nanocrystals directly in a liquid crystal matrix [41]. Colloidal synthesis seems to be a suitable technique for many purposes (see, e.g. [42]). In this work, we studied core-double-shell CdSe/CdS/ZnS QDs coated by Si-organic ligands for better solubility in neutral solvents (toluene) produced by the QDLight (Russia) using colloidal synthesis.
While colloidal synthesis leads to the size distribution of particles, firstly we characterize the sizes and structure of QDs by TEM-technique. The QD solution was deposited on a Cu grid coated with carbon film. Further, the samples were put into the vacuum oven to escape the solvent and after that were studied using a JEM-2010 electron microscope.
Examples of the obtained TEM-pictures are shown in figures 1(a)–(c). Analyzing such images one can qualitatively characterize even the packing of atoms in quantum dots. We found that the order of atomic rows and columns is not disturbed by the presence of dislocations in the vast majority of objects that make it possible to carry out such an assessment. This fact indicates a high quality of quantum dots and the presence of a small number of defects in the crystal structure at the interface. An analysis of the values of atomic rows and columns, as well as interplanar distances, allows us to conclude that the QDs are spherical. Further, a histogram of the QD size distribution was constructed (see figure 1(d)), which shows that the size (diameter) of most QDs is distributed in the range from 3 to 7 nm. The average diameter of QD davr = 4.5 nm with dispersion σ = 1.3 nm. However, among the studied QDs, we found particles whose size is outside the specified range. Both smaller QDs and nanocrystals up to 10 nm in size are present. The presence of a large dispersion of QD sizes is the reason for a strong inhomogeneous broadening of the spectra of nanocomposites.
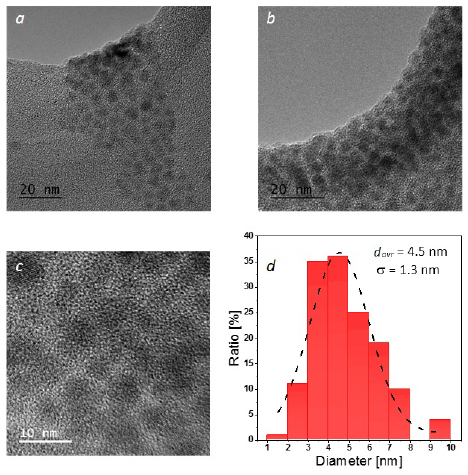
Figure 1. TEM images (a)–(c) and size distribution (d) of CdSe/CdS/ZnS quantum dots.
Download figure:
Standard image High-resolution imageTo prepare structurally homogeneous samples in the form of thin films of QD an original blade-coating technique was developed [43]. The obtained samples were characterized by classical spectroscopic techniques—the absorption and photoluminescence spectra have been measured at room temperature (see figure 2). An exciton absorption band at a wavelength of 577 nm is observed in the absorption spectrum. The luminescence spectrum of the sample (excited by cw-laser at 532 nm) is symmetrical band with a width of about 25 nm with a maximum at a wavelength of 610 nm. It should be noted that the position of the maximum of the luminescence spectrum of the QD ensemble strongly depends on their concentration in the sample [44] and on the surrounding matrix. Also in figure 2, we show the luminescence spectrum, calculated using the size distribution of our QDs (figure 1(d)) and the known dependence of the QD luminescence spectra maxima on QD sizes [45].

Figure 2. Absorption (blue triangles) and luminescence (green squares) spectra of the layered CdSe/CdS/ZnS QDs. Luminescence spectrum (orange circles) calculated using data on the size distribution of our QDs and the known dependence of the QD luminescence spectra maxima on QD sizes.
Download figure:
Standard image High-resolution imageTo clarify the quality of the samples we studied them using luminescence microscopy technique [34]. It was found that the samples represent several homogeneous layers deposited on the surface of the glass plate where QDs are uniformly distributed, and their concentration varies significantly only at the edges of the sample and near cracks.
Figure 3 shows a luminescence image of the sample (a), the profile of the luminescence signal intensity along the selected direction on the sample (c) marked with a red rectangle in (a). Figure 3(b) shows a luminescence image of a sample obtained using an epi-luminescent microscope with high spatial resolution. The data obtained indicate the homogeneity and high optical quality of the samples.
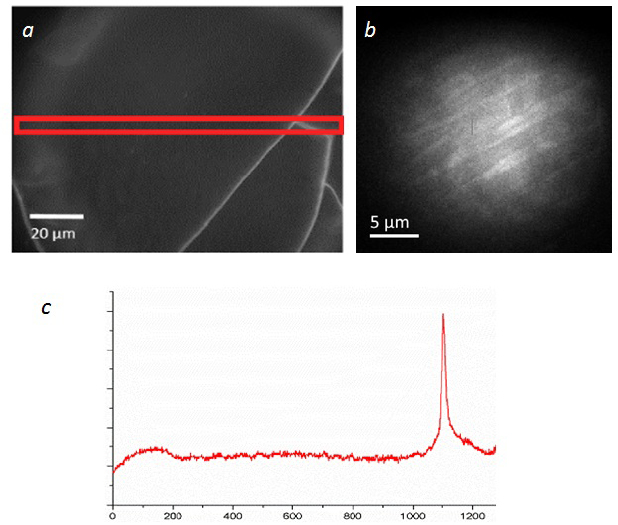
Figure 3. Luminescence images (a) and (b) and intensity profile of the luminescence signal along the selected direction on the sample marked with a red rectangle (c).
Download figure:
Standard image High-resolution image4. Results and discussion
4.1. Temperature dependent photoluminescence spectroscopy
The exciton luminescence spectra of the samples were measured at different temperatures in the range from 4.5 to 300 K, and the temperature dependences of the spectra maximum, i.e. of the exciton energy, and the spectral width were plotted (figure 4).
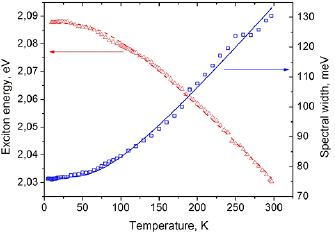
Figure 4. Temperature dependences of the exciton energy (red triangles) and the luminescence spectrum width (blue squares) measured in QD ensemble.
Download figure:
Standard image High-resolution imageThe temperature dependence of the exciton energy was approximated by the formula [46–48]:
obtaining the following parameters: Eg(0) = 2.09 ± 0.02 eV, the Huang–Rhys factor S = 1.67 ± 0.02 and the average energy of local optical (LO) phonons associated with relaxation of electronic excitation ELO = 21.4 ± 0.5 meV.
The dependence of the luminescence spectrum width following [49] and taking into account only the exciton–LO phonon coupling were described as:
where the inhomogeneous broadening  = 76.5 ± 0.2 meV, the strength of exciton–LO phonon coupling
  = 74.0 ± 0.7 meV, ELO = 21.4 ± 0.5 meV.
4.2. Raman spectroscopy
While in the previous section we have obtain indirect information about localized phonon states in QDs, it would be important to find a way for direct measurement of density of vibrational states in the sample under study. Such a possibility is presented by Raman spectroscopy. On figure 5 the Raman spectrum measured in thin films of QD at T = 300 K is shown.

Figure 5. Raman spectrum (after the subtraction of the background) measured in thin films of QD at T = 300 K.
Download figure:
Standard image High-resolution imageA narrow band at 206 cm−1 (25 meV) was attributed to LO-phonon. The value of 25 meV is very close to ELO = 21.4 ± 0.5 meV obtained from photoluminescence measurements.
4.3. Incoherent PE
In experiments on IPE over a wide range of cryogenic temperatures from 4.5 to 50 K the decay curves were measured in thin films of CdSe/CdS/ZnS QDs and the optical dephasing times were determined using the standard procedure [29]. Examples of the measured curves are presented in figure 6. The typical 2-pulse IPE (2IPE) decay curve in the case of organic dye molecules embedded in a solid matrix consists of sharp intensive peak in the region of zeros delays, which correspond to the phonon sideband in electronic-vibrational spectrum of dye-molecules, and extended tail, which correspond to the zero-phonon line of dyes. For estimation of the optical dephasing time T2 we used simple expression  where I0, C and T2 are the fitting parameters. The obtained T2 times were found in the range of picoseconds. It should be noted that in such case the ultrafast decay curves are do not described only by one parameter T2. It should be noted that the correct description of such ultrafast decay curves in general requires using a more complicated dynamical theory of optical transients [50].
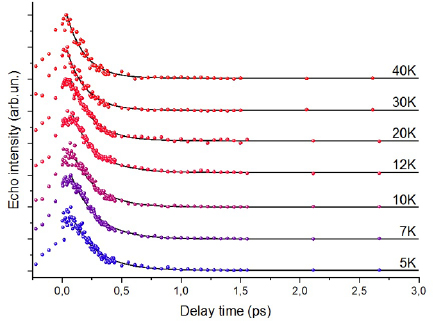
Figure 6. Incoherent PE decay curves measured in the ensemble of CdSe/CdS/ZnS QD at different temperatures.
Download figure:
Standard image High-resolution image4.4. Study of luminescence kinetics
To study the luminescence kinetics a small amount of QD solution was deposited on a glass plate and the decay curve of the fluorescence signal intensity was measured (see figure 7). Analysis of the decay curve revealed the presence of two characteristic times, probably due to the processes of radiative and nonradiative relaxation.
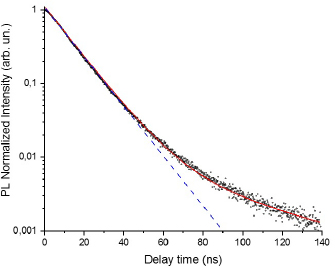
Figure 7. Luminescence kinetics measured in the ensemble of CdSe/CdS/ZnS QD at room temperature. Blue curve—one exponential, red curve—two exponential decay.
Download figure:
Standard image High-resolution imageTo determine the rates of such processes, the decay curve was described using the biexponential function  , where
  and
and  —are the characteristic relaxation times, A1 and A2—are the corresponding amplitudes. Following [51] we determined to the average lifetime of the excited state as
  , where
 ![${{w}_{1(2)}}=\left[ {{A}_{1(2)}}/\left( {{A}_{1}}+{{A}_{2}} \right) \right]\times 100\%$](https://content.cld.iop.org/journals/1555-6611/29/12/124009/revision1/lpab4bdbieqn008.gif) —are the amplitude weights. This amplitude-weighted average lifetime T1 = 13 ns takes into account radiative and nonradiative processes. So, the natural width
—are the amplitude weights. This amplitude-weighted average lifetime T1 = 13 ns takes into account radiative and nonradiative processes. So, the natural width  can be determined to be equal to 12 MHz.
4.5. Hierarchy of relaxation processes
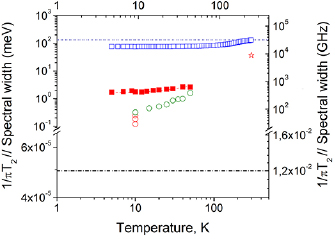
Let us discuss the hierarchy of relaxation processes in the QD composite under study, which determined the temperature dependences of luminescence spectrum linewidth and inverse optical dephasing time (see figure 8).
Figure 8. Temperature dependence of the inverse optical dephasing time (red squares) and the luminescence spectra width (blue squares) measured in the ensemble of CdSe/CdS/ZnS QDs. Green and red circles represent data on photoluminescence spectral linewidths of the single CdSe QDs [52, 53].
Download figure:
Standard image High-resolution image
The lowest dash-dotted line in figure 8 shows the natural width  , determined by the study of the luminescence kinetics in our samples. As we see it is a minimal possible value of the spectral width for the ensemble of QDs. Note however that this values for single QDs can be strongly distributed and correct measurements require considering non-radiative processes.
The data about the homogeneous spectral linewidth for single CdSe QDs at different temperatures are shown by red circles [52], green circles [53] and asterisk (our measurement). We see strong additional broadening in comparison with natural linewidth which is also increased with temperature. This broadening is usually attributed to electron-phonon coupling and spectral diffusion processes.
The temperature dependence of the inverse optical dephasing time measured by IPE-technique is shown by red solid squares. In the temperature range from a few to dozens of Kelvins there is a marked broadening in comparison with a single QD spectral width. It can be due to the inhomogeneous process related to the broadband excitation in our IPE measurements (~100 cm−1), thus sub-ensemble of QDs with different sizes contribute to the IPE-decay curves. Another contribution can be caused by spectral diffusion and/or blinking processes.
The temperature dependence of the inhomogeneously broadened luminescence spectra of bulk QD composite is shown in figure 8 by open blue squares and can be described in the frame of theoretical model of Odonnel and Chen taking into account electron-phonon coupling.
Finally, the blue dashed line at the top corresponds to the width of the luminescence spectrum of bulk QD composite measured at T = 300 K. This value characterizes the maximum possible width of the inhomogeneously broadened (due to QD size distribution) spectrum of the studied QD ensemble.
5. Conclusion
In this paper we present the results of the study of photo-physical properties of colloidal core-double-shell quantum dots CdSe/CdS/ZnS in a wide range below ambient temperature by combination of different experimental techniques (TEM, photoluminescence and absorption spectroscopy, time-resolved luminescence kinetics and photon-echo spectroscopy, Raman spectroscopy).
By TEM the normal distribution of QD sizes was found with mean diameter value 4.5 nm and dispersion 1.3 nm. This broad distribution has been shown as a reason for the large inhomogeneous broadening of the luminescence spectrum of ensemble of QDs stacked in thin film by blade coating technique.
With photoluminescence technique the temperature dependences of spectra positions (exciton energy) and linewidths were measured in the temperature range of 10–300 K. Analysis of these dependencies in the frame of theoretical model of Odonnel and Chen gave the main parameters of electron–phonon coupling in these QDs: value of exciton energy at zero-temperature limit Eg(0) = 2.09 eV; Huang–Rhys factor S = 1.67 and average value of local (confined) optical phonon energy ELO = 21.4 meV.
The average value of local optical phonon energy ELO in the QD sample under study was also obtained by Raman spectroscopy at room temperature as high as 25 meV (206 cm−1), that is almost the same as obtained from photoluminescence study.
Additional information about relaxation processes in QDs has been obtained by incoherent PE in the form of the temperature dependence of the inverse optical dephasing time. These temperature dependences were compared between each over as well as with the data on homogeneous spectra linewidth measured at different temperatures for single CdSe QDs. The fluorescence lifetime for bulk QD composite has been found as high as 13 ns from kinetics measurements. The analysis of all the data clarify the role of electron-phonon coupling and inhomogeneous broadening due to a broad QD size distribution.
Thus we show the great potential of combined studies of semiconductor quantum dots by a set of experimental techniques (TEM, photoluminescence, Raman, PE).
Acknowledgments
This work was supported by the Russian Foundation for Basic Research (project # 18-02-01121—study of the dynamical processes in nanocomposites doped with QDs), the Russian Science Foundation (project # 17-72-20266—measurements of the luminescence kinetics in single QDs and their ensembles). Development of the experimental technique of the PE is the subject of the major project of fundamental scientific research in priority areas determined by the Presidium of the Russian Academy of Sciences № 5 «Photonic technologies in probing inhomogeneous media and biological objects» and State Assignment of the Institute for Spectroscopy RAS.