

Abstract
We present five-year monitoring results of 225 GHz zenith opacity using a tipping radiometer at Thule Air Base (Pituffik), Greenland, where the Greenland Telescope is currently located. The site shows a clear seasonal variation with average opacity lower by a factor of two during winter compared with summer, similar to Greenland Summit. The 25%, 50%, and 75% quartiles of the 225 GHz opacity during the winter months of November through April are 0.14, 0.17, and 0.22, respectively. These values are three times larger than those at the Greenland Summit, and the astronomical observing efficiency in this band is about an order of magnitude better at the Summit than at the Thule Air Base. 225 GHz opacity continuously less than 0.2 for 100–200 hr (i.e., for about a week) occurs about 20 times per year, and on several occasions it even reaches up to 300–400 hr (i.e., about two weeks). These statistics indicate that Thule is a very good site for millimeter astronomy that needs very stable opacity conditions, such as continuum camera observations or VLBI observations that span over several days. Estimated transmission spectra in the winter season show that most of the time (75% quartile) observations at frequencies below 300 GHz are possible with modest atmospheric attenuation (opacities < 0.5), and at frequencies below 350 GHz for a quarter of the time. Although the atmospheric transmission is low (only up to ∼20%), the 650 GHz and 850 GHz windows are also accessible for 5% of the wintertime. For about 50% of the summertime, it is possible to observe around the frequency of 220 GHz, which overlaps with the current EHT observation frequency of 221.1 GHz, with modest atmospheric attenuation (opacities < 0.5). On the other hand, the 350 GHz window is very difficult to observe in the summertime.
Export citation and abstract BibTeX RIS
1. Introduction
The Greenland Telescope (GLT) project (Inoue et al. 2014) is used to study black holes and their immediate vicinity by imaging the shadow of black holes using the millimeter-/submillimeter-wave Very Long Baseline Interferometry (mm/submm VLBI) technique together with mm/submm telescopes located worldwide or mm/submm VLBI networks, such as the Event Horizon Telescope (EHT; Event Horizon Telescope Collaboration et al. 2019a, 2019b) or the Global Millimeter VLBI Array (GMVA). In 2011, the US National Science Foundation (NSF) awarded a 12 m Atacama Large Millimeter/submillimeter Array (ALMA) North America prototype antenna (Mangum et al. 2006) to a group led by the Academia Sinica, Institute of Astronomy and Astrophysics (ASIAA) and the Smithsonian Astrophysical Observatory (SAO). Following a physical inspection and performance evaluation at the original telescope site (the Very Large Array site in New Mexico, U.S.A.; Raffin et al. 2014), the telescope was retrofitted for operation in the extreme cold environment of the Summit of the Greenland ice sheet (Raffin et al. 2016). The reasons for selecting Greenland as the telescope site are described by Matsushita et al. (2017).
To evaluate the modified telescope in an arctic environment before deployment to the Summit, and to gain experience with new telescope systems and receivers, we elected to assemble, commission, and carry out observations with the telescope at an intermediate site affording simpler access and existing support infrastructure. This site is on Thule Air Base (Pituffik), located on the northwest coast of Greenland at 76 32 N latitude and 6842 W longitude. Temperatures are low, between −20 °C and −40 °C in winter and +10 °C and −20 °C in summer, so that despite the sea level altitude we expect winter-time opacity to reach low enough levels to support testing and observations at up to 350 GHz. Because Thule hosts a deep water port and serves as the starting point or transport of equipment and supplies to the Summit by overland traverse, this site was a natural choice for this intermediate deployment.
The major telescope components were shipped to Thule in 2016. The telescope was reassembled (Chen et al. 2018), electronics (Kubo et al. 2018) and receivers (Han et al. 2018) installed, networks and computers set up (Nishioka et al. 2018; Huang et al. 2020), and commissioning and actual mm/submm VLBI observations have commenced and are currently ongoing (Matsushita et al. 2018; Koay et al. 2020). To support telescope operations and obtain a long-term in situ measurement of the site conditions, our 225 GHz tipping radiometer, which had been measuring the 225 GHz opacity for 3.5 years at the Summit (Matsushita et al. 2017), was redeployed to Thule. The radiometer has been monitoring the 225 GHz sky opacity during this whole period.
2. Measurement and Data Reduction
Our 225 GHz tipping radiometer, RPG-225 Radiometer, was procured from Radiometer Physics GmbH (RPG). Details of the specifications and performance of this radiometer are explained in Matsushita et al. (2017). Here, we briefly summarize the specifications of the radiometer: It has an uncooled double-sideband heterodyne receiver with a bandwidth of 1 GHz. A tipping paraboloid mirror has a half-power beamwidth of 05, and it can rotate 360°. A plastazote LD24 (low-density polyethylene foam) window covers ±90° from the zenith, and a blackbody target, whose temperature is monitored by two thermometers, is located at the bottom. A 1800 W heater and blower are located adjacent to the window and provide a dry air flow to prevent ice formation and accumulation on the window.
The radiometer was moved to Thule Air Base in 2016 March from the Greenland Summit, where it had been operated for the previous 3.5 years, after repair and servicing at RPG. It was installed at the central open field of the runway area (Figure 1), at a location approved by the Thule Air Base command. For the tipping measurements described below, the radiometer was oriented to scan in the north–south direction. After setup and initial calibration with a liquid nitrogen-cooled blackbody load, measurements started on 2016 April 8th. Calibration stability was maintained by an internal ambient temperature blackbody target combined with tip calibrations, and recalibration with liquid nitrogen was performed every year. Note that the radiometer orientation and the calibration methods/frequencies are all the same as what we have done at the Summit not to introduce any bias between these two data. Measurements are ongoing. In this paper, we present five-year 225 GHz opacity data at Thule, for the period up to 2021 March. Note that we lack monthly data for 2018 July and 2020 February due to instrument downtime.

Figure 1. The 225 GHz tipping radiometer located at the central open field of the Thule Air Base runway.
Download figure:
Standard image High-resolution imageThe opacity measurement method is the same as that adopted at the Summit (Matsushita et al. 2017); the radiometer rotates the tipping mirror toward five different elevation angles from the horizon (90°, 42°, 30°, 24°, and 192, corresponding to respective airmass  of 1.0, 1.5, 2.0, 2.5, and 3.0) for both the northern and southern sky, and integrates for 4 seconds at each elevation angle. Gain calibration, by observing the blackbody target, is done both before and after each tipping scan. The total duration for a tipping measurement, including the angle scanning and the gain calibration, is 75 s, and each tipping measurement is performed every 10 minutes. While not performing the tipping measurements, the mirror is pointed toward the zenith (i.e., 90°) and the sky brightness temperature is recorded continuously with 1 s integration time. These zenith sky data are converted into 225 GHz opacity using the calibration data and a retrieval algorithm, and fed into the real-time opacity monitoring data supporting telescope operations. In this paper, we use only the more accurate opacity data derived from the tip scans.
The tipping data were analyzed with the typical data reduction method for tipping measurements (e.g., Matsuo et al. 1998). However, compared with the Summit, the opacity conditions at Thule are much worse, especially in the summertime, and the opacity at lower elevations is often optically thick due to larger airmass than that at higher elevations. This induces a non-linear relation between the output voltage from the radiometer and the airmass, and derives wrong opacity values, if we use the typical data reduction method since it assumes optically thin conditions at all the airmass (i.e., linear relation between the output voltage and the airmass). We, therefore, used only the airmass of 1.0, 1.5, and 2.0 for deriving the opacity at Thule with the linear fitting. This limiting of the airmass has also been used in higher frequency data (i.e., higher opacity data) and successfully derived the opacity information (Matsuo et al. 1998; Matsushita et al. 1999).
The tipping mirror position error varies with time due to mechanical drift and wind-driven movement of the radiometer itself. We assume that the opacity is the same between the southern and northern skies, and the small difference in opacities derived from the southern and northern sky tippings is considered the result of the mirror mispositioning. Based on this assumption, we calculate the mirror angle error, and use it to correct the mirror angle when deriving the opacity. In case the difference in opacity between the southern and northern skies is large (i.e., when the mirror mispositioning angle has been calculated as >2°), we judge that this is due to a real opacity difference, and we flag out the data. Note that in case the weather is bad, the radiometer output from each airmass gets very random due to thick clouds and so on, so the linear fitting results and therefore the opacity values easily differ between northern and southern directions. Such bad weather data will then also be flagged out under this assumption.
3. Results and Discussion
3.1. Time and Seasonal Variation
Figure 2 displays the measured time variation of the 225 GHz opacity for the five-year period at the Thule Air Base, Greenland. Similar to the Greenland Summit (Matsushita et al. 2017), there is a clear seasonal variation; low opacity in winter, and high in summer. Figure 3 shows the monthly quartile variations (solid, dashed, and dotted lines are 25%, 50%, and 75% quartiles, respectively). February and March tend to have the best opacity conditions, and July and August tend to have the worst. In addition, opacity tends to be low up to April, and clearly worsens from May. On the other hand, opacity tends to be low from October or November. Based on this trend, the observing season for mm-/submm-wave astronomical observations can be defined as October through April at the Thule Air Base. In both plots, there is no significant year-to-year difference (see Section 4 for more detailed atmospheric transmission spectra in winter and summer seasons).

Figure 2. Five-year time variation plot of 225 GHz opacity at Thule, Greenland. Measurements commenced 2016 April 8, defined as day 1 in this plot.
Download figure:
Standard image High-resolution image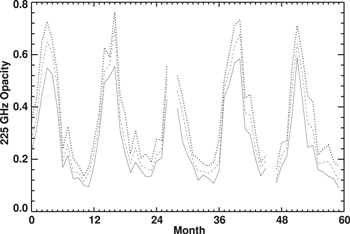
Figure 3. Monthly quartile variation of 225 GHz opacity. Solid, dashed, and dotted lines are 25%, 50%, and 75% quartiles, respectively. The 0th month is 2016 April. Note that there is no data for 2018 July and 2020 February due to instrument downtime.
Download figure:
Standard image High-resolution image3.2. Cumulative Distribution and Histogram
In Figure 4, we present cumulative distribution plots and histograms of measured 225 GHz opacity, separating the seasons into winter and summer. Here, we define winter as between the beginning of November and the end of April (solid line plots), and summer as May through October (dashed line plots), which is the same definition that we used for the Summit data in Matsushita et al. (2017). The 225 GHz opacity quartiles for each season are 0.14, 0.17, and 0.22 for 25%, 50%, and 75%, respectively, in winter, and 0.26, 0.37, and 0.52 in summer (see also the crosses and values in Figure 4). The results show that the opacity in winter is about half of that in summer for all quartiles. The cumulative plot shows that the 225 GHz opacity of 0.15–0.16 is the most frequent in winter. However, there is no obvious peak in summer; 225 GHz opacity of around 0.2–0.3 is rather frequent, but almost constant above 0.2.
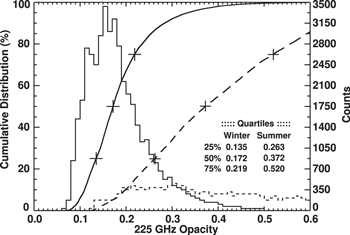
Figure 4. Cumulative distribution plots and histograms of 225 GHz opacity in winter (solid lines) and summer (dashed lines). The vertical axis on the left-hand side is for the cumulative distribution plots, and that on the right-hand side is for the histograms. Crosses on the cumulative distribution curves indicate the opacity quartiles for each season. The quartile values for both the winter and summer seasons are also displayed in the figure.
Download figure:
Standard image High-resolution imageThe quartiles for each season at the Greenland Summit are 0.046, 0.060, and 0.080 for 25%, 50%, and 75%, respectively, in winter, and 0.089, 0.118, and 0.159 in summer. The corresponding values at Thule are 3.0 ± 0.2 times larger than those at the Summit. For our low-noise receivers, the resulting top-of-atmosphere system temperatures are roughly 2–3 times higher at Thule than at the Summit. Consequently, integration times to achieve a given sensitivity can be an order of magnitude higher at Thule, especially for low-elevation sources.
3.3. Diurnal Variation
Figure 5 shows the diurnal opacity variations in winter (top figure) and summer (bottom figure) at the Thule Air Base. Solid, dashed, and dotted lines are 25%, 50%, and 75% of the hourly quartiles. It is obvious that there is no diurnal variation in both seasons, which are again very similar to the Greenland Summit (Matsushita et al. 2017). No diurnal variation at both sites can be easily explained by the polar conditions; only nighttime in winter and daytime in summer. It is also clear that the opacity in winter is more stable, and about half of that in summer, as pointed out in the cumulative distribution plots above (Section 3.2).
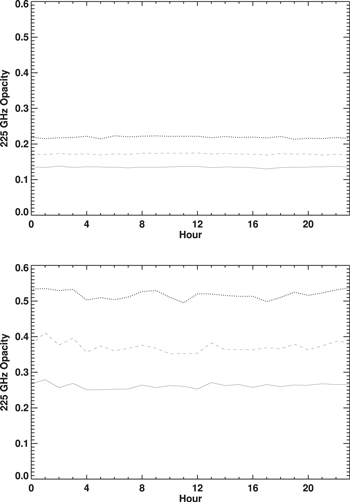
Figure 5. Diurnal plots of 225 GHz opacity in winter (top) and in summer (bottom) at Thule. Solid, dashed, and dotted lines are 25%, 50%, and 75% of the hourly quartiles.
Download figure:
Standard image High-resolution image3.4. Duration of Opacity Lower than Certain Values
We then calculated the time durations of opacity conditions continuously lower than 0.20, 0.15, and 0.10, which are slightly better than the opacity quartiles of the winter season in Thule. The resultant histograms are shown in Figure 6. Since the tipping measurements have been done every 10 minutes (see Section 2), the lower limit of the measurements is 0.17 hr. The counts (vertical axis) are normalized with the number of annual data points.
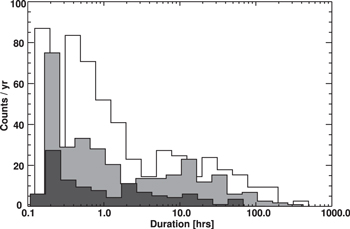
Figure 6. Histogram of time duration for the 225 GHz opacity continuously lower than 0.20 (white), 0.15 (gray), and 0.10 (black). The vertical axis is counts per year.
Download figure:
Standard image High-resolution imageBased on the resultant histogram, we can have about 20 times per year during which 225 GHz opacity remains continuously lower than 0.2 for 100–200 hr (i.e., about a week), and several occasions that reach up to 300–400 hr (i.e., about two weeks). Shorter periods of order of magnitude 10 hr (i.e., a day to a few days) occur several tens of times per year, namely 225 GHz opacity continuously lower than 0.2 for a few days happens for more than half of the winter time. Occasions for 225 GHz opacity continuously lower than 0.15 are fewer compared to 0.20, but still we can have several occasions in a year with more than 100 hr of stable opacity lower than 0.15. An order of magnitude of 10 hr can happen several tens of times per year, again less likely than 0.20, but still reasonably frequent. There was no occasion for over 100 hr of the 225 GHz opacity continuously lower than 0.10, but several occasions for several tens of hours.
With such long intervals of continuous low opacity conditions, we can conclude that the Thule site is a very good site for mm astronomy that needs very stable opacity conditions, such as millimeter continuum camera observations and also VLBI observations that are often scheduled over several days with daily go/no-go decisions depending on weather conditions at all participating VLBI sites. This also means that the Thule site also provides continuous access to a large part of the northern sky with very stable opacity conditions. As at the Summit, this is obviously due to the polar conditions (no diurnal variation) as mentioned above (Section 3.3), and it is very difficult to achieve similar values at other millimeter sites that are not in polar regions.
4. Estimation of Opacity at Other Frequencies
Using the radiative transfer program am (Paine 2019), we estimated the atmospheric transmission spectra between 0 GHz and 1600 GHz in both winter and summer seasons at the Thule Air Base (unlike the Summit, atmospheric windows above 1 THz are entirely opaque at Thule). We used the same assumptions and methods as the calculations of the spectra for the Summit (see Matsushita et al. 2017, for details), except for the following point; we used the reanalysis data of the NASA Modern-Era Retrospective analysis for Research and Applications, Version 2 (MERRA-2 Rienecker et al. 2011; Molod et al. 2015) interpolated to the location of the Thule Air Base.
We first calculated the 25%, 50%, and 75% quartile 225 GHz opacities to compare with the observed quartiles. The calculated 25%, 50%, and 75% quartile 225 GHz opacities in the winter season are 0.12, 0.17, and 0.24, respectively. These values match well with the observed values of 0.14, 0.17, and 0.22 (see Section 3.2 and Figure 4). On the other hand, those of the summer season are calculated as 0.37, 0.55, and 0.78, respectively. Compared to the observed values of 0.26, 0.37, and 0.52, the calculated values are significantly worse. The difference may reflect a dry-weather bias introduced by the data flagging procedure described above (see Section 2). Considering the good agreement between measured and modeled opacities in winter, and reasons to expect bias in the summer measurements, the following spectra are computed with am from the MERRA-2 derived profiles without adjustment to the radiometer measurements.
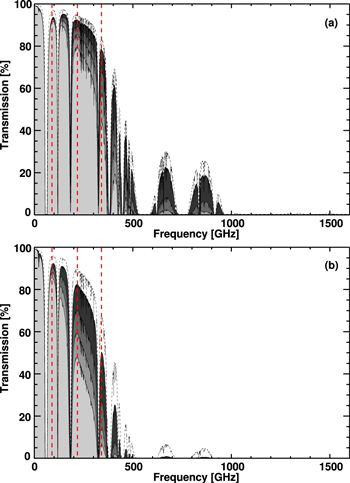
The estimated atmospheric transmission spectra for the 5%, 25%, 50%, and 75% percentile opacity conditions in the winter season are plotted in the top plot of Figure 7. We also overplotted our typical VLBI frequencies (around 86, 221, and 343 GHz) with the vertical red dashed lines. Note that the 5% percentile opacity condition corresponds to a 225 GHz opacity of 0.085 (see the previous paragraph for the opacities at other quartiles). These spectra suggest that it is possible to observe astronomical sources with modest atmospheric attenuation (opacities <0.5) in most (75% quartile) of the winter time at Thule for frequencies lower than 300 GHz, and a quarter of the time for frequencies lower than 350 GHz. Although the atmospheric transmission is low (only up to ∼20%), the 650 GHz and 850 GHz windows are also accessible for 5% of the wintertime.
Figure 7. Estimated atmospheric transmission spectra between 0 and 1600 GHz at Thule in (a) winter and (b) summer seasons. Spectra at 5%, 25%, 50%, and 75% opacity conditions are plotted in grayscale with darker to a lighter gray. We also plot the median atmospheric transmission spectra of the Greenland Summit (Matsushita et al. 2017) with dashed lines in both winter and summer. The 650 GHz and 850 GHz windows are essentially opaque in summer at Thule. The vertical dashed red lines are the typical VLBI observation frequencies of around 86, 221, and 343 GHz.
Download figure:
Standard image High-resolution image
For the summer season, the estimated atmospheric transmission spectra for the 5%, 25%, 50%, and 75% percentile opacity conditions are plotted in the bottom plot of Figure 7. The 5% percentile opacity condition corresponds to the 225 GHz opacity of 0.20. These estimated spectra suggest that it is possible to observe astronomical sources with modest atmospheric attenuation (opacity <0.5) for about 50% of the summertime around the frequency of 220 GHz, which overlaps with the current EHT observation frequency of 221.1 GHz. On the other hand, the 350 GHz window is very difficult to use for observation in summer, with a transmission of ∼50% only 5% of the time. The 650 GHz and 850 GHz windows are too opaque for summer observation.
We also overlaid the median (50% quartile) atmospheric transmission spectra of the Greenland Summit (Matsushita et al. 2017) with dashed lines in both winter and summer plots. It is very clear that the median Summit atmospheric transmission is about 10% better than the 5% percentile opacity conditions in both winter and summer, indicating the superiority of the Summit site condition.
For a given vertical temperature profile and water vapor profile shape, opacity at a given frequency varies linearly with water vapor total column density. Hence, opacities at different frequencies vary linearly with one another, with a small seasonal dependence on the linear coefficients. Practically, this means that the 225 GHz opacity measured by the radiometer can be used operationally to plan observations at other frequencies. We calculated seasonal slope and offset coefficients relating 225 GHz opacity to other submillimeter atmospheric window opacities using the spectra presented above. These calculated values are presented in Table 1.
Table 1. Calculated Linear Correlation Coefficients and Offsets between 225 GHz and Millimeter and Submillimeter Atmospheric Window Opacities at Thule Site in Winter and Summer Seasons
| Winter | Summer | |||
|---|---|---|---|---|
| Frequency | Coefficient | Offset | Coefficient | Offset |
| 86 GHz | 0.11 | +0.074 | 0.12 | +0.068 |
| 345 GHz | 3.70 | −0.053 | 3.62 | −0.020 |
| 410 GHz | 7.10 | −0.083 | 6.83 | +0.012 |
| 492 GHz | 24.6 | −0.36 | 22.9 | +0.21 |
| 675 GHz | 25.8 | −0.60 | 24.1 | −0.027 |
| 875 GHz | 28.8 | −0.68 | 27.6 | −0.25 |
Download table as: ASCIITypeset image
Since the Thule site is more for millimeter astronomy as mentioned above, we calculated the linear relation between 86 GHz and 225 GHz. The opacity at 86 GHz is about 0.11 times the 225 GHz, but a large positive offset of about 0.07 exists.
The opacity at 345 GHz is about 3.7 times larger than the 225 GHz opacity, and that at 410 GHz is about 7 times larger than the 225 GHz opacity for both winter and summer seasons. The differences in these frequencies between winter and summer seasons are small, only a few percent. These values are consistent with the values for the Greenland Summit; coefficients at the Summit are 3.73 and 7.32 for the 345–225 GHz and the 410–225 GHz relations, respectively (Matsushita et al. 2017).
For higher frequencies, 492 GHz, 675 GHz, and 875 GHz opacities are about 25 times larger than that at 225 GHz. The differences for these frequencies between winter and summer seasons are a bit large, with several percent differences. The differences for those values compared with the Summit are also a bit large, around several percent for the winter season, and about 10% for the summer season. But for the summer season, the actual opacities at these frequencies are so high that no astronomical sources can be observed.
The am program also estimates the precipitable water vapor (PWV) together with the transmission spectra, and we present PWV values in Table 2 for both winter and summer seasons. Using these values, it is possible to derive the relation between the 225 GHz opacity and PWV at Thule, which turned out to be

for the winter season, and

for summer season, where τ225 GHz is the 225 GHz opacity. The difference between these equations is several percent.
Table 2. Estimated Precipitable Water Vapor (PWV) at Certain Percentiles in Winter and Summer Seasons of the Thule Site
| Winter | Summer | |||
|---|---|---|---|---|
| Percentile | 225 GHz | PWV | 225 GHz | PWV |
| Opacity | (mm) | Opacity | (mm) | |
| 5% | 0.085 | 0.645 | 0.205 | 2.52 |
| 25% | 0.122 | 1.22 | 0.374 | 5.21 |
| 50% | 0.167 | 1.94 | 0.550 | 8.05 |
| 75% | 0.242 | 3.12 | 0.779 | 11.8 |
| 95% | 0.462 | 6.57 | 1.15 | 18.0 |
Download table as: ASCIITypeset image
With these equations and the relationships between the 225 GHz opacity and that of other frequencies (Table 1) at each season, it is now possible to derive various atmospheric window opacities and PWVs from the 225 GHz opacity that is regularly monitored with the tipping radiometer at the site.
5. Summary
We monitored the 225 GHz sky opacity using a tipping radiometer for five years at the Thule Air Base, where the GLT is currently located. There is an obvious seasonal variation, about 2 times better opacity in the winter than in summer. The opacity quartiles are 0.14, 0.17, and 0.22 for 25%, 50%, and 75%, respectively, in winter, and 0.26, 0.37, and 0.52 for summer, which is about 3 times worse than those at the Greenland Summit. Radiative transfer model calculations show that this site is good for frequencies lower than 300 GHz in most of the winter season, and good for frequencies lower than 350 GHz in a quarter of the winter season. Observations at 650 GHz and 850 GHz are barely possible (about 5% of the winter season) at this site. There is no diurnal variation of the opacity at this site due to its polar region, so that the stable opacity conditions continue for a long time, which is suitable for continuum camera observations and VLBI observations spanning over several days.
The GLT is operated by the Academia Sinica Institute of Astronomy and Astrophysics (ASIAA) and the Smithsonian Astrophysical Observatory (SAO). The GLT is part of the ALMA-Taiwan project, and is supported in part by the Academia Sinica (AS) and the Ministry of Science and Technology (MOST) of Taiwan; MOST 105-2119-M-001-042, MOST 106-2119-M-001-013, MOST 107-2119-M-001-041, MOST 108-2112-M-001-048, MOST 109-2124-M-001-005, and MOST 110-2112-M-001-001. This study is a part of the international collaboration program between the MoST and the National Science Foundation (NSF), "PIRE: black hole Astrophysics in the Era of Distributed Resources and Expertise," MOST 106-2923-M-001-005, MOST 107-2923-M-001-002, MOST 108-2923-M-001-002, MOST 109-2923-M-001-001, and MOST 110-2923-M-001-001.