


Abstract
B[e] stars are surrounded by cool and dense circumstellar environments where molecules and dust are formed. These stars are rare and display complex spectra whose photospheric features are frequently veiled by their circumstellar envelopes, making it difficult to assign them spectral types and evolutionary phases. On the basis of a detailed analysis of medium-resolution spectra in the near-infrared region, together with optical observations and available data from astronomical databases, we attempt to improve their spectral classification and infer the properties of their circumstellar environments. To this aim, we have selected a group of five bright IRAS sources (IRAS 02155+6410, MWC 728, AS 119, MWC 819, and IRAS 07080+0605): one star with large infrared excess and four unclassified B[e] stars or FS CMa stars, most of which have been poorly studied. We present and describe our observations and discuss possible classifications of the sample objects. For all stars, medium-resolution spectra in the region of 2.17–2.39 μm and in the L band are shown for the first time. Infrared features, such as the absorption molecular CO bands and metallic lines, reveal the presence of a late-type companion in MWC 728, and suggest the possible binary nature in AS 119. IRAS 07080+0605 shows evidence of a surrounding cool CO molecular cloud. CS molecular emission may be present in MWC 819 L-band spectra. We suggest that this object is a protoplanetary nebulae.
Export citation and abstract BibTeX RIS
1. Introduction
The B[e] phenomenon is characterized by the presence of strong Balmer emission lines; low excitation permitted and forbidden emission lines in the optical spectra of B-type stars; as well as a strong infrared excess, mainly due to the presence of a dusty disk (cf. Conti 1997). Different astronomical sources undergoing the B[e] phenomenon are usually referred to as B[e] stars. Lamers et al. (1998) attempted to classify B[e] stars according to their evolutionary phases. They recognized pre-main-sequence B[e]-type stars (HAeB[e] stars) and post-main-sequence stars (cPNB[e] stars: compact planetary nebulae B[e]-type stars, and sgB[e] stars: B[e] supergiants). Several interacting binaries belonging to symbiotic B[e]-type stars (SymB[e] stars) were also identified. The circumstellar material around B[e] stars usually veils the stellar surface, making it extremely difficult to assign spectral types and evolutionary stages to these objects. Thus, many of the galactic B[e] stars still remain unclassified (unclB[e] stars, Lamers et al. 1998), as they either display features in common with more than one of the previous groups or a lack of stellar parameter determinations, needed for proper classification (such as effective temperature, distance, and bolometric luminosity). Miroshnichenko (2007) proposed that the unclB[e] stars with little cold circumstellar dust are binary systems undergoing mass transfer and denoted them FS CMa stars.
Given the difficulties to classify some B[e] stars from their optical spectra, other classification tools still need to be considered. Among them, some possibilities are provided by the near-infrared spectral region, where usually traces of atomic and molecular gas can be found.
The detection of enriched elements due to nuclear synthesis in advanced stages of stellar evolution, such as 13CO emission, may help to differentiate a post-main-sequence star from a young stellar object (Kraus 2009; Liermann et al. 2010; Kraus et al. 2013; Oksala et al. 2013; Muratore et al. 2015). The H2 emission is often present in young stellar objects (YSOs; Ishii et al. 2001; van den Ancker et al. 2000; Oliveira et al. 2013), protoplanetary and planetary nebulae (PPN and PN; Bernard Salas et al. 2001; Davis et al. 2003; Mata et al. 2016), indicating the presence of shocked gas or dense gas irradiated by moderately strong non-ionizing radiation. Molecular emission from OH and H2O is typically found in pre-main-sequence stars (Mandell et al. 2008; Doppmann et al. 2011, 2012). Moreover, infrared color–color diagrams may help to distinguish between certain groups. For example, Oksala et al. (2013) proposed a criterion based on infrared colors to distinguish between sgB[e] and luminous blue variable (LBV) stars.
In addition, recombination emission lines from the hydrogen Pfund, Humphreys, and Brackett series have been used as a diagnostic tool of physical conditions in the inner part of circumstellar disks (Marlborough et al. 1997; Lenorzer et al. 2002a; Mennickent et al. 2009; Granada et al. 2010). On the other hand, the structure and dynamics of the outer parts of the disks can be studied by means of forbidden emission lines of O i and Ca ii (Kraus et al. 2016; Aret et al. 2016), and molecular band emission such as 12CO around 2.3 μm (e.g., Kraus 2009; Oksala et al. 2013; Cidale et al. 2012; Kraus et al. 2016), and SiO around 4.1 μm (Kraus et al. 2015). In some cases, it was possible to reveal multi-ring structures rotating in Keplerian fashion (Kraus et al. 2016; Torres et al. 2018; Maravelias et al. 2018), and displaying variability (Liermann et al. 2014).
Finally, as several B[e] stars are suggested to be in binary systems, the near-infrared region would be also useful to search for cool companions of G or K spectral types, because their presence can be directly inferred from the CO and SiO first-overtone absorption bands in the K- and L-band spectra, respectively.
The abovementioned infrared properties can be used as criteria to study many early-type emission-line objects that have been proposed to be B[e] star candidates purely on the basis of their large infrared excess emission or which still have undefined evolutionary state. Therefore, to bring to light the nature of some peculiar B-type stars, we have selected a sample of five emission-line stars of unclear nature (Lamers et al. 1998; Miroshnichenko et al. 2007). Most of them are faint in the V band and lack thorough studies. In this work, we present and describe medium-resolution K- and L-band spectra of these objects together with optical spectroscopic observations. We aim to confirm their B[e] nature by looking for the presence of the characteristic emission lines and molecules. Based on their infrared and optical features we will discuss about the classification of these objects and search for or confirm their binarity.
The present work is structured as follows. Section 2 describes our observations. Section 3 presents a review of our current knowledge of each object and our results on the basis of spectral and spectrophotometric characteristics observed in the optical and infrared ranges. We determined physical and kinematical properties of the circumstellar material around the sample stars. In Section 4, we present a discussion on the properties of the stars, summarize our work, and comment on our future plans.
2. Observations
Our star sample consists of four unclassified B[e] stars, MWC 728, IRAS 07080+0605, AS 119 and MWC 819, and one object with strong infrared excess, IRAS 02155+6410, most of which have been poorly studied. To disclose their nature we performed spectroscopic observations in the optical and infrared wavelength ranges. We gathered, in addition, photometric information from different databases.
Table 1 lists for each star, the IRAS ID, alternative name, coordinates, the V magnitude, 2MASS magnitudes J (1.235 μm), H (1.662 μm) and K (2.159 μm) and WISE magnitudes W1 (3.4 μm), W2 (4.6 μm), W3 (12 μm) and W4 (22 μm). Table 2 summarizes the details on our optical and infrared spectroscopic observations: observatory, instrument, date of observation, wavelength range, spectral resolution, signal-to-noise ratio (S/N) and exposure time.
Table 1. Observed Sample Stars
| IRAS ID | Alternative | α [J2000] | δ [J2000] | V | J | H | K | W1 | W2 | W3 | W4 |
|---|---|---|---|---|---|---|---|---|---|---|---|
| Name | [hh:mm:ss] | [◦:':''] | [mag] | [mag] | [mag] | [mag] | [mag] | [mag] | [mag] | [mag] | |
| 02155+6410 | TYC 4054-353-1 | 02:19:22.80 | +64:24:41.23 | 11.11 | 9.86 | 9.68 | 9.45 | 8.228 | 6.628 | 3.072 | 1.470 |
| 03421+2935 | MWC 728 | 03:45:14.70 | +29:45:03.19 | 9.80 | 8.57 | 7.69 | 6.92 | 5.961 | 5.145 | 3.393 | 1.430 |
| 06070-0938 | AS 119 | 06:09:25.50 | −09:38:49.51 | 12.36 | 10.12 | 9.01 | 7.65 | 5.621 | 3.870 | 1.476 | −0.081 |
| 06420+0122 | MWC 819 | 06:44:37.67 | +01:19:32.50 | 15.30 | 12.10 | 10.45 | 8.58 | 6.725 | 5.114 | 2.764 | 1.438 |
| 07080+0605 | TYC 175-3772-1 | 07:10:43.87 | +06:00:07.84 | 12.76 | 9.85 | 8.36 | 7.00 | 5.526 | 4.458 | 2.434 | 1.077 |
Download table as: ASCIITypeset image
Table 2. Details of the Observations
| Instrument/Observatory | Obs. Date | Spectral | Spect. | S/N | Exp. |
|---|---|---|---|---|---|
| (dd/mm/year) | Range | Res. | Time | ||
| [secs] | |||||
| IRAS 02155+6410 | |||||
| Coudé spec./Ondřejov | 06/04/2012 | 6250–6760 Å | 13000 | 60 | 7200 |
| GNIRS/GEMINI | 07/01/2013 | 2.05–2.22 μm | 6000 | 250 | 800 |
| 12/01/2013 | 2.22–2.38 μm | 6000 | 250 | 1440 | |
| 25/12/2012 | 3.55–3.83 μm | 6000 | 20 | 1280 | |
| 25/12/2012 | 3.83–4.10 μm | 6000 | 30 | 1320 | |
| IRAS 03421+2935 | = | MWC 728 | |||
| Coudé spec./Ondřejov | 20/08/2012 | 5460-5970 Å | 11000 | 90 | 3600 |
| 20/08/2012a | 6250–6760 Å | 13000 | 120 | 3600 | |
| 16/08/2012a | 8470–8980 Å | 18000 | 65 | 3600 | |
| GNIRS/GEMINI | 15/12/2012 | 2.05–2.22 μm | 6000 | 300 | 120 |
| 15/12/2012 | 2.22–2.38 μm | 6000 | 300 | 200 | |
| 17/12/2012 | 3.55–3.83 μm | 6000 | 100 | 640 | |
| 17/12/2012 | 3.83–4.10 μm | 6000 | 50 | 600 | |
| IRAS 06070-0938 | = | AS 119 | |||
| B&C/CASLEO | 09/03/2001 | 3500–4700 Å | 900 | 30 | 1800 |
| REOSC/CASLEO | 30/11/2012 | 6250–6700 Å | 12000 | 15 | 2100 |
| GNIRS/GEMINI | 21/02/2011 | 2.15–2.35 μm | 6000 | 90 | 120 |
| 21/02/2011 | 3.55–3.83 μm | 6000 | 100 | 840 | |
| 06/01/2011 | 3.55–3.83 μm | 6000 | 100 | 840 | |
| 09/12/2010 | 3.83–4.10 μm | 6000 | 50 | 1800 | |
| IRAS 06420+0122 | = | MWC 819 | |||
| REOSC/CASLEO | 02/02/2012 | 6250–6700 Å | 12000 | 10 | 3600 |
| GNIRS/GEMINI | 21/02/2011 | 2.15–2.35 μm | 6000 | 100 | 120 |
| 06/01/2011 | 3.55–3.83 μm | 6000 | 120 | 1200 | |
| 21/02/2011 | 3.83–4.10 μm | 6000 | 120 | 1800 | |
| 26/01/2016 | 3.85–3.94 μm | 18000 | 100 | 2160 | |
| IRAS 07080+0605 | |||||
| Coudé spec./Ondřejov | 13/02/2014 | 6250–6760 Å | 13000 | 40 | 6000 |
| GNIRS/GEMINI | 11/12/2012 | 2.05–2.22 μm | 6000 | 250 | 120 |
| 11/12/2012 | 2.22–2.38 μm | 6000 | 280 | 240 | |
| 11/12/2012 | 3.55–3.83 μm | 6000 | 90 | 800 | |
| 11/12/2012 | 3.83–4.10 μm | 6000 | 25 | 600 | |
Note.
aOndřejov observations of IRAS 03421+2935 are partially described in Aret et al. (2016).Download table as: ASCIITypeset image
2.1. Optical Spectra
We obtained a low-resolution spectrum for AS 119 (IRAS 06070-0938) in 2001 March, using the Boller & Chivens Cassegrain spectrograph with a 600 l/mm grating, a slit width of 250 μm and a 512 × 512 CCD detector attached to the 2.15 m telescope at the Complejo Astronómico El Leoncito (CASLEO), San Juan, Argentina. The covered spectral range was λλ3500–4700 Å. The spectrum was corrected for atmospheric extinction. A He-Ne-Ar lamp spectrum was taken after this observation to perform the wavelength calibration. A flux standard star was used to flux calibrate the data.
Spectroscopic high-resolution observations (R = 12000) for AS 119 and MWC 819 (IRAS 06420+0122) in the region 6250–6700 Å were also carried out at CASLEO with a REOSC echelle Cassegrain spectrograph. The selected instrumental configuration was a 400 l/mm grating in cross-dispersion mode and a Tek 1024 × 1024 CCD.
Using the Coudé spectrograph attached to the Perek 2 m telescope at Ondřejov Observatory (Šlechta & Škoda 2002), we obtained optical observations for IRAS 02155+6410, MWC 728 (IRAS 03421+2935), and IRAS 07080+0605 in three different wavelength regions centered at 5700 Å, 6500 Å, and 8700 Å. We used the 830.77 l/mm grating with a SITe 2030 × 800 CCD.
All high-resolution spectra were reduced using standard IRAF5 tasks, such as bias subtraction, flat-field normalization, and wavelength calibration. Particularly, for the Ondřejov spectra the stability of the wavelength scale was verified by measuring the wavelength centroids of O i sky lines and two rapidly rotating stars were observed (ζ Aql, 27 Vul) for the telluric correction.
2.2. Infrared Spectra
The infrared spectroscopic data of our star sample consists of K- and L-band spectra taken in 2010, 2011, 2012, 2013 and 2016 with the Gemini Near Infrared Spectrograph (GEMINI/GNIRS).
The medium-resolution K-band observations were obtained using long-slit mode with the short camera, an 111 l/mm grating and a 0.3 arcsec wide slit. This same instrumental configuration was adopted for the L-band observations for AS 119 and MWC 819. Whereas the medium-resolution L-band observations of the other three B[e] stars were carried out with the long camera, a 32 l/mm grating and a 0.1 arcsec wide slit. Both instrumental configurations yield a spectral resolution R ∼ 6 000. The spectra were centered at 2.31 μm and 2.29 μm for the K band and at 3.70 μm and 3.94 μm for the L band.
Additionally, we obtained L-band high-resolution observations (R ∼ 18000) for MWC 819 using GEMINI/GNIRS in long-slit mode, with the long red camera, an 111 l/mm grating and a 0.1 arcsec wide slit. The spectra were centered at 3.90 μm.
Several ABBA sequences were taken for each target. Flats and arcs were taken with each source/telluric standard star pair. We used IRAF software package tasks to extract and calibrate the spectra. The data reduction steps included subtraction of the AB pairs, flat-fielding, telluric correction and wavelength calibration. To perform the telluric and instrumental corrections, we used late-B-type telluric standard stars, observed near the object in both, time and sky position (air mass). We selected late-B-type standards because the only intrinsic features they exhibit are neutral hydrogen lines, which are easy to remove, allowing us to obtain a purely telluric spectrum. The latter was used to divide each program object spectrum to obtain a telluric corrected one. The wavelength calibration was performed using the telluric lines.
2.3. WISE Images and Photometric Data
Wide-field Infrared Survey Explorer Space Telescope (WISE) observations of our sample stars, obtained in the W1, W2, W3, and W4 bands were retrieved from the NASA/IPAC Infrared Science Archive (IRSA). WISE mapped the sky at 3.4, 4.6, 12, and 22 μm (W1 to W4 bands) with angular resolutions of 6.1, 6.4, 6.5, and 12 arcseconds, respectively. WISE images, covering a size of 10' × 10' around each of the sample stars, were inspected to study the circumstellar surroundings.
Photometric data for the sample stars was gathered from several catalogs: Johnson photometry, 2MASS, Infrared Astronomical Satellite (IRAS), Midcourse Space Experiment (MSX), WISE, and AKARI. In addition, data for one of the sample stars was obtained from ASAS-3 Photometric V-band Catalog (Pojmanski 2002).
3. Results
The most significant spectroscopic observations of our star sample are shown in Figures 1 and 2. These figures show the most intense hydrogen lines (Hα, Brγ, and Brα) and the K- and L-band spectra of the whole sample, respectively. The main infrared spectroscopic features displayed by the spectra are listed in Tables 3 and 4. In what follows, we will give details of the observational characteristics seen in each individual object and derive some properties of the circumstellar material, based on the infrared and optical data.

Figure 1. Hα, Brγ, and Brα line profiles of the observed stellar sample. The spectral resolution is R = 12000–13000 for the Hα range, and R = 6000 for the near-infrared range.
Download figure:
Standard image High-resolution imageTable 3. Hydrogen Features Observed in K- and L -band Spectra of the Sample Stars
| IRAS ID | Alternative | Brα | Pfγ | Hu14−6 | Hu | Pfund | Brγ |
|---|---|---|---|---|---|---|---|
| Name | Eqw | Eqw | Eqw | Ser. | Ser. | Eqw | |
| [Å] | [Å] | [Å] | [Å] | ||||
| 02155+6410 | ⋯ | ⋯ | ⋯ | ⋯ | ⋯ | ⋯ | 9.77 |
| 03421+2935 | MWC 728 | −18.02 | −3.88 | −1.91 | ⋯ | ⋯ | −6.08 |
| 06070-0938 | AS 119 | −12.60 | −3.97 | −2.16 | em. | ⋯ | −6.26 |
| 06420+0122 | MWC 819 | −49.93 | −8.83 | −1.57 | em. | em. | −35.76 |
| 07080+0605 | ⋯ | ⋯ | ⋯ | ⋯ | ⋯ | ⋯ | inv. PCyg |
Download table as: ASCIITypeset image
Table 4. Main Near-infrared Features Observed in the Secondary Component Spectrum of MWC 728
| Element | λ | Eqw | Element | λ | Eqw |
|---|---|---|---|---|---|
| [μm] | [Å] | [μm] | [Å] | ||
| Si I | 2.1885 | 0.04 | Fe I | 2.2263 | 0.06 |
| 2.2067 | 0.04 | 2.2391 | – | ||
| 2.2544 | 0.04 | 2.2479 | 0.04 | ||
| Ti I | 2.1789 | 0.06 | Ca I | 2.2614 | 0.04 |
| 2.1903 | 0.03 | 2.2631 | 0.11 | ||
| 2.2217 | 0.01 | 2.2657 | 0.07 | ||
| 2.2239 | 0.04 | Mg I | 2.2814 | 0.03 | |
| 2.2280 | 0.01 | 12CO 2-0 | 2.2935 | 0.50 | |
| 2.2317 | 0.04 | 12CO 3-1 | 2.3227 | 0.31 | |
| Na I | 2.2062 | 0.10 | 12CO 4-2 | 2.3525 | 0.45 |
| 2.2089 | 0.10 | 13CO 2-0 | 2.3739 | ⋯ | |
| 13CO 3-1 | 2.3448 | ⋯ |
Download table as: ASCIITypeset image
Table 5. Main Near-infrared Non-hydrogen Features Observed in K- and L-band Spectra of MWC 819
| Element | λ | Eqw | Element | λ | Eqw |
|---|---|---|---|---|---|
| [μm] | [Å] | [μm] | [Å] | ||
| [Fe II] | 2.225 | −0.71 | Fe II? | 2.259 | −0.40 |
| 2.241 | −1.75 | [Ni II]? | 2.308 | -0.43 | |
| 2.244 | −0.36 | Fe II | 3.938 | −3.33 | |
| 2.255 | −0.44 | ||||
| 2.302 | −0.49 |
Download table as: ASCIITypeset image
3.1. Analysis of Individual Objects
IRAS 02155+6410. Clarke et al. (2005) included IRAS 02155+6410 into a group of objects that showed normal H − K colors, but large K − [8] infrared excess. According to these IR colors, they suggested that this kind of objects might not be heavily dust embedded, and are probably post-AGB stars with optically thin cool dust shells, H ii regions, or galactic cirrus contaminated fields. Neither SiO maser emission (Jiang et al. 1999) nor CO associated clouds were detected (Kerton & Brunt 2003). Miroshnichenko et al. (2007) reported IRAS 02155+6410 as an object with a spectral energy distribution (SED) similar to those objects showing the B[e] phenomenon in the IRAS wavelength range. From the SED, these authors derived a Teff = 9 000 K and assigned an A3 spectral type to its optical counterpart.
Our Hα absorption line profile looks similar to the one shown by Miroshnichenko et al. (2007). This line shows a typical Lorentzian type profile in absorption with an incipient emission core (Figure 1, left panel). We did not find [O i] λλ6300, 6364 Å forbidden emission lines. From N II and Si II absorption lines, we estimated a mean value of the projected rotational velocity V sin i = 100 ± 34 km s−1. This value was obtained using a similar method than the one used in Chauville et al. (2001), by performing the Fourier transform to an empirical line profile given by

and obtained by fitting the parameters α, λo, β, and γ.
The K-band spectrum shows a strong Brγ line in pure absorption (Figure 1, center panel), and no presence of forbidden emission lines or CO molecular bands (Figure 2, top panel). There are some features in the region 2.35–2.38 μm that are probably residuals of telluric lines.
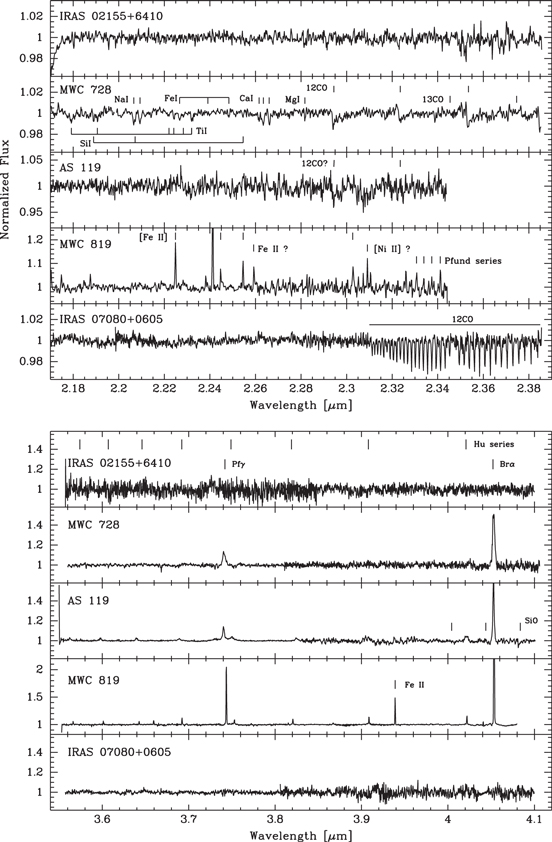
Figure 2. K-band (top) and L-band (bottom) spectra of the observed star sample. For the L-band observations, the tick marks in the top box indicate the position of hydrogen lines of Humphreys, Pfund, and Brackett series. L-band spectra centered at 3.7 μm and 3.94 μm were not observed simultaneously, and thus have different S/N values between both spectral ranges. The mean spectral resolution for all spectra is 6000.
Download figure:
Standard image High-resolution imageThe star shows a featureless spectrum in the L-band (Figure 2, bottom panel). It is noticeable by the absence of the Brα line, which might be filled by emission, as Hα and Brγ are in strong absorption.
A dusty envelope surrounding the star can be seen in the WISE multicolor image at W1 (3.4 μm), W3 (12 μm), and W4 (22 μm) bands (Figure 3).
IRAS 03421+2935 = MWC 728. Merrill & Burwell (1949) first detected this object as an emission-line source. Its IRAS colors are similar to those of OH/IR stars, however no maser lines at 1612/1667 MHz were detected (te Lintel Hekkert et al. 1991; Chengalur et al. 1993). The optical spectra published by Miroshnichenko et al. (2007) show double-peaked Balmer lines, very strong [O i] lines in emission and absence of Fe ii emission lines. These authors also detected absorption lines of Li i λ6708 Å, and Ca i λ6717 Å that are indicative of a late-type companion. A further optical and near-IR spectroscopic study carried out by Miroshnichenko et al. (2015) confirmed the binary nature of MWC 728, which is composed of a B5 V primary star (Teff = 14 000 K) and a G8 III companion (Teff = 5 000 K). They determined an orbital period of 27.5 days. This star was also studied by Aret et al. (2016), who included it in a survey of B[e] stars with [O i] emission lines to search for [Ca ii] emission lines. Particularly, these lines arise in complementary high-density environments (such as the inner-disk regions around B[e] supergiants), but no indication of emission lines from [Ca ii] or the Ca ii IR triplet was found in this object. Among our observations we included the optical spectrum which was shown partly by Aret et al. (2016).
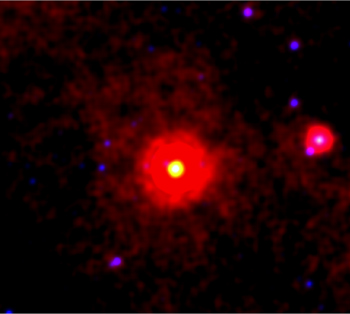
Figure 3. Composition of W1 (blue), W3 (green) and W4 (red) WISE images of the star IRAS 02155+6410, which presents a dusty circumstellar envelope. The image size is 10' × 10'.
Download figure:
Standard image High-resolution imageOur spectra show a Hα line in strong emission with a two-peaked asymmetric profile (V/R < 1, see Figure 1) that resembles the line spectrum from 2014 November 10, shown by Miroshnichenko et al. (2015, see their Figure 10). Furthermore, the Hα emission is overimposed on a broad photospheric absorption component as shown in Figure 4 (top panel). Several hydrogen Paschen lines are seen in the region between 8500 and 8900 Å and show broad absorption profiles with a central emission that remains below the continuum level (Figure 4, bottom right panel). The He i λ5876 Å, and He i λ6678 Å lines show inverse P-Cygni profiles (Figure 4). We also identified absorption lines of N ii λ6284 Å, and Fe ii λ5780 Å. Lines from the spectrum of the cool companion are also present in absorption, such as Li i λ6708 Å, Fe i λ6401 Å, Fe i λ6594 Å, and Fe i λ6614 Å, as well as the Na i doublet interstellar lines λλ5890, 5896 Å. In this spectral region, forbidden emission lines of [O i] λλ6300, 6364 Å are prominent. Using the N II line profile, we estimated a mean value V sin i = 123 ± 41 km s−1 for the primary star.
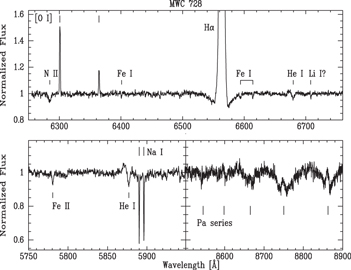
Figure 4. Optical spectrum of MWC 728. The respective spectral resolutions are 13000 (top panel), 11000 (bottom left panel), and 18000 (bottom right panel).
Download figure:
Standard image High-resolution imageThe K-band spectrum shows the Brγ line in emission (Figure 1), and CO molecular bands in weak absorption. In Figure 2 (top) we observe 12CO bandheads of 2–0, 3–1 and 4–2 molecular transitions. In addition, an incipient 13CO absorption is present. We also identified several absorption lines of neutral atoms of Ca i, Na i, Mg i, Ti i, Si i, and Fe i.
In the L band, we observe Pfγ and Brα lines in strong emission and the line Hu14−6 at 4.021 μm, in weak emission (Figure 2, bottom panel).
IRAS 06070-0938 = AS 119. This star was reported as an object with large infrared excess by Dong & Hu (1991) and considered as an unclB[e] star by Lamers et al. (1998). Based on optical and near-infrared spectra and on multicolor photometry, Miroshnichenko et al. (2006) suggested that AS 119 belongs to the FS CMa group and might be a possible binary in a phase of rapid mass transfer. In contrast to this, Lee & Chen (2009) using data from 2MASS classified it as a T Tauri star.
Cidale et al. (2001) determined the fundamental parameters of this star using the BCD spectrophotometric system (Barbier & Chalonge 1941; Chalonge & Divan 1973). They classified it as a B giant but the measured observations were not flux calibrated so that the parameters may not be reliable.
For the present work, we obtained a new low-resolution spectrum around the Balmer discontinuity (Figure 5) and measured the parameters based on a flux-calibrated spectrum which resulted in λ1 = 74 Å, D = 0.16 (for details, see Aidelman et al. 2018). Then, using the new BCD effective temperature calibration curves (Zorec et al. 2009), we derived an improved set of fundamental parameters: Teff = 23 200 ± 1 570 K, log g = 4.3 ± 0.1, MV = − 2.3 ± 0.2 mag, and the spectral type B3 V.

Figure 5. Flux-calibrated low-resolution (R ∼ 900) spectrum of AS 119 from which the BCD parameters were determined.
Download figure:
Standard image High-resolution imageIn Figure 5, we can observe the highest members of Balmer series in absorption. Hδ line appears as if it is filled in by emission, and Hγ shows a broad absorption profile with a sharp emission overimposed on the red wing. Comparing this spectrum with the one taken in 1997 (see Figure 2 in Cidale et al. 2001), we notice more Balmer lines toward the Balmer's limit and a decrement in the line strengths of Hγ and Hδ. Numerous lines of Fe ii and [Fe ii] as well as [S ii] λ4069 Å are seen in emission. Fe ii and [Fe ii] lines are also more intense than in 1997. Absorption lines of Ca ii λλ3933, 3968 Å, He i λ4471 Å, and Mg ii λ4481 Å are also present.
The optical high-resolution spectrum taken at CASLEO shows single-peaked emission in [O I] and [N II] and a two-peaked Hα line profile in strong emission, with a V/R < 1 (Figure 1, left panel). The Hα profile looks similar in shape and intensity to the one shown by Miroshnichenko et al. (2006). The Na i D-lines show a deep narrow component with a radial velocity of 30 km s−1, similar to the velocity of other photospheric lines (30–40 km s−1), two broad weak redshifted components around 160 km s−1, and a weak emission component blueward Na i λ5890 Å at −50 km s−1 (Figure 6). A weak He i λ5876 Å line seems to be present with a velocity of 40 km s−1.

Figure 6. AS 119 spectrum showing He i λ5876 Å and Na i D-lines. (R ∼ 12000).
Download figure:
Standard image High-resolution imageThe only feature that clearly appears in the K-band spectrum is the Brγ line in emission (see Figure 1). In the region around 2.3 μm, a weak CO molecular absorption feature could be present. However, the S/N of the spectrum does not allow us to confirm it (Figure 2, top panel).
The L-band spectrum shows Brα, Pfγ, and several lines of the Humphreys series in emission. The Brα line is the strongest one and shows a single-peaked profile, with an intensity of 1.7 above the continuum level (see Figure 1). The other hydrogen line profiles are wide and weak as can be seen in Figure 2 (bottom panel). In the same figure, we notice the presence of a weak molecular band in absorption located at 4.0830 μm. This feature could be attributed to the 28Si16O (v = 4 − 2) bandhead, although the other two bands of the same isotope at 4.0437 μm (v = 3 − 1) and at 4.0042 μm (v = 2 − 0) are not evident. The former, if present, might be blended with the Brα line (see Figure 7).
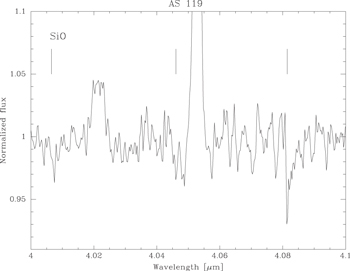
Figure 7. Zoomed-view of the SiO bandheads in the L-band spectrum of AS 119
Download figure:
Standard image High-resolution imageIRAS 06420+0122 = MWC 819. This is a B[e] star (The et al. 1994) whose evolutionary state is still not clearly established. Lamers et al. (1998) put it into the unclB[e] group. It was misclassified as a planetary nebula (Kohoutek 2001), and Miroshnichenko (2007) proposed it as a FS CMa candidate. Marston & McCollum (2008) presented narrowband Hα imaging of its environment showing lobes on one side of the star. Pereira et al. (2008) studied its optical spectrum and, according to the line strength of [N ii] λ5754 Å relative to [O i] λ6300 Å, concluded that it is either a sgB[e] or a protoplanetary nebula. Using a set of [Fe ii] lines they derived an excitation temperature Tex = 12 000 K.
In Figure 1 we show our observation of the Hα line profile which reaches an intensity of 100 over the continuum level and has two peaks with V/R < 1. As our spectrum in the optical and red regions is underexposed, except for the extremely strong Hα, [O I] and [N II] emission, we could not reliably identify any other lines.
The main feature in the K-band spectrum is a strong single-peaked Brγ line in emission (even stronger than the Brα line, see Figure 1). The Pfund lines are visible in weak emission up to n ∼ 34 (Figure 2, top panel). There are some weak lines of [Fe ii] between 2.22 μm and 2.30 μm. Emission lines at λ2.258 μm and λ2.308 μm could be identified as Fe ii and [Ni ii], respectively. We detected neither He i λ2.185 μm nor CO bandheads around 2.3 μm.
The main features in the L-band are emission lines of Humphreys series and also Brα and Pfγ lines, the latter being narrow and very strong (Figure 2, bottom panel). It is noticeable the strong Fe ii λ3.938 μm emission line. The L-band spectrum displays faint emission features, which might be tentatively identified with the bandhead transition v = 2 − 0 of the carbon monosulfide (CS) molecule near 3.87 μm (see Figure 8). The second bandhead near 3.908 μm (v = 3 − 1) is not evident in the present observation. Anyway if it were present, it would be difficult to detect as it is blended with the Hu15−6 line.
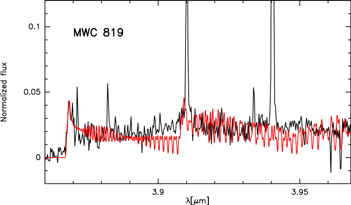
Figure 8. L-band middle resolution spectrum (R ∼ 6000) of MWC 819, taken in 2011, showing the region where the CS band emission could be present. The red solid line represents the best model fit.
Download figure:
Standard image High-resolution imageTo identify the CS molecule we computed synthetic bandhead models. For this, we modified our existing CO disk code (Kraus et al. 2000) by implementing the CS line lists and Einstein transition probabilities given by Chandra et al. (1995). From the shape of the first bandhead we estimated a CS rotation velocity projected to the line of sight of <20 km s−1. The temperature and column density of the best-fitting model are T(CS) = 800 K and N(CS) = 1020cm−2.
To confirm the presence of CS and to better constrain the physical parameters, we obtained new infrared high-resolution (R = 18000) observations in 2016, which also revealed a weak bandhead near 3.87 μm (Figure 9) although we could neither fit the whole molecular pattern nor provide another identification of this emission feature. This could be caused by the strong pollution of the telluric lines longward the position of the expected first CS bandhead, or blends with other features that we were not able to identify. Moreover, as there is a large time interval (5 years) between both observations, the molecular ring or shell structure detected in 2011 could have expanded, thus the emission could have been diluted. A possible candidate for the blending is the iron monoxide molecule FeO. The P and Q branches of the FeO spectrum lay under the feature identified as the first CS bandhead while the R branch has smaller features at 3.85 μm. The possible presence of FeO may suggest some unusual chemistry caused by Brα pumping (Dalgarno et al. 1997).

Figure 9. L-band high-resolution R ∼ 18000) spectrum of MWC 819, taken in 2016, in the region of the CS molecular emission.
Download figure:
Standard image High-resolution imageIn Figure 10 we show the spatial distribution of tenuous dust around the star. The image was built in logarithmic scale, combining WISE W2 (4.6 μm), W3 (12 μm), and W4 (22 μm) bands.

Figure 10. Combined WISE W2 (blue), W3 (green), and W4 (red) images showing the presence of a teneous dusty envelope around MWC 819. The image size is 10' × 10'.
Download figure:
Standard image High-resolution imageIRAS 07080+0605. This is a poorly studied star in the Northern Milky Way that has a strong Hα line in emission (Kohoutek & Wehmeyer 1999). Miroshnichenko et al. (2007) presented portions of a high-resolution spectrum that reveals broad H absorptions and double-peaked emissions in Hα, Hβ and [O i] lines with a peak separation of ∼50 km s−1. They noted the extremely strong IR excess from 2MASS and IRAS fluxes. These authors classified the underlying star with an A spectral type probably surrounded by circumstellar material originated from rapid mass transfer in a binary system.
Our Hα line observation displays a strong and complex double-peaked profile (V/R < 1 with a peak separation of ∼90 km s−1) superimposed over a broad photospheric component (Figure 1). Single-peaked emission lines of [O i] λλ6300, 6364 Å, [N ii] λλ6548, 6584 Å, and [Ni ii] λ6667 Å are also prominent. Permitted lines of Si ii λλ6347, 6371 Å, and Fe ii λ6456 Å are in absorption (Figure 11). From Fe II and Si II absorption lines we estimated a mean value of the projected rotational velocity, V sin i, of 65 ± 2 km s−1.

Figure 11. Optical spectrum of IRAS 07080+0605 in the region around Hα line (R ∼ 13000).
Download figure:
Standard image High-resolution imageThe K-band spectrum shows an inverse P-Cygni type profile in Brγ line (Figure 1). We do not detect any additional features that could reveal the presence of a late-type companion. However, it is interesting to remark the presence of the characteristic ro-vibrational v = 0–2 R- and P-branch CO absorption features between 2.29–2.32 μm and 2.35–2.37 μm, respectively (Figure 2, top panel). We confirm that this intriguing feature does not correspond with residual telluric lines. The mean radial velocity of the CO lines is around 8 km s−1 similar to that of the forbidden lines present in the optical region.
The star displays a featureless L-band spectrum. As Brα line is not detected, we suggest it could be filled in with emission.
Using ASAS-3 Photometric V-band Catalog (Pojmanski 2002), we plot the visual light curve for IRAS 07080+0605 (see Figure 12, top panel) using two different data sets that cover seven years, from 2002 to 2009. We kept only those data labeled with quality A. The star shows light variations with an amplitude of around 0.6 mag. Using the Lomb-Scargle algorithm (Scargle 1982), we derived an approximate period P = 265 days (see Figure 12, bottom panel).

Figure 12. IRAS 07080+0605 light curve based on ASAS − three photometric data as a function of time (top) and phase (bottom).
Download figure:
Standard image High-resolution image3.2. Physical Properties of the Circumstellar Material
To characterize the circumstellar environment, we used a simple model of an envelope made of gas and dust, and analyzed its effect on the spectral energy distribution (SED) of a normal star with a spectral type similar to that of the sample stars. By comparing the theoretical results with the observations, we can derive the global physical properties of the gas and dust envelopes.
We consider the circumstellar material distributed in a gaseous region located close to the star (≈3 R*) and a dusty region, far from the star (≳100 R*) (Zorec 1998; Muratore et al. 2010). We took the star flux models from Kurucz (1979).
The proposed model of the gaseous circumstellar envelope is based on those presented in Cidale & Ringuelet (1989) and Moujtahid et al. (1999). We calculate the emergent flux of a system formed by a star plus a spherical envelope by considering that the envelope can be reduced to an equivalent shell. We can then apply a plane-parallel solution for the transfer equation. The observed flux at a distance d obtained in this way can be expressed as
with  , optical depth of the gaseous shell; R*, stellar radius; RG, gaseous shell effective radius;
  , photospheric stellar flux;
  , source function; and TG, electron temperature of the gas. The factor αλ describes the attenuation of the star flux in the gas shell and the term Sλβλ describes the emissivity of the gas. αλ and βλ can be numerically calculated.
The circumstellar dust region is treated using the same scheme proposed for the gaseous region. We characterize the dust by a total optical depth,  , a temperature, TD, and a source function, Sλ = Bλ(TD). The model allows to add multiple dust components. We represent the interstellar extinction by
  . Both,
  and
and  are related to the absorption A(λ) through the expression τ = 0.4ln(10) A(λ). Using the law given by Cardelli et al. (1989),
 ![$A(\lambda )=[{R}_{v}a(1/\lambda )+b(1/\lambda )]E(B-V)$](https://content.cld.iop.org/journals/1538-3873/130/993/114201/revision1/paspaadf23ieqn8.gif) , where Rv is the total to selective extinction, and
, where Rv is the total to selective extinction, and  is the color excess. We adopt
  for the interstellar dust, while for the circumstellar dust we try different values of RvD greater than 3.1.
Finally, we obtain an expression for the observed flux at a distance d, for: star + gaseous shell + dust shell + interstellar extinction given by
To eliminate the dependence on the distance, d, we normalize the flux to that at a reference wavelength λref. Using expression (3), we obtain the theoretical SED, from 0.1 to 100 μm, for different sets of the free parameters of our model: RG, TG,  , RD, TD, RvD,
  , and EISM(B − V). We adopt from the literature the spectral type and luminosity class for the sample stars when available, and construct the observed energy distribution using data from different photometric catalogs. In Figure 13, we present the best fit to the observed SEDs for the sample stars and in Table 6 we list the adopted model parameters.

Figure 13. Observed energy distributions of the B[e] star candidates constructed by using the photometric data from Johnson photometry, 2MASS, IRAS, MSX, WISE, and AKARI catalogs. The solid line shows the best fit of the gas and dust envelope model.
Download figure:
Standard image High-resolution imageTable 6. Dust and Gas Envelope Parameters Obtained with the Best-fitting Model to the Observed SEDs of the Sample Stars
| IRAS ID | Alternative | Teff | log g | Tgas | Rgas |

|
Ndust | Tdust1 | Rdust1 | Tdust2 | Rdust2 | Tdust3 | Rdust3 | Av |
|---|---|---|---|---|---|---|---|---|---|---|---|---|---|---|
| Name | [K] | [K] | [R*] | [K] | [R*] | [K] | [R*] | [K] | [R*] | [mag] | ||||
| 02155+6410 | ⋯ | 11000 | 4.0 | 7000 | 2.0 | 0.3 | 2 | 370 | 1850 | 140 | 17000 | ⋯ | ⋯ | 1.5 |
| 03421+2935 | MWC 728 | 14000 | 4.5 | 12000 | 1.2 | 0.5 | 2 | 900 | 320 | 150 | 8000 | ⋯ | ⋯ | 1.0 |
| 5000 | 3.0 | ⋯ | ⋯ | ⋯ | ⋯ | ⋯ | ⋯ | ⋯ | ⋯ | ⋯ | ⋯ | ⋯ | ||
| 06070-0938 | AS 119 | 23000 | 4.0 | 11000 | 5.0 | 0.9 | 3 | 850 | 900 | 400 | 3600 | 100 | 60000 | 4.3 |
| 06420+0122 | MWC 819 | 26000 | 3.0 | 13000 | 4.0 | 0.8 | 3 | 700 | 1400 | 300 | 7500 | 90 | 83400 | 5.4 |
| 07080 + 6410 | ⋯ | 13000 | 4.5 | 11000 | 1.2 | 0.9 | 3 | 1000 | 350 | 600 | 700 | 100 | 40000 | 2.5 |
Download table as: ASCIITypeset image
3.3. Kinematics of the Circumstellar Gas
Except for IRAS 02155+6410, all stars display intense [O i] line emission which is typically formed in a circumstellar or circumbinary disk around B[e] stars. Moreover, the spectra of AS 119, MWC 819, and IRAS 07080+0605 show emission of [N ii], and the latter star also of [Ni ii]. These forbidden emission lines are optically thin. Modeling their profiles provides full information of the kinematics within their line-formation region. In all stars, the [O i] lines display symmetric, single-peaked (in our medium-resolution spectra) profiles that are redshifted with respect to the laboratory wavelength. These redshifts are 6 ± 1 km s−1 for IRAS 07080+0605, 26 ± 1 km s−1 for AS 119, 73 ± 1 km s−1 for MWC 819, and 30 ± 1 km s−1 for MWC 728, and we correct all forbidden emission lines with these radial velocities to center the line profiles.
Only for MWC 819 can the shapes of the forbidden lines be reproduced with a pure Gaussian profile. In the spectra of all other stars, the profiles require an additional, non-Gaussian component, for which we assume Keplerian rotation, to be in line with the suggestion that B[e] stars are surrounded by an equatorial disk. For simplicity, we apply a rotating ring model for the gas kinematics, add (if needed) a Gaussian component, and convolve the resulting line profile with a Gaussian component of 23 km s−1, respectively. 25 km s−1 representing the resolution of the Ondřejov, respectively, CASLEO spectrograph.
We find that the [O i] and [N ii] lines of MWC 819 can be reproduced with just a single Gaussian profile with a velocity of 16.5 ± 2 km s−1. If a rotation component is present in these profiles, its velocity should be smaller than ∼5 km s−1. In contrast, the [O i] lines of MWC 728 can be fitted reasonably well with just a single ring with rotation velocity (projected to the line of-sight) of 29.5 ± 0.5 km s−1. For AS 119, the [O i] lines are composite, meaning that both a rotation (25 ± 1 km s−1) and a Gaussian (25 ± 2 km s−1) component are required to reproduce the profile shape, whereas the profile of the [N ii] line is much narrower and can be fitted with a single Gaussian velocity of 16 ± 2 km s−1. As for the lines in MWC 819, we cannot exclude a rotation component contributing to the profile of [N ii] but, if present, it should be small (<5 km s−1). The model parameters for our fits are summarized in Table 7 for the objects AS 119, MWC 819, and MWC 728, and model profiles are shown in Figure 14 in comparison to the observations.

Figure 14. Fit (red) to the observed (black) forbidden lines in the Ondřejov and CASLEO spectra of four of our objects.
Download figure:
Standard image High-resolution imageTable 7. Velocities needed for Fitting the Line Profiles of the Forbidden Lines in AS 119, MWC 819, and MWC 728
| Line | AS 119 | MWC 819 | MWC 728 | ||||||
|---|---|---|---|---|---|---|---|---|---|

|
vgauss |

|

|

|
vgauss | ||||
| [O i] 6300 | 25 ± 1 | 25 ± 2 | <5 | 16.5 ± 2 | 29.5 ± 0.5 | ⋯ | |||
| [O i] 6364 | 25 ± 1 | 25 ± 2 | <5 | 16.5 ± 2 | 29.5 ± 0.5 | ⋯ | |||
| [N ii] 6583 | <5 | 16 ± 2 | <5 | 16.5 ± 2 | ⋯ | ⋯ | |||
Download table as: ASCIITypeset image
The [O i] line profiles of IRAS 07080+0605 contain just a single rotation velocity component (projected to the line of sight) of 26 ± 0.5 km s−1. However, the lines of [N ii] and [Ni ii] are less trivial. Their profiles display an extended blue wing causing very asymmetric profile shapes. Hence, a single rotation profile is not suitable to fit these asymmetries. Instead, additional blueshifted components are required to account for the blue wing. For simplicity, we assume that the complete line profile is a superposition of emission from individual gas rings, each with its own blueshifted radial velocity component. Then, the profile shapes of the [N ii] and [Ni ii] lines can be fitted with a combination of four and three rings, respectively. The combination of rotating rings and their individual blueshift is listed in Table 8, and the final fits to the observed profiles are shown in Figure 14. Interestingly, we find that the same rotation component of 65 km s−1 in both the [N ii] and [Ni ii] profiles, as well as the ring with 26 km s−1 as seen in the [O i] lines is present in both. The slight difference in needed radial velocity for the ring at 65 km s−1 in modeling the [Ni ii] might not be real, because this line is the weakest hence noisiest in our spectrum.
Table 8.
Set of Rings Around IRAS 07080+0605 Detected in the Various Line Profiles. Listed Are their Rotation Velocities Projected to the Line of Sight ( ) and their Radial Velocities (vrad). All Velocities Are in Units [km s−1]
| Line | Ring 1 | Ring 2 | Ring 3 | Ring 4 | Ring 5 | |
|---|---|---|---|---|---|---|
| [N ii] 6583 |

|
110 ± 2 | 65 ± 2 | 45 ± 1 | 26 ± 0.5 | ⋯ |
| vrad | −42 ± 1 | −25 ± 1 | −10 ± 1 | 0 ± 0.5 | ⋯ | |
| [Ni ii] 6667 |

|
⋯ | 65 ± 2 | ⋯ | 26 ± 0.5 | <10 |
| vrad | ⋯ | −20 ± 1 | ⋯ | 0 ± 0.5 | 0 ± 0.5 | |
| [O i] 6300 |

|
⋯ | ⋯ | ⋯ | 26 ± 0.5 | ⋯ |
| vrad | ⋯ | ⋯ | ⋯ | 0 ± 0.5 | ⋯ | |
| [O i] 6364 |

|
⋯ | ⋯ | ⋯ | 26 ± 0.5 | ⋯ |
| vrad | ⋯ | ⋯ | ⋯ | 0 ± 0.5 | ⋯ |
Download table as: ASCIITypeset image
Our results provide certainly not a unique solution to the profile fits hence circumstellar kinematics, and it is also not known whether IRAS 07080+0605 has a companion. Nevertheless, our findings of possible multiple rings centered at various velocities is in agreement with what was reported for other B[e] stars in binary systems (see, e.g., Maravelias et al. 2018). Alternatively, the blue wings of the [N ii] and [Ni ii] lines might suggest high-velocity outflows of ionized gas, maybe in the form of a jet or knots, as is seen in the B[e] star MWC 137 (Mehner et al. 2016; Kraus et al. 2017).
3.4. Diagnostic of the Gaseous Envelope from Infrared H I Emission Lines
Infrared flux ratios of H i recombination lines can be used as a diagnostic tool to constrain the geometry of the ionized circumstellar material around early-type peculiar stars such as B[e] or Be stars (Lenorzer et al. 2002a). Particularly, the H i emission-line strengths are sensitive to the density of the emitting gas: high densities result in optically thick lines for which line strength is only dependent on the emitting surface while low-density gas produces optically thin lines. In this way it is possible to separate disk and wind structures. Lenorzer et al. (2002a) constructed a log (Hu14−6/Brα) versus log (Hu14−6/Pfγ) line ratio diagram that allow to determine the characteristics of the envelope according to the star location on the diagram. Stars located close to the region corresponding to the Menzel case-B recombination theory (Baker & Menzel 1938) (shaded region in Figure 15) have optically thin envelopes while stars located toward the top-right region of the diagram have optically thick circumstellar disks.

Figure 15. Lenorzer et al. (2002a) diagram, where the program stars AS 119, MWC 728, and MWC 819 are added in red asterisks. Be stars (open circles), B[e] stars (filled circles), and LBVs (squares) are well separated. The black asterisk in the upper right corner corresponds to the expected emission from a blackbody and the shaded region represents the emission from isothermal wind models.
Download figure:
Standard image High-resolution image
Only three stars of our sample show Pfγ, Hu14−6 and Brα lines in emission: IRAS 06070-0938 (AS 119), IRAS 03421+2935 (MWC 728), and IRAS 06420+0122 (MWC 819). To measure the line ratios, we flux-calibrated each spectrum and corrected the equivalent width of Brα and Pfγ lines for photopheric absorption of the underlying star based on the relation proposed by Lenorzer et al. (2002b). The obtained values are listed in Table 9. In Figure 15 we show the location of these stars in the Lenorzer et al. (2002a) diagram. MWC 819 is close to the optically thin isothermal wind region, while AS 119 and MWC 728 are near the region of B[e] stars with thin circumstellar disks.
Table 9. Measured Flux Ratios for Three Sample Stars
| IRAS ID | Alternative | (Hu14−6/Brα) | (Hu14−6/Pfγ) |
|---|---|---|---|
| Name | |||
| 03421+2935 | MWC 728 | 0.079 | 0.14 |
| 06070-0938 | AS 119 | 0.089 | 0.18 |
| 06420+0122 | MWC 819 | 0.022 | 0.10 |
Download table as: ASCIITypeset image
4. Discussion
In this work, we discuss the optical and infrared spectral characteristics of five early-type peculiar stars, four of which belong to the unclB[e] group or the subgroup of FS CMa stars defined by Miroshnichenko (2007). Spectroscopic observations in the near-infrared are shown for the first time.
For IRAS 02155+6410, an A3 spectral type was determined from its optical spectrum (Miroshnichenko et al. 2007). The lack of forbidden lines and of Balmer lines in emission disqualify it from being a B[e] star. Its incipient emission in Hα and its Brα line, filled by emission, suggest the presence of a teneous gaseous envelope. The large infrared excess might be originated in a dusty envelope surrounding the star, which can be seen in the WISE multicolor image at W1 (3.4 μm), W3 (12 μm), and W4 (22 μm) bands (Figure 3). Our SED modeling suggests the presence of two cool dust components.
We found that the infrared spectra of MWC 728 reveal the presence of a late-type companion. Particularly, the K- and L-band spectra of MWC 728 present numerous atomic lines of neutral elements and the 12CO bands in absorption, which agrees with the presence of a G-type secondary. Based on the measured equivalent widths of the three observed CO bandheads (EW2−0 = 0.5 Å, EW3−1 = 0.31 Å, and EW4−2 = 0.45 Å) and using the temperature indicators proposed by Förster Schreiber (2000) we estimated a temperature between 5 000 K and 5 500 K for the cool companion. This temperature should be taken as an upper limit, as the contribution to the continuum due to dust, wind and the main stellar component may lead to a reduction of the measured CO bands equivalent widths. Indeed, the presence of Ti i lines suggests a slightly lower temperature. A warm and cold dust component are required to reproduce the SED, and the [O I] line profiles suggest an additional narrow ring of hot gas, revolving MWC 728 possibly on a circumbinary orbit.
From a new flux-calibrated optical spectrum, we derived an improved set of stellar parameters for AS 119. The near-infrared observations suggest that this star is a binary, based on the presence of weak traces of CO and SiO absorption bands which point to a K-type giant companion. The binarity is also suggested by the presence of a second redshifted component of Na i lines in the optical spectrum, the variability around the Balmer discontinuity and the the brightness variations up to 0.9 mag, revealed by the light curve shown by Miroshnichenko et al. (2006). The emission component observed in Na i at −50 km s−1 might suggest the presence of a gaseous stream, probably linked to chromospheric activity in the cool star. The primary star has a B3 V spectral type. From Table 6 we see that the estimated total absorption affecting the observed energy distribution amounts to Av = 4.3 mag, which takes into account the absorption of the circumstellar gas, the circumstellar dust and the interstellar extinction. Thus, using the BCD absolute magnitude, we obtain for the distance of the star d = 920 ± 300 pc, which is consistent with distance measured by GAIA dG = 1132 ± 60 pc. The kinematics extracted from the forbidden line profiles suggest either composite formation region consisting of a narrow rotating ring and a possible wind component, or a rotating ring with a certain width causing the extra Gaussian broadening component. Moreover, the SED modeling requires three dust components, suggesting a complex circumbinary environment, possible remnant of previous interaction phases.
Regarding the peculiar spectrum of MWC 819, the lack of CO band emission in the K-band spectrum and the possible presence of a weak CS bandhead in emission, imply that the circumstellar material of MWC 819 is much cooler than in typical compact planetary nebulae or sgB[e] stars, so that the excitation of the upper vibrational levels in the CO molecule is insufficient to generate measurable band emission. In addition, according to the H − K (1.86) and J − H (1.66) colors, MWC 819 falls out of the sgB[e] region defined in the color–color diagram from Oksala et al. (2013). However, its colors are indicative of a highly reddened object, similar to PN G355.2-02.0 (Weidmann et al. 2013), which suggests that MWC 819 might be a protoplanetary nebula, in agreement with a carbon-rich circumstellar environment. The scenario of a protoplanetary nebula is further supported by the forbidden emission lines, which are very intense in MWC 819. Their mild, pure Gaussian broadening indicates their formation within a dense gas shell. The presence of either oxygen or carbon dominated molecular species in the environments of stars is an unambiguous tracer for the star's evolutionary history. Massive stars always maintain an oxygen-rich envelope, and in their ejecta consequently oxygen-based molecules form, such as silicon monoxide (SiO) (e.g., Kraus et al. 2015). In contrast, intermediate mass stars pass through an AGB phase with several dredge-up episodes, in which carbon is mixed from the center to the stellar envelope. Thus, the stars with an excess in C atoms can form carbon-based molecules such as CS.
For IRAS 07080+0605, the observed Si II and Fe II lines in absorption are consistent with a late-B or early-A spectral type, which agrees with the A0-type classification determined by Miroshnichenko et al. (2007). In addition, the inverse P-Cygni Brγ profile might suggest accretion of material. The infrared spectrum reveals neither the presence of a late-type companion nor H2 lines, typically observed in young stellar objects. However, the observed strong feature of warm CO gas along the line of sight could be compatible with the presence of massive star-forming regions (van Dishoeck et al. 1998). Considering our spectroscopic analysis, together with the detection of optical forbidden emission lines, we could suggest that IRAS 07080+0605 is a pre-main sequence A0-type binary still embedded in a warm CO molecular cloud, although signs of star-forming regions were not detected in the nearby by visual inspection of optical and WISE images. CO narrow absorption lines have already been detected toward HL Tau, a T-Tauri star (Brittain et al. 2005). They found that these lines originate from the circumstellar gas at a temperature of ∼100K and that the gas is located fairly distant from the central star (>1 au). On the other hand, the star shows visual photometric variability, with an amplitude of around 0.6 magnitudes, and a period of 256 days that resembles those reported for other FS CMa-type stars like the FS CMa and V0743 Mon, suggesting a possible binary nature of IRAS 07080+0605. Its SED modeling requires three dust components, of which the innermost is rather hot. The star seems to be surrounded by multiple narrow rings of hot gas. If the binary scenario will turn out to be correct, then these multiple rings might have been caused by previous interaction phases.
The near-infrared spectra of our sample stars showed very different characteristics for each object: the presence of warm molecular gas clouds, the binary nature of some stars through spectral lines of the secondary component or uncommon molecular emission like CS. All these features provide valuable information that contributes to characterize the nature and circumstellar environment of these peculiar objects. A larger object sample as well as a wider spectral range, including J and H bands, will help to get more insight into this heterogeneous group of objects and to build more precise classification criteria.
This research has made use of the SIMBAD database, operated at CDS, Strasbourg, France.
This publication makes use of data products from the Wide-field Infrared Survey Explorer, which is a joint project of the University of California, Los Angeles, and the Jet Propulsion Laboratory/California Institute of Technology, funded by the National Aeronautics and Space Administration.
L.C. acknowledges financial support from the Agencia de Promoción Científica y Tecnológica (Préstamo BID PICT 1971/2016), CONICET (PIP 0177), and the Universidad Nacional de La Plata (Programa de Incentivos G11/137), Argentina. M.K. acknowledges support from GA ČR (17-02337S). The Astronomical Institute Ondřejov is supported by the project RVO:67985815. Financial support for International Cooperation of the Czech Republic and Argentina (AVCR-CONICET/14/003) is acknowledged.
Footnotes
- *
Based on observations obtained at (1) the Gemini Observatory, which is operated by the Association of Universities for Research in Astronomy, Inc., under a cooperative agreement with the NSF on behalf of the Gemini partnership: the National Science Foundation (United States), the National Research Council (Canada), CONICYT (Chile), the Australian Research Council (Australia), Ministério da Ciência, Tecnologia e Inovação (Brazil) and Ministerio de Ciencia, Tecnología e Innovación Productiva (Argentina), under programs: GN-2010B-SV-157, GN-2012B-Q-101 and GN-2016A-Q-92 (PI: L. Cidale); (2) the Complejo Astronómico El Leoncito (CASLEO), operated under an agreement between the Consejo Nacional de Investigaciones Científicas y Técnicas de la República Argentina, the Secretaría de Ciencia y Tecnología de la Nación and the National Universities of La Plata, Córdoba and San Juan, Argentina; (3) the Perek 2m-telescope at Ondřejov Observatory, Czech Republic.
- 5
IRAF is distributed by the National Optical Astronomy Observatory, which is operated by the Association of Universities for Research in Astronomy (AURA) under cooperative agreement with the National Science Foundation.