
Abstract
Dopaminergic neurons are specialized cells in the substantia nigra, tasked with dopamine secretion. This secretion relies on intracellular calcium signaling coupled to neuronal electrical activity. These neurons are known to display spontaneous calcium oscillations in-vitro and in-vivo, even in synaptic isolation, controlling the basal dopamine levels. Here we outline a kinetic model for the ion exchange across the neuronal plasma membrane. Crucially, we relax the assumption of constant, cytoplasmic sodium and potassium concentration. We show that sodium-potassium dynamics are strongly coupled to calcium dynamics and are essential for the robustness of spontaneous firing frequency. The model predicts several regimes of electrical activity, including tonic and 'burst' oscillations, and predicts the switch between those in response to perturbations. 'Bursting' correlates with increased calcium amplitudes, while maintaining constant average, allowing for a vast change in the calcium signal responsible for dopamine secretion. All the above traits provide the flexibility to create rich action potential dynamics that are crucial for cellular function.
Export citation and abstract BibTeX RIS

Original content from this work may be used under the terms of the Creative Commons Attribution 4.0 license. Any further distribution of this work must maintain attribution to the author(s) and the title of the work, journal citation and DOI.
1. Introduction
Dopaminergic neurons (DAs) are specialized neurons tasked with dopamine secretion, which is crucial in regulation of muscle movement, and cognitive function [1, 2]. DAs are primarily located in specific regions of the brain, including the substantia nigra (SN) and the ventral tegmental area [1, 3]. These neurons can respond to extracellular excitation by activation of internal calcium signaling that lead to dopamine secretion [4–6]. A common feature of DAs (typically those projecting to the dorsal striatum and lateral shell of the nucleus accumbens) is their intrinsic 'pacemaker' activity, characterized by autonomous action potential (AP) and calcium oscillations even in the absence of external perturbations [7, 8]. These oscillations were shown to be crucial in regulating basal dopamine levels and exhibit robust frequency under various conditions and in different in-vitro and in-vivo models [9–11].
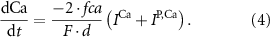
Dopamine secretion occurs when intracellular calcium ion (henceforth denoted by Ca2+) concentrations increase above a certain threshold [12–14]. The dynamics of Ca2+ are coupled to the dynamics of other ions in the cytoplasm, primarily sodium (Na+) and potassium (K+) [15, 16]. All the ionic fluxes into & out of the cell are coupled via the plasma membrane potential (MP), which modulates the activity of numerous Ca2+, Na+ and K+ channels and pumps [17]. Typically, an inward flux of Na+ is triggered due to external stimulation of voltage activated Na+ channels. The Na+ flux depolarizes the membrane, leading to an action-potential (AP) event, triggering the opening of Ca2+ channels. This creates an inward flux of Ca2+ that increases intracellular Ca2+ concentration. In response to depolarization, an inward flux of K+ ions hyperpolarize the membrane and leads to a halt in Na+ entry. The baseline ionic concentrations (and membrane voltage) are then restored through the pumping of K+, Na+ & Ca2+ against their electrochemical potential (primarily  and Na+/K+ pumps 2) in an Adenosine triphosphate (ATP) dependent manner. This tight regulation of intracellular Ca2+ is crucial to the physiological status of cells [18–20]. Thus, Na+/K+ coupled Ca2+ signaling is an energy intensive process, which constitutes up to ∼20%–50% of the cellular energy demand [21–24].
Despite the high energy demands, an important characteristic of DA neurons is that they display spontaneous AP firing and Ca2+ oscillations in-vitro and in-vivo, even in the absence of external stimulation. While most DAs show regular oscillations, perturbed DA neurons display rich dynamics of Ca2+ and AP oscillations, from quiescence, to tonic (regular), to 'bursting' (a combination of several frequencies, where the AP undergoes a period of rapid oscillations followed by quiescence) [25–27]. It is hypothesized that these spontaneous Ca2+ oscillations are crucial for the functionality of DAs, determining basal and on-demand secretion of dopamine [12, 28]. However, prolonged elevated Ca2+ concentrations may impair lysosomal motility, increases generation of reactive oxidative species, and impair mitochondrial ATP synthesis, all reducing cell viability [18–20]. Thus, regulation of Ca2+ balances the requirements of cellular function, with the constraints of cell survival. Mechanisms that rely on oscillatory calcium signals have been proposed to do just that [29, 30]. This may explain why DAs are susceptible to damage and degeneration, a common feature of several neurological pathologies including Parkinson's disease (PD) [2, 31].
Various kinetic models have been previously proposed to study Ca2+ oscillations and signaling in (DA) neurons [32–38]. Several, single-compartment models that couple the Hodgkin and Huxley model for AP generation [17] to Ca2+ dynamics have successfully captured many DA experimental observations (tonic firing, Ca2+ oscillations, response to external stimuli, pharmacological intervention etc. [32, 33, 36]). These models implicate various ion channels in facilitating Ca oscillations [39]. Other models extend the treatment to a multi-compartment system, to account for spatial organization and coupling between different regions of the cell (dendrites, soma & axons), which more realistically captures the complexities of neuronal morphology [34, 35]. While some models do take into account Na+ and K+ dynamics [38], most of these models assume constant cytoplasmic Na+ and K+ concentrations, justified by a narrow range of average concentrations observed in simulations and experiments, and the small amplitudes of Na+ & K+ oscillations when compared to these measured averages (∼0.1% change) [38]. This implies that the transient change in Na+ & K+ (∼nM scale) is negligible compared to their average concentration (>10 mM). However, fixing intracellular ionic concentrations in simulations prevents the system from evolving naturally towards its homeostatic conditions.
In this paper, we present a kinetics one-compartment, conductance-based model for isolated neurons that follows the dynamics of the MP, Ca2+, ADP, as well as Na+ and K+ over time. Our focus is not on the specific channels and pumps that facilitate Ca2+ exchange, but on the general interaction between Ca2+ and AP dynamics, and the impact on functionality (dopamine secretion). We choose a hybrid approach where we adopt most of the kinetics model described in [33], infused with several other kinetic expressions of interest from [32, 36, 40]. Crucially, kinetic expressions for the dynamics of Na+ and K+ are also included. The model captures the essential features of DA neurons' dynamics, including spontaneous firing and Ca2+ oscillation. Our results illustrated how relaxing the Na+ and K+ fixed-values approximation results in a higher tendency for spontaneous tonic oscillations, as well as a more robust oscillation frequency. We further discuss the impact of the transition from tonic to 'bursting' oscillations on the coupled Ca2+ oscillations, which encode to a broad spectrum of signals while maintaining relatively constant average calcium levels and metabolic loads.
2. Methods
2.1. Model description
Based on the works of [32, 33, 36, 40] we construct a one-compartment, conductive-based kinetic model that describes the dynamics of the MP ( ), as well as intracellular Ca2+ (
 ), Na+ (
 ), K+ (
 ), and ADP (
 ) concentrations. We consider all external ion concentrations (
 ,
,  ,
,  ) as control parameters and not variables. Ionic currents are passively conducted (according to their electrochemical potential) via several types of voltage-activated channels for Na+ (Na-VGC), K+ (K-VGC, S-K, K-ATP) and Ca2+ (L-type, T-type), and their corresponding leak channels (Na-Leak, K-Leak, and Ca-Leak). Note that the activity of the S-K and K-ATP channels also displays threshold activation in response to high Ca2+ and ADP concentrations respectively, which serve as regulators of both concentrations. These currents are counterbalanced by the activity of two pumps; the sodium-potassium pump (Na+/K+ ATPase) and a Ca pump (Ca2+ATPase), both catalyzing ATP to actively move ions against their electrochemical gradients. ATP is constantly synthesized by the cell, to facilitate this active ion transport across the membrane.
Like the original model of [33], our model inherits the characteristic compartment size  , which may be interpreted as the characteristic width of a dendrite, or a small volume in the vicinity of the somatic membrane which is well mixed in the relevant timescales of the model (1 ms—1 sec). Beyond such length scales, diffusion becomes a limiting process, and the model may need revision. Our focus here is on spontaneous oscillations & the electrical properties of isolated neurons, in the absence of external perturbations. Thus, we omit the expressions for NMDA (external stimulation) channels, which been shown to coordinate synaptic stimulation, and regulate firing pattens in DA neurons [41]. A schematic illustration of the various fluxes is presented in figure 1(A), with an analogous circuit diagram presented in figure 1(B). The kinetic expressions for the voltage-activated and leak channels currents are adopted from [33]. The kinetic expressions for the Na+/K+ and Ca pumps are adopted from [32] and were constrained to 0 at low ATP levels by adopting Michaelis–Menten kinetic scheme observed in [40]. The model parameters were adjusted to better fit physiological conditions and observed tonic frequencies, based on the works of [36, 40, 42]. The changes, and their reasoning are listed in section S1 of the SI.

Figure 1. Model description. (A) A schematic illustration of model fluxes through K (green), Na (blue) & Ca (yellow) voltage-gated channels (VGCs) with chemical activation ( ,
,  ) and without (
 ,
,  ,
,  ,
,  ), leak channels (
 ,
,  ,
,  ), Ca and Na/K pumps (
 ,
,  ), and the ATP consumption and synthesis (mitochondria). (B) An analogous circuit diagram of the model.
 represents the membrane capacitance and
  represent the Nernst potentials for
 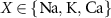 . Components are in the same order as panel (A). (www.circuit-diagram.org/editor/).
Download figure:
Standard image High-resolution imageThe dynamics of the cellular MP  are described by the following implicit equation:
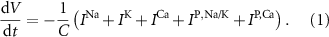
With  the capacitance of the membrane,
  ,
,  and
and  the passive currents through various ion channels corresponding to Na+, K+ and Ca2+ respectively, and
  and
and  the ATP dependent currents through the Na+/K+ and Ca2+ pumps (respectively). Each ionic variable is subjected to a kinetic equation that balances the stoichiometric ratio of ion exchange:
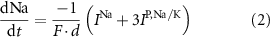
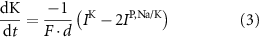
With  noting Faraday's constant,
  the compartment width (i.e.—axonal radius), and
  the coarse-grained fraction of free Ca2+ in the cytosol (i.e.—the buffering capacity due to various Ca2+ binding proteins). The kinetics of ADP turnover are described by:
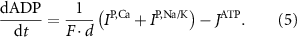
With  the ADP dependent production rate of ATP. Note that we do not consider ATP consumed by other cellular processes (i.e.—background consumption) to solely focus on the role of ATP consumption by the active transport of ions. In a sense, equation (5) stands for the turnover dynamics of the fraction of ATP allocated to maintaining ion homeostasis. ADP turnover is supplemented by the assumption of a conserved adenosine backbone concentration, i.e.—
 , with
  the total adenosine concentration. The conductance of the voltage activated channels is depicted via a Hodgkin–Huxley formalism [17, 32, 33], describing the voltage sensitivity through the dynamics of six additional gating variables: K-VGC activation (
 ), Na-VGC activation (
 ) and inactivation (
 ), L-type activation (
 ) and T-type activation (
 ) and inactivation (
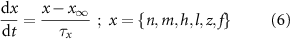
 ). The gating is described via a Hodgkin-Huxley like dynamics, with the general equation:
With  ,
,  and
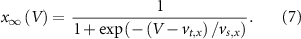
and  the threshold, steepness, and voltage dependent response time respectively for the activation (inactivation) function of each of the gating variables
  . The values of the
  ,
,  , and the expression for
  are taken from [32, 33] (see table S1 in the SI). An exception to this is the parameters associated with
  , which we modified to
  and
and  (within the range of accepted values [33, 36, 39]) to obtain spontaneous ∼1.8 Hz AP oscillations, as observed in DA neurons [7, 10, 15]. We further assume an instantaneous response to voltage changes by the
  variable by approximating,
  and thus
  [32].
[32].
The explicit expressions for the current terms are given by the following set of equations:


Here, the subscript  represents the specific variable associated with each parameter, and the superscript
  indicating the associated protein/process of (in order): VGC, passive leak, S-K channel, K-ATP channel, L-type Ca2+ channel, T-type Ca2+ channel, Sodium potassium pump, Ca pump and ATP production (see figure 1(A)).
  represent channel conductance,
  various Michaelis–Menten or Hill coefficients for threshold concentrations,
  and
and  a sigmoidal threshold and 'steepness' concentrations, and
  &
&  maximal currents and fluxes.
  stands for the Nernst potential for the i'th ion, with
  the valency,
  and
and  the extracellular concentration of the respective ion. Overall, our model includes a total of 10 ODEs, two algebraic equations, ten variables and thirty-one parameters (see table 1 for baseline values). The initial conditions for all simulations are given in table 2. For constant Na+ and K+ concentrations, we set in equations (2) and (3)
  .
.
Table 1. Model parameters.
| Parameter | Baseline value | Parameter | Baseline value | Parameter | Baseline value |
|---|---|---|---|---|---|
 (*) (*) |

| d | 10−4

|

| 1.9*10−4

|

|

| F |

|

| 4*10−6

|
 (*) (*) |

|

|

|

| 25 
|
 (*) (*) |

|
 (*) (*) | 0.02 |

| 5.5 
|
 (*) (*) |

|
 (*) (*) | 127 
|

| 3 
|

|

|

| 4 
|

| 1 
|
 (*) (*) |

|
 (*) (*) | 2 
| ||
 (*) (*) |

|

| 5 
| ||

|

|

| 0.3 
| ||
 (*) (*) | 0.006 
|

| 0.15 
| ||
 (*) (*) | 0.0013 
|

| 0.086 
| ||
 (*) (*) | 0.08 
|

| 5*10−4

| ||

| 0.1 
|
(*) used in the randomized sampling simulation around 20% from the baseline values.
Table 2. Model variables and initial conditions.
| Variables | Units | Initial condition |
|---|---|---|

| mV | −51.7 |

|

| 45 |

| nM | 35 |

| mM | 131 (*) |

| mM | 20.45 (*) |

| — | Initial values are chosen so that gating variables will have zero derivatives at time  .
(Values span from 0–1) .
(Values span from 0–1)
|

| — | |

| — | |

| — |
(*) used in the randomized sampling simulation around 20% from the baseline values.
2.2. Model analysis
We focus here only on the dynamical steady state observed at the long-time limit, where the average value of all ionic concentrations (Ca2+, Na+, K+) is approximately constant. This relaxation typically occurs over a time scale of minutes, much longer than the timescale of oscillations (seconds). This long timescale is likely due to the slow rate of ATP turnover (∼ 0.1 mM s−1). For each simulation, we let the system relax to its dynamical steady-state and analyze the emergent dynamical properties that are observed from that point onward (average frequency, average concentration, frequency range etc.- see (figure S1). Average properties are calculated by either integrating the continuous signal over time i.e.  or by summing over discrete events
  (with
(with  s).
s).
To estimate the transient AP frequency, we numerically find the peaks in the oscillatory AP, and calculate the time dependent peak-to-peak time  . The average AP frequency is then estimate by averaging the inverse peak-to-peak time
  . This is done to ensure proper characterization of the 'bursting' regime. For the apparent Ca2+ oscillations, at high AP frequencies, consecutive Ca2+ peaks may merge to form apparent slow frequency oscillations (see figures 2(E) and (F)). We therefore apply a low-pass filter, followed by a Fourier-transform (FFT) to the Ca2+ signal, then estimate the average Ca frequency
  by the mode of the power spectrum.

Figure 2. Time dependent membrane potential (A)–(C), and the corresponding Ca2+ concentrations (D)–(F) in different bursting intensities. (A), (D) Baseline conditions. (B), (E) Increased external K+ stimulus (1.8-fold change). (D), (F) Increased external K+ stimulus (3-fold change) and reduced T-type conductivity (0.5-fold change) Inset: higher resolution image of a single 'bursting' event in D. Note that the average Ca2+ is only slightly perturbed, while the signal amplitudes change dramatically.
Download figure:
Standard image High-resolution imageTo characterize the transition from tonic to 'burst' oscillations, we estimate the frequency range for the AP by calculating the difference between the minimal and maximal transient frequencies ( . A transition from quiescence (no spiking) to tonic oscillations (see figure 2(A)) is characterized by a transition from
  to
to  , and a transition from tonic to 'burst' oscillations (characterized by high frequency spiking followed by a long refractory period) is characterized by a change from
  to
to  (see figures 2(B) and (C)).
3. Results
3.1. Sodium and potassium dynamics underlie robust oscillations
To study Ca2+ dynamics in DA neurons, we construct a one-compartment model based on the Hodgkin and Huxley conductive model and introduced the dynamics of various ions (Na, K, Ca), as well as ATP consumption (figure 1). Since our focus is dynamical properties (frequency, amplitude, range) that emerge from the model dynamics, it is useful to set up baseline conditions for comparison. Figure 3 shows in blue the dynamical steady state for the baseline conditions (depicted by the parameters and initial conditions in tables 1 and 2). Under these conditions, the system displays periodic AP firing events (figure 3(A)), which drive periodic Ca2+ oscillations with a similar frequency of ∼1.8 Hz (figure 3(B)). The average Ca2+ concentration is ∼100 nM (dashed line), comparable to that observed in experiments [31, 43], which has minimal chances of triggering Ca-dependent apoptotic mechanisms [31]. Since the AP firing is periodic, energy levels (indicated by ATP/ADP ratio, figure 3(C)) and Na+ & K+ levels (figures 3(D) and (E)) also oscillate with the same frequency. However, the amplitude of Ca2+ oscillations is relatively large (∼30 nm, or ∼30% the average value) compared to the amplitudes of Na+, K+ and ATP/ADP (<1% the average values for all simulations presented in this paper). This indicates that Ca2+ levels are much more likely to temporally encode to different functionality, as most enzymatic processes are less likely to be sensitive to slight changes to average values. We also show in figure 3 in red a simulation where Na and K dynamics are removed (equations (2) and (3) set to zero), and the system is fixed at the average concentrations obtained from the late times of the baseline simulation. Indeed, the apparent frequency, average and amplitude of Ca2+ oscillations seem remarkably similar to the case with Na+ and K+ dynamics included, seemingly suggesting that the models are roughly identical at the long time-limit. However, while in the latter case intracellular Na+ and K+ levels are imposed upon the system artificially (while in experiments these are rarely known a-priory), for the former these naturally evolve to homeostatic levels from the dynamics.

Figure 3. Time evolution of simulation of baseline conditions (tables 1 and 2) at long times (last 5 sec of a simulation). (A) The membrane potential (bottom) and the instantaneous frequency estimated from it as the inverse of the peak-to-peak time. (B) Free Ca2+ concentration. (C) ADP to ATP ratio. (D) Intracellular sodium concentration. (E) Intracellular potassium concentration. Color indicates either simulation with fixed (red) or dynamically changing (blue) sodium & potassium levels, with average values shown in dashed lines.
Download figure:
Standard image High-resolution imageIn addition to the tonic oscillation regime, our model is also capable of producing a 'bursting' regime, where several AP events occur in succession, followed by a relatively long refractory period (see figures 2(B) and (C)). This 'bursting' behavior is coupled to an increase in Ca2+ influx (figures 2(E) and (F)). The slow dynamics of Ca2+ cycling relative to those of the AP cause successive Ca2+ peaks to merge for dense enough AP events, causing a significant increase to Ca2+ amplitudes and an emergence of 'apparent' slow Ca2+ oscillations (figure 2(F)). This behavior is consistent with observations made by previous models [9, 33, 43]. It has been shown that bursting events are associated with an increased dopamine secretion, which is mediated by elevated Ca2+ levels [44]. Thus, while we do not model dopamine secretion explicitly, we assume that 'bursting' behavior is a good proxy for increased secretion. Indeed, 'bursting' may be triggered by a change to a variety of model parameters (see below), and is thus a property of interest for cellular function.
The flexibility to evolve into homeostatic conditions dramatically impacts the emergent properties of the model, as shown in figure 4. There we compare simulations of multiple systems, with parameters randomized around the baseline conditions (up to 20% deviation from their baseline values), with or without Na+ & K+ dynamics. The randomization of model parameters represents both variability of expression profile between cells, as well as variability in experimental conditions (thus we simulate an ensemble of 'cells'). Each mark on the 2D scatter plot represents an emergent property for a single set of randomized model parameters, with fixed (x-axis) or dynamically varying (y-axis) Na+ & K+. When including K+ and Na+ dynamics, the system relaxes to different, homeostatic steady-state values of K+ and Na+ each iteration, instead of maintaining the initial concentrations (as is the case for simulations with fixed concentrations, see figure S1 for several examples). As can be seen, the average AP frequency has a much narrower distribution around the mean baseline value for the case where Na+ and K+ evolve dynamically, compared to when their concentrations are fixed (figure 4(A)). Moreover, in most of the simulations without K+ & Na+ dynamics, the systems are quiescent (no oscillations at all), as indicated by the peak of the distribution around  . This implies that letting Na+ and K+ evolve to homeostatic conditions allows for a much more robust AP firing, which may overcome biological variability. This would be crucial for the cell to operate under noisy conditions if the frequency of oscillations encodes activity. Indeed, the average Ca2+ concentrations (which are coupled to the AP triggering) are much more conserved for the case of dynamically varying Na+ & K+ (figure 4(B)). This benefits cells in terms of viability, as a narrow range of average Ca2+ levels, should reduce the risk of accidental triggering of Ca2+ related cell death [31]. Likewise, calcium frequency is also much more robust (figure 4(C)), and greatly resembles the average AP frequency suggesting that calcium kinetics constrain the AP events. Additionally, calcium amplitudes are also more robust, and relatively low, in the case of dynamically varying Na2+ & K+ (figure 4(D)), again favoring cell viability. The long tail in the distribution of Ca2+ amplitudes is likely due to spontaneous 'bursting' dynamics (i.e.—an increase in the frequency range
  ) that positively correlates with the amplitude (see figure S2(B) in the SI). Since higher Ca2+ amplitudes are associated with increased dopamine secretion [4, 5], this suggests a system with dynamically varying Na+ & K+ is more fitting for 'on demand' triggering of dopamine secretion by stimulation of bursting (see below), since it is less likely to display 'bursting' spontaneously. This suggests a more robust functionality in response to perturbations. Indeed, the distribution of the frequency range
  is much wider for the case of fixed Na+ & K+ (figure 4(E)).
  average concentration and Nernst potential display a narrower distribution when
  levels are allowed to evolve dynamically, indicating that the dynamical system works to maintain a homeostatic
  concentration even under parameter perturbation (figures 4(F) and (G)). While average K+ levels and Nernst potential seem to show the same sensitivity to parameter perturbations both with and without the Na+ & K+ dynamics, it is mostly due to the linear dependence of average K+ in the initially imposed intracellular and extracellular concentrations. (figures 4(F) and (G)). Including the dynamics allows for the average K+ concentrations to stabilize in a range of a few millimolar around the initial conditions (reflected by the spread of points around the linear trend in figures 4(H) and (I)), which mirrors the homeostatic effect on Na+ due to the dynamics. Moreover, unlike other model parameters, changing extracellular K+ affects the average frequency of oscillations considerably (see figure 5(D) below). This illustrates that extracellular K+ levels drive electrical activity more when compared to other ions, in line with experimental protocols that utilize changes to extracellular K+ to induce electrical activity [45, 46]. Therefore, including Na+ and K+ dynamics is essential to ensure ion homeostasis, constrain ions concentration and ensure more robust functionality and viability.
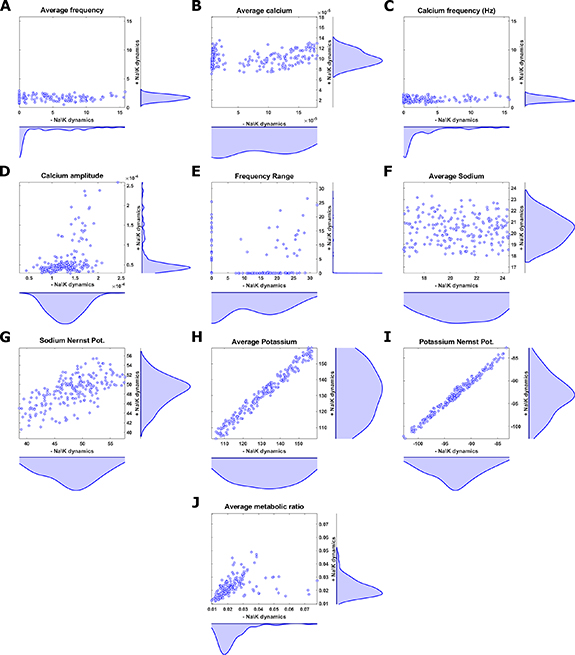
Figure 4. Scatter plots with marginal histograms comparing simulations with (vertical) and without (horizontal) Na+ and K+ dynamics. (A) Average AP frequency (ωAP), (B) the average calcium, (C) calcium amplitude (D) apparent Ca2+ frequency (E) frequency range ( ) (F) average Na+ (G) average Na+ Nernst potential (
 ) (H) average K+ (I) average K+ Nernst potential (
 ) (J) average metabolic ration (ADP/ATP). The data is generated by simulating the system with a random sampling of the Na, K, voltage-gated channel conductivity (
 ,
, ), L-type and T-type calcium channel conductivities (
 ,
,  ), S-K and K-ATP channels conductivities (
 ,
,  ), the initial intracellular and extracellular concentrations of Na, and K (
 ,
, ,
, ), extracellular Ca concentration (
 ), free Ca fraction (
 ), maximal Ca and Na/K pump currents (
 ,
,  ) and ATP synthesis rate (
 ). All parameters are randomly varied within 20% of their baseline values (tables 1 and 2).
Download figure:
Standard image High-resolution image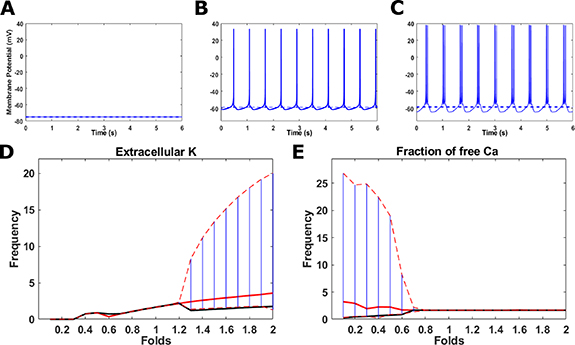
Figure 5. Top: examples of the model's three distinct dynamical behaviors, (A) quiescence, (B) tonic firing, and (C) burst firing. Bottom: bifurcation diagram as a function of a fold change to baseline conditions for (D) extracellular K concentration ( ), and (E) Fraction of free Ca (
 ) as a function of fold change to the baseline parameter value. All simulations include dynamical evolution of Na+ K+ (equations (2) and (3)). Average AP frequency is shown in a solid red line, maximal and minimal instantaneous frequencies in dashed red lines, apparent Ca2+ frequency in a solid black line, and the frequency range are illustrated in a vertical blue line.
Download figure:
Standard image High-resolution image
3.2. DA neurons are operating close to 'bursting' criticality
As stated above, including Na+ and K+ dynamics not only facilitates oscillations with a robust average frequency, but also makes the system more tunable by facilitating 'bursting' dynamics. To explore the transition between different regimes of oscillations, we continuously vary the value of a single model parameter each time, while maintaining all other parameters fixed, and evaluate the long-time frequency behavior. Figures 5(A)–(C) show representative AP signals of three distinct dynamical regimes; quiescence (no oscillations), tonic (single frequency), and 'bursting' (two distinct frequencies), respectively. By varying either extracellular (ionic strength) or intracellular (channel and pump activity) properties, one can seamlessly transition between the three regimes. Two exemplifying bifurcation diagrams are presented for the effect of extracellular K+ ( ) (figure 5(D)) and intracellular Ca2+ buffering (
 ) (figure 5(E)) on oscillations. Both parameters are tightly associated with the dynamics of ion turnover. The former affects firing dynamics by altering K+ Nernst potential (
 ), which is directly proportional to the flow of ions through the various channels (see equation (10)), as well affecting the rate of the Na+/K+ pump (equation (10)). The latter the firing dynamics via the rate of Ca2+ turnover in the cytoplasm (see equation (4)). The transition from quiescence to tonic oscillations is characterized by a change in the average AP frequency from
  to
to  (solid, red line). Such a transition is observed where
  its baseline value, indicating that extracellular K+ can drive electrical signaling, in line with common experiments on driving AP in neurons [45, 46]. Similarly, the transition from tonic to 'bursting' oscillations is characterized by a change in the AP frequency range from
  to
to  (dashed, red lines). Such a transition is observed when
  , or when
  their respective baseline values, as indicated by the bifurcation from a single frequency to two distinct slow and fast frequencies. Our analysis shows that similar 'bursting' bifurcation occurs when various parameters associated with Na+, K+ and Ca2+ cycling are perturbed (see figure S3). Moreover, many 'bursting' transitions occur for relatively small (∼ 40%) perturbations around the baseline conditions. Indeed, various in-vitro experiments show that for similar conditions or perturbations, DA neurons may display either tonic or 'bursting' oscillations [33, 47–49], and altered firing patterns have been observed in different PD animal models in various stages [50]. This implies that the system is designed to operate in near critical conditions, which emphasizes the mechanical importance of 'bursting' to the functionality of DA neurons.
3.3. Coupled calcium and AP 'clocks' underlie 'bursting' dynamics.
The apparent transition from tonic to 'bursting' oscillations observed in our system is reminiscent of the transition from synchronous to asynchronous oscillations in a system of spontaneous, coupled oscillators [51–53]. Indeed, numerous systems in biology display self-oscillations and synchronization, including Ca2+ waves in oocytes, electrically interacting neurons, rhythmic gene expression, elastically interacting cardiomyocytes & more [54–57]. Common to all these are interacting 'clocks' with slightly different apparent frequencies. This implies that our system comprises (at-least) two 'clocks' with distinct frequencies. At baseline conditions, the mismatch between the two frequencies is small, and the coupling is strong enough to facilitate synchronization. When the baseline conditions are perturbed (i.e.—when model parameters are varied), the difference between the two frequencies becomes larger, to the point where coupling becomes too weak to maintain synchronization, and the system displays 'bursting'. Our bifurcation analysis indicates that varying model parameters change the intrinsic frequencies of the two 'clocks' (figures 5(D), (E) and S3), since the frequency range tends to increase with parameter variation in numerous cases. We hypothesize that in our system, an AP 'clock' and a calcium 'clock', are coupled via the MP. Figure 5 shows the AP and Ca2+ levels for a set of simulated conditions close to the bifurcation point (where external stimulus with K+
 and T-type channel conductance
  are varied). We observe that during the 'bursting' transition, AP events 'densify' to form a period of closely packed AP events, separated by a long refractory period (figures 5(A)–(C)). The high frequency between AP events in the packet period correlates with the upper branch in the bifurcation diagram, indicating that the fast frequency corresponds to the AP 'clock'. Similarly, during the same transition, Ca2+ oscillations initially increase in frequency and amplitude. However, once AP are packed close enough, Ca2+ peaks merge together to form apparent, low frequency oscillations with much higher amplitudes (figures 2(C) and (F)). Overall, the average Ca2+ remains relatively constant during 'bursting', while the apparent Ca2+ amplitudes correlate with increase in frequency range (figures S2(A) and (B)). This merging of peaks is due to the slow Ca2+ excursion from the cell via the Ca2+ pumps, compared to the fast activity of the voltage-gated channels. When plotted on the bifurcation diagram, the apparent Ca2+ oscillation frequency (solid, black line in figure 5) correlates with the lower branch of the bifurcation diagram, indicating that the slow frequency corresponds to the calcium 'clock'. These slower oscillations, with higher, apparent amplitudes, translate to a higher probability for transient dopamine secretion, while maintaining relatively constant 'background' calcium levels (which may otherwise interfere with other metabolic processes). Thus, calcium signaling (and hence dopamine secretion) is largely controlled by the transition from tonic to 'bursting' AP oscillations.
4. Discussion
In this paper we describe a mathematical model for calcium oscillations in DAs. Our model builds on the work of Regs. [32, 33, 36], and describes the kinetics of voltage activated Na+ and K+ channels, coupled to the voltage sensitive L-type & T-type Ca2+ channels. Unlike previous models, we relax the assumption of constant Na+ and K+ concentrations. By fixing the Na+ & K+, the system is essentially 'locked' to the initial conditions imposed on it. Removing this limitation allows the system to regulate the ionic currents, mainly through sodium regulation of Na/K pump, and altering the driving force for ionic transport across the membrane through the K+ & Na+ Nernst potentials. The ionic concentrations then naturally evolve towards the cell dictated homeostatic values (i.e.—weak amplitude oscillations in K+ and Na+ concentrations, around a relatively robust average stead-state value, see figures 3(D) and (E)), and are not stuck in the imposed initial conditions. The result is a very robust AP oscillation frequency (see figure 4(A)), that is only weakly dependent on perturbations to various channel conductance, initial conditions, and ATP synthesis. Thus, the average frequency is likely determined by of the activation/deactivation dynamics ( ) and its associated parameters, which are intrinsic to the structure of the various channels, and not necessarily to their density on the membrane. In contrast, when both ion concentrations are fixed, the system displays a much wider range of apparent AP frequencies, all strongly dependent on the conductance of the different channels. The frequency range (which is a measure of the tendency to produce 'bursting' oscillations) is also strongly perturbed by modulations of conductance when Na+ and K+ are fixed but varies considerably less under similar perturbations when Na+ & K+ are allowed to evolve dynamically to their average, homeostatic concentrations (see figure 4(E)). These conserved dynamical properties coincide with the more robust
  average concentrations and Nernst potentials, when
  and
and  are free to evolve, suggesting a possible link of these properties. All the above demonstrates that Na+ & K+ dynamics are crucial to maintain robust tonic oscillations and allow for a much more tunable system by constraining spontaneous 'bursting' oscillation.
The observed Ca2+ oscillations in the 'bursting' regime typically display higher Ca2+ amplitudes, and longer Ca2+ transients, while maintaining a relatively constant average value. Given the threshold activation of the dopamine secretion cascade, we hypothesize that the 'bursting' transition encodes higher dopamine secretion. The significant advantage of such an encoding method (unlike an equivalent increase in tonic frequency) is that sequential triggers of Ca2+ increase may build upon one another to increase Ca2+ amplitudes with little change to average background levels (see figure 2). This implies that although AP events drive Ca2+ oscillations, the latter may also constrain the former (as evident by the long refractory period). The results of a sensitivity analysis we performed reinforce this notion and demonstrate that while the AP frequency is strongly affected by K+ and Na2+ levels, it is also considerably affected by parameters related to Ca2+ circulation (such as L-type & T-type currents, calcium buffering and maximal Ca2+ pump current) (see section 2 and table S2 in the SI). Ion cycling is estimated to cover ∼ 20%–50% of the energy consumption of the cell [21–24] and being able to encode to a different functionality without increasing energy requirements may make the system much more reliable. Interestingly, our analysis shows that while relatively small perturbations for the activity of ion pumps and channels cause significant changes to dynamics of the system (frequency range), the overall ATP/ADP levels (indicative of energy demand) remain roughly unchanged and are not correlated with 'bursting' (see figure S2(C) and table S2). This translates to a range of  and
and  mM. One can appreciate that changes to ATP levels are negligible, while ADP can change up to ∼2-fold its baseline concentration (∼
  ). This is reflected by the almost identical impact model parameters have on the ADP/ATP ratio compared to the average frequency (see table S2 in the SI). Moreover, maintaining the system close to 'bursting' transition (i.e.—bifurcation) suggests that the cellular conditions are tailored to allow for increased dopamine secretion 'on demand' (i.e.- modulation of effective Ca2+ frequency, see table S2). Thus, in addition to robustness, the system displays flexibility, crucial for quick adaptation to externally imposed conditions. Indeed, DAs in the SN are key regulators of dopamine secretion, which greatly relies on both robustness and flexibility to ascertain proper function. We suggest that this 'bifurcation proximity' may be amongst the properties impaired in PD afflicted neurons, causing additional reduction in functionality. Future experimental studies investigating tonic to burst oscillations in both control and PD DA neurons are necessary.
The roles of specific channels in regulation of spontaneous AP firing and its coupling to Ca2+ signals can also be studied via the bifurcation diagrams of figures 5 and S3, and the sensitivity analysis presented in table S2. For K+ channels, the K-ATP channel has been implicated in regulation of firing in DA under conditions of metabolic stress [33, 58], and the S-K channel activates in conditions of high cytoplasmic Ca2+ [32, 48, 59]. Interestingly, our analysis suggests that K-ATP weakly affects the average firing rate (figure S3(M)) with little to no effect on the tendency to 'burst', or the other aspects of Ca2+ oscillations (table S2). This is likely due to the relatively high activation threshold of ADP concentration ( , compared to the
  ADP concentration observed in our baseline conditions). It might be that K-ATP has evolved to activate when the metabolic load is much more extreme, in order not to interfere with the spontaneous, tonic oscillations required for basal DA activity. K-ATP may have a much more dominant impact on the dynamics when these are subjected to external stimulus by other cells through NMDA activity, as it may constrain the ability of the system to match an externally applied pacing signal. Likewise, the SK channel show little to no impact on any of the dynamical properties studied (figure S3(K) and table S2), again likely due to the steep activation threshold in Ca2+ (
 ), which is above the Ca2+ levels observed in our simulations. This is in contradiction with works which demonstrate that blocking SK contributes to initiation of 'bursting' [60, 61]. It is possible that the S-K channel caps Ca2+ oscillation amplitudes in more extreme conditions, or that the threshold sensitivity chosen for our model is inaccurate. For the calcium channel, it is quite apparent that the L-type channel has a much stronger impact on the dynamics of oscillations and 'bursting' compared to the T-type channel (see figures S3(C), (L) and table S2), even though the latter has a maximal current which is an order of magnitude higher [4]. This is likely because T-type channels are activated at higher membrane hyperpolarization (
 ), above what we observe in our simulations. This suggest that T-type Ca2+ currents are secondary to the current through the L-type channel. Other channels that facilitate a calcium influx, such as the N-type and P/Q-type, as well as different subtypes of the L-type channel such as CaV 1.2 and CaV 1.3, have also been suggested to play a role in modulating firing in DA neurons [4, 62, 63]. All these have different voltage activation/inactivation threshold and may interact to modulate the firing frequency in complicated manners beyond the scope of this work. However, all of these serve as voltage gated calcium influx facilitators, and thus share a similar role to the L-type or T-type channels in our model (i.e.—coupling Ca2+ dynamics to K+/Na+ via the voltage). Thus, as long as a voltage dependent influx of calcium exists, we expect our results to remain qualitatively the same (i.e.—robust average frequency and proximity to 'bursting' transition). Interestingly, numerous channels have been shown to share the same functionality, and have overlapping conductance and voltage dependence, which implies built in redundancy on the molecular level that serves as another source of robustness [64–66]. Indeed, it was previously suggested that regulation of the expression profile of various channels is executed to maintain the electrophysiological activity at a desired level [67]. This regulation of expression may be mediated via calcium sensors, and occurs on time scales much longer than those considered in our model (tens of minutes). However, it is difficult to assess exactly 'how' a cell maintains proximity to the bifurcation point, and more difficult to speculate which mechanisms are impaired in PD that result in drifting away from it. Specific mutations, interaction with misfolded protein aggregates (α-synuclein), and changes to expression of various channels may be involved in PD pathology [2, 62, 68]. Changes to the buffering capability of Ca2+ may also be implicated in PD failure, as well as reduction in ATP availability [69]. Most likely, it is the combination of several of these factors that impairs the ability to altar dopamine secretion through bursting transition as we speculate here.
During the transition from tonic to bursting oscillations, the system undergoes a bifurcation into two distinct oscillation frequencies, with the upper branch (high frequency) correlative with the typical peak-to-peak time of sequential AP events, and the lower branch (lower frequency) correlative with the frequency of the apparent coarse-grained Ca2+ oscillations (where several calcium peaks merge to form a low frequency wave-form). This behavior is indicative of two coupled, spontaneous oscillators ('AP clock' & 'calcium clock') that transition from full synchronization (tonic oscillations) to phase-slip or incommensurate oscillations ('bursting') [51–53]. These apparent oscillations have a frequency similar to the basal frequency (albeit slightly lower), suggesting that the basal frequency is indeed due to the slow calcium kinetics. The result is that while the AP clock drives calcium oscillations, the 'calcium clock' also limits the AP frequency from diverging. We can draw here an analogy to the classical observation by Huygens, of two pendulum clocks mounted on a beam, which synchronize their motion. Broadly speaking, synchronization depends on the strength of the coupling (i.e.—the 'stiffness' of the beam), the amplitudes and frequencies of the oscillators (i.e.—the 'mass' and 'length' of the pendulums). The two clocks remain synchronized if the coupling strength is strong enough, and the difference between the autonomous frequencies of the clocks is small. For the classical case studied by Adler, this is manifested by a dimensionless criterion for synchronization Q ∼ fs /Δω > 1 [54, 70]. One can see that Q can be reduced below unity by either reducing the coupling strength between the clocks (fs), or by increasing the mismatch between the spontaneous oscillation frequencies (Δω), both expected to push the system towards the 'bursting' transition. Albeit more complex, our system can be thought of as two spontaneous oscillators (AP & Ca2+) coupled to each other (via the membrane voltage). Changing the kinetics of various pumps and channels is translated to a change to the spontaneous frequency of each of the clocks, to the point that may affect the tendency to synchronize. A strongly synchronized system has a reduced tendency to create 'bursting', which in turn impairs cell functionality (dopamine secretion). It is worth noting that ours is a 'clean' analogy, which coarse grains over the many details and parameters of the model. The clear distinction of what parameters are exclusively associated with either of the clocks is difficult to make, since both are coupled by, and affect the voltage. For example, while Na+ current does not depend directly on Ca2+ (equation (8)), it does depend on the membrane voltage, whose dynamics do depend on calcium cycling, even if to a lesser degree (equation (1)). Thus, some parameters that seem to be exclusively associated with Ca2+ (for example,  ) may indirectly affect properties of
  or
or  fluxes. Regardless, our newly found understanding of the 'two coupled clocks' system may help shed light on the results of recent clinical studies [71]. One example of this is the inhibition of L-type Ca2+ channel, which was proposed by numerous studies as a way to increase the viability of damaged DAs by blocking Ca2+ induced apoptotic mechanisms [10, 31, 72, 73]. While in-vitro studies were promising in terms of cell survival, clinical studies showed little to no effect on PD progression [71]. Our analysis shows that inhibition of L-type Ca2+ channel activity (by reducing
  in our model) not only reduces average Ca2+ levels, but also reduces Ca2+ transient amplitude, as well as pushes the system away from the 'bursting' transition, i.e.—reduces the frequency range (see figure S3(C) and table S2). Thus, we suggest that while the cells may survive longer, their function is impaired in a manner that limits 'on demand' dopamine secretion, effectively nullifying the benefits of treatment. We propose that a well-designed treatment should consider not only increasing 'viability', but also conserving 'functionality'. This can be achieved by a more comprehensive study of the system, and exploring the trends of 'bursting' bifurcation, frequency, and amplitude of Ca2+ oscillations (see table S2).
Experiments usually attribute the observed Ca2+ oscillations in neurons to the activity voltage gated membranal calcium channels (L-type, T-type, N-type, P/Q-type) [74–76]. Analogous systems (such as spontaneously beating cardiomyocytes) generate calcium oscillations through exchange of cytoplasmic calcium with intracellular storage such as mitochondria, the Sarcoplasmic (SR) or endoplasmic (ER) reticulum [77]. It is therefore quite possible that calcium pumps and channels lining the internal storage (SERCA, RyR, IP3 receptor, mitochondrial calcium channels etc.) take part in calcium regulations in neurons. These internal stores of Ca2+ either serve as buffering reservoirs for excess calcium, or modulate average calcium levels, which in turn may drive cells towards quiescence [78, 79]. While caffeine and ryanodine induced ER Ca oscillations have been observed in neurons, these fall in the category of stimulated oscillations, and not spontaneous oscillations that are the focus of our study [79]. Additionally, the ER and SR is not uniformly distributed in the cell, which is at odds with the 'well mixed' nature of our model, and will require consideration of spatial effects outside the scope of our model.
In summary, we show that relaxing the assumption of constant Na+ and K+ concentrations leads to rich dynamics of AP and Ca2+ oscillations. Compared to the fixed case, the average frequency of oscillations (i.e. the average number of peaks over unit time) becomes much more robust to perturbations, and less prone to display spontaneous 'bursting'. During 'bursting,' the system alternates between two dominant frequencies (fast for the AP and slow for Ca2+). We suggest that under such conditions, encoding to different Ca2+ oscillations, and thus to different levels of dopamine secretion, may become more flexible, increasing 'on demand' dopamine secretion while avoiding a dramatic increase to average Ca2+ levels. This demonstrates that the underlying principles of robustness and flexibility are engrained in the functionality of DAs. It is worth noting that our one-compartment model largely fits dopamine local secretion in the dendritic tree, and not necessarily secretion from the terminal. A spatial extension of our work may include coupling several such compartments sequentially to mimic propagation of signal along the dendritic tree [37]. This may be used in the future to study spatio-temporal calcium phenomena such as traveling waves, compartmental synchronization and more.
Acknowledgments
We would like to thank Charles Cohan, William Loging, Gaetan Delcroix and Iggy Press for their comments and useful discussion.
Data availability statement
The data cannot be made publicly available upon publication due to legal restrictions preventing unrestricted public distribution. The data that support the findings of this study are available upon reasonable request from the authors.
Conflict of interest
The authors declare no competing interests.
Author contributions
H K & O C designed the study and wrote paper. H K coded the simulations. H K & O C analyzed the results.
Supplementary data (2.2 MB DOCX)