Abstract
Based on the experimental evidence that translating ribosomes stabilize the mRNAs, we introduce and study a theoretical model for the dynamic shielding of mRNA by ribosomes. We present an improved fitting of published decay assay data in E. coli and show that only one third of the decay patterns are exponential. Our new transcriptome-wide estimate of the average lifetimes and mRNA half-lives shows that these timescales are considerably shorter than previous estimates. We also explain why there is a negative correlation between mRNA length and average lifetime when the mRNAs are subdivided in classes sharing the same degradation parameters. As a by-product, our model indicates that co-transcriptional translation in E. coli may be less common than previously believed.
Export citation and abstract BibTeX RIS

Content from this work may be used under the terms of the Creative Commons Attribution 3.0 licence. Any further distribution of this work must maintain attribution to the author(s) and the title of the work, journal citation and DOI.
1. Introduction
In the process of gene expression, mRNAs are constantly transcribed from DNA and translated by ribosomes into proteins. Both the amount and the type of proteins expressed in a cell are crucial for its survival and its capacity to respond to changes in the environment. Regulation of transcription is one of the basic mechanisms that controls the expression level of the proteins [1]. It has been found, however, that several post-transcriptional mechanisms play a substantial role in the regulation of gene expression [2]. At the level of translation, regulation occurs by modulating the rate of protein synthesis, mostly through the control of translation initiation [3–5]. In particular, in prokaryotic cells, mRNA degradation is a powerful mechanism able to strongly and quickly reduce the number of mRNA transcripts and thus control the amount of proteins produced in the cell.
Some dynamical aspects of translation have been previously described in the framework of a mean-field model [6, 7], which revealed that both the type of degradation and the timescale associated with it influence the rate of protein synthesis. A number of previous studies [8–11] have also included mRNA degradation as a factor influencing protein synthesis. However, in all of these studies, the general approach was to assume an exponential lifetime distribution of the mRNA—thereby ignoring the complexity of degradation.
Experimentally, the amount of non-degraded mRNAs is measured in mRNA stability assays at different time points after the inhibition of further transcription [12–14]. An alternative procedure is based on the measurement of the decreasing number of pre-existing, unlabeled mRNA molecules after the introduction of metabolically labeled nucleotides [15, 16]. The resulting experimental decay patterns are conventionally analyzed by fitting the data to an exponential decay curve. In those cases where the data led to a poor fitting result, the data were either discarded or another fitting function—such as a double exponential—was assumed [14, 17]. Even though such a more complex function might improve the quality of the fitting procedure, it is quite unsatisfactory because it does not provide additional insight into the underlying mechanism of degradation.
In all organisms, specific ribonucleases are responsible for the degradation of the mRNAs. In particular, in E. coli the enzyme RNase E and its homologues are believed to initiate the main pathway of mRNA degradation [18]. The action of RNase E consists of cleaving the bond of two adjacent nucleotides of an mRNA. Once this has been accomplished, a series of further steps including exonucleolytic digestion and endonucleolytic cleavage follows. Since the subsequent steps are fast [18], it is the initial cleaving step that determines the stability of mRNAs.
The activity of the ribonucleases is, however, not independent of the translational state of the mRNA. It was shown experimentally that when the mRNA is well covered by ribosomes, mRNA stability is dramatically enhanced [19–21] because the coverage by the ribosomes shields the mRNA from the action of the endonucleolytic enzymes such as RNase E. Moreover, ribosomal coverage of mRNA is itself a time-dependent process. It takes indeed a certain amount of time until the whole mRNA is covered by ribosomes and a stable polysome is built [6, 22, 23]. During this period of time, which may be affected by the degree of co-transcriptional translation, the stability of the mRNA must change with time.
This time-dependent built-up of polysomes and its effect on the degradation mechanism were not considered so far as a factor capable of influencing the decay curves in mRNA stability assays such as those presented in [12, 14]. In this paper, we develop a theoretical model of mRNA shielding by ribosomes and apply the model to fit experimental data about mRNA decay in E. coli. Our model is relevant for genes that are regulated primarily via the endonucleolytic initiation of mRNA degradation, such as those described in [18]. The essential feature of the model is to assume that there are two basic degradation rates. One rate is proportional to the fraction of the mRNA covered or shielded by the translating ribosomes and one rate is proportional to the remaining, unshielded fraction of the mRNA.
2. Models and methods
In this section, we start by recalling some recent developments in the theoretical description of mRNA degradation and then introduce our model of ribosomal shielding. Finally, we briefly explain the method of simulating translating ribosomes as an exclusion process.
2.1. Review of modeling background
In [24, 25], we have developed a general theoretical description that includes both the stochasticity of the transcription process and the random nature of degradation. As described in [25], our theory assumes that each species of mRNA is generated with a constant rate up to time point t = 0, at which transcription is interrupted. It was further assumed that the system had reached a steady state before this interruption, which implies that each mRNA species can be characterized by an average number Nr(t = 0) of molecules. While this average value depends solely on the rate of transcription and the average lifetime of the mRNA, the decay pattern that follows the interruption of transcription is highly sensitive to the nature of the degradation process [25]. From a single-molecule point of view, the degradation process determines the distribution ΦU of the random lifetime U of each mRNA. After a time interval Δt, the relative number of mRNA, denoted by Λ(Δt), is then obtained via

where ΦU(t) denotes the probability that the lifetime of an mRNA is shorter than t. The average lifetime 〈U〉 is defined as

whereas the half-life t1/2 follows from

and gives the time, after which the amount of mRNA is decreased by half relative to the steady state amount at t = 0.
In [25], we have shown that a specific degradation mechanism implies a certain form of the lifetime probability function ΦU. Any such mechanism can then be validated by comparing equation (1) with experimental decay data. The simplest conceivable mechanism assumes that mRNA degradation can be described by first-order kinetics. This naïve assumption leads to a lifetime probability function that has an exponential form with a constant degradation rate ωdeg as given by

In general, the degradation rate constant ωdeg is proportional to the concentration of the degrading enzymes, but it may also contain sequence-dependent effects such as the biochemical affinity to the enzymes. Therefore, the rate ωdeg may be different for each mRNA species and, if equation (4) correctly described the degradation process, ωdeg could be determined by comparing equation (1) to experimental decay patterns. The theory presented here abandons the assumption of first-order kinetics, which leads to equation (4), and derives the lifetime distribution ΦU(t) from explicit assumption about an age-dependent degradation rate.
2.2. Ribosome shielding and age-dependent degradation rate
A process known to influence the stability of mRNA is the size of the polysome [19–21, 26, 27]. In the process of translation, ribosomes bind to the initially untranslated (or naked) mRNA and start translation, thereby translocating the mRNA one codon at a time. The first ribosome translating a given mRNA molecule will eventually reach the stop codon after a certain time tL. If we exclude fluctuations, then the time tL is determined by the ratio of the sequence length L of the mRNA and the average elongation rate v of the ribosomes, i.e., tL = L/v. Thus, only after this time lap, the mRNA can be seen as fully covered by ribosomes. Hence, when the age of the mRNAs is smaller than tL, the mRNA segment downstream of the leading ribosome is not covered by ribosomes [6, 7]. Note that in bacteria it is possible that ribosomes bind to the mRNA prior to the completion of transcription [28]. In these cases, the time span between the end of transcription and the full coverage would be smaller than tL. In section 3 we will further discuss this possibility.
The transient ribosomal coverage of an mRNA becomes important when degradation is primarily determined by endonucleolytic attack, such as in many bacteria [18], because the ribosomes would make it more difficult for the degrading molecules to bind to the mRNA [21]. In these cases, the degradation rate is thus not constant during the lifetime of an mRNA but changes according to its age until the ribosomal coverage has reached the steady state, see figure 1.
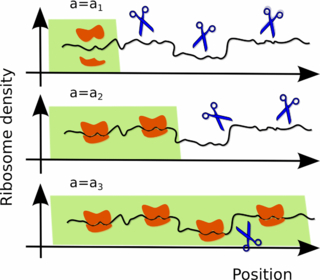
Figure 1. Age-dependent shielding of mRNA by ribosomes. (top row) The nascent chain is initially not protected by ribosomes and it is therefore more vulnerable to endonucleases, represented here as scissors. Once the process of translation has started, the ribosomes move along the mRNA and a larger fraction of the mRNA is (partially) shielded. Only after a transient time tL the entire chain is covered by ribosomes and hence less vulnerable to endonucleolytic degradation. The portion of the mRNA covered by the ribosomes (green stripe in the cartoon) is attacked by the degrading enzymes with a rate ω2 per unit length, whereas the portion not yet covered by the ribosomes is degraded with a rate ω1 per unit length. The colored portion increases with the age a of the mRNA and the effective degradation rate interpolates between ω1 and ω2 according to equation (5).
Download figure:
Standard image High-resolution imageTo model this phenomenon, we assign (i) a degradation rate ω1 to the more vulnerable, unshielded segment of mRNA downstream of the leading ribosome and (ii) a second rate ω2 to the partially covered segment of mRNA upstream of the leading ribosome. The effective degradation rate of the mRNA depends therefore on the relative size of each segment and evolves from the initial value ω1 to a final value ω2. This leads to an effective, age-dependent degradation rate

with a being the age of the mRNA. Non-constant failure rates are widely known in stochastic modeling and are referred to as hazard rates in the literature [29]. They are related to the lifetime probability distribution via

which, once inserted in equation (1), provides the decay pattern of the mRNA as a consequence of the postulated mechanism of the age-dependent degradation rate [25].
2.3. Computer simulations with growing polysomes and mRNA degradation
Both for the mRNA segment that is covered and shielded by ribosomes and the mRNA segment that is still naked and untranslated, degradation is mediated by the same endonucleolytic enzyme. It is therefore natural to expect that the two rates ω1 and ω2 are interrelated and to assume that the shielding effect is proportional to the ribosomal coverage ρ, thus implying

Experimental results about the polysome size in different species [4, 5, 30] indicate that the coverage of the mRNA by ribosomes is relatively low, leading to a density ρ that is around 30% of the maximal coverage.
There are, furthermore, some features that expression (5) for the degradation rate does not take explicitly into account. First, it neglects the dynamics of the translation process and ignores the interaction between ribosomes, which is responsible for ribosomal traffic jams. Secondly, both the size of the degrading enzymes and the varying distances between the ribosomes, which determine the available cleavage area, are not properly considered.
To elucidate the role of these effects, we have performed simulations of totally asymmetric exclusion processes with extended objects [22, 31]. In these processes, the motion of ribosomes along an mRNA is described as a stochastic stepping along a homogeneous chain of codons (stepping on non-homogeneous chains is presented in [32]) and is a widely used tool to study the dynamics of translation [21, 22, 24, 33, 34]. The ribosomes are represented as extended objects occupying 10 codons each and their interaction is governed by a hard core repulsion, i.e., two ribosomes cannot overlap. At all times of the simulation, the mRNA can be degraded with a rate ωdeg, which is proportional to the total available cleavage area taking into consideration both the available space between the ribosomes and the segments of mRNA that are not yet covered by ribosomes. However, in our simulations we have assumed that only stretches of mRNA of a minimal length of 20 codons do contribute to the cleavage area. This minimal length accounts for the size of the degrading enzymes and the steric repulsion between enzymes and ribosomes.
The simulation of degradation proceeds as follows. At each instant of the simulation, either a ribosome moves or the mRNA is degraded. Which decision is taken—stepping or degradation—depends on the random occurrence of events associated with the corresponding rates. The simulations are performed in continuous time using the Gillespie algorithm [35]. The stepping rate of each ribosome that is not hindered by another downstream ribosome is given by an elongation rate determined by the average velocity of ribosomes in E. coli, which is fixed to 10 codons per second. Furthermore, new ribosomes initiate translation with a rate ωon = 0.33 s−1, thus ensuring the experimentally found low-density ribosome traffic. The terminating ribosome, instead, moves smoothly out of the filament with a rate equal to the elongation rate. Moreover, the unshielded mRNA fragments that are at least 20 codons long are summed together to determine the total potential cleavage area and the rate of degradation is then proportional to it. In a next step, one computes which of these events is to take place (initiation, termination, elongation by one of the non-hindered ribosomes or degradation) by assigning to each of these events a probability equal to its own rate divided by the sum of all rates. Since the coverage of the mRNA by ribosomes changes dynamically, these simulations give the age-dependent degradation rate. Note that each realization of the simulation has a random duration which represents the lifetime of a single mRNA.
The simulations show that the rates change randomly over time due to the fluctuations of the distances between the ribosomes (an example of a long-lived mRNA is given in figure 2). After averaging over a large number of realizations, we find a behavior of the degradation rate such as in equation (5), i.e., it decreases linearly until it approaches a constant value at a time tL (see figure 2). This test confirms that the assumptions made in equation (5) are justified. Indeed, equation (5) reproduces the correct average behavior of the stochastic simulation that describe the dynamic shielding effect of ribosomes in more detail. Therefore, we will use the mean-field model described by equation (5) to systematically compare our theoretical results to experimental data.
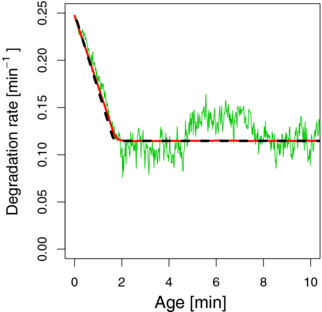
Figure 2. Stochastic simulation of the age-dependent degradation rate. During the lifetime of an mRNA its degradation rate is not constant due to the dynamic coverage by ribosomes. At each instant of a simulation, the positions and the distances between the ribosomes are different and hence the shielding of the mRNA changes with time in a random fashion. Consequently, in a single realization of the simulation the instantaneous degradation rate fluctuates (green), but it tends to decrease as the mRNA ages because a larger portion of mRNA becomes shielded. An average over 10 000 realizations shows that after an average transient time tL, the coverage by ribosomes stabilizes and the effective degradation rate attains a constant value (red). We compared these simulations with the time-dependent degradation rate according to equation (5) with ω1 = 0.25 min−1 and ω2 = 0.115 min−1 (dashed black line). The excellent agreement allows us to conclude that the analytical mean field theory is suitable to describe the average dynamic shielding effect as obtained from the more detailed simulations. For these simulations, we considered an mRNA with a length of 1000 codons, average ribosome velocity v = 10 codons s−1 and base degradation rate ω1 = 0.25 min−1. The minimum distance between ribosomes to allow cleavage was set to 20 codons. The initiation rate was set to ωon = 0.33 codons per second.
Download figure:
Standard image High-resolution image2.4. Data analysis and fitting procedure
We have compared our proposed theoretical mechanism to experimental data from [14], where the stability of mRNAs was assessed on a genome-wide scale for E. coli. There, cells of the strain MG1655 were grown at 37 ° C in LB medium and further transcription was inhibited via the addition of the antibiotic rifampicin. The abundance of each mRNA species was recorded at different time points after the inhibition of transcription by means of the fluorescence intensity in a microarray setup.
In order to compare the theoretical decay curves arising from our model, we have performed a nonlinear regression analysis. First, we have divided the intensity values at t = 2.5, 5, 10 and 20 min by the value at t = 0 to obtain the relative amount of mRNA for each gene. We have furthermore considered only those genes, for which we believe that the antibiotic had a fast effect on transcription. This led us to discard part of the data as not reliable. Indeed, for some genes, transcription seems not to be fully inhibited since the mRNA levels are rising. In addition, it was pointed out in [25] that each decay pattern should exhibit a positive curvature when the initial condition is a steady state expression level. Therefore, we restricted our analysis to data that met these criteria within a limited margin of error. Nevertheless, the definition of the initial time t = 0 in the experiments is not obvious because the drug certainly needs some time before it can block the whole transcription. We have thus only considered nearly bona-fide data where the slope between any two adjacent experimental data points does not increase by more than 10% and the curvature between three subsequent data points is convex within an error of up to 25%. Furthermore, in [14] the data values have been shifted to account for a spurious background signal. This procedure occasionally led to negative data values, which we have set to zero in order to avoid dealing with negative mRNA numbers.
For the subsequent analysis, we have assumed an average elongation rate v = 10 codons per second, which is a typical value for E. coli [36, 37]. Hence, for each gene, we have determined the values of the rates ω1 and ω2 that minimize the mean square deviation between the experimental decay data and the theoretical curve calculated in equation (1) by using (5) and (6). For the sake of comparison, we have performed the same analysis with a constant degradation rate by using equation (4).
3. Results and discussion
A schematic view of our shielding model is illustrated in figure 1. The timescale required to build a full polysome on a newly synthesized mRNA is tL. Before this time, the mRNA is only partially shielded by the ribosomes and its degradation is a time-dependent combination of two degradation rates. This model allows us to perform a fit of the experimental data using equations (1), (5) and (6) according to the methods explained in section 2.
In figure 3, we show three examples of the decay patterns from E. coli [14] and the corresponding fit with our model illustrated in figure 1. For comparison, we have repeated the analysis with an exponential function as given by equation (4). Clearly, the fit based on ribosome shielding, equations (5) and (6) (solid lines), is much more accurate than the one with constant rate (dashed lines). The three examples represent mRNAs of different length, for which the time tL for reaching a steady state ribosome coverage is different as well. Only for times larger than tL, the decay follows an exponential curve with a constant rate ω2.
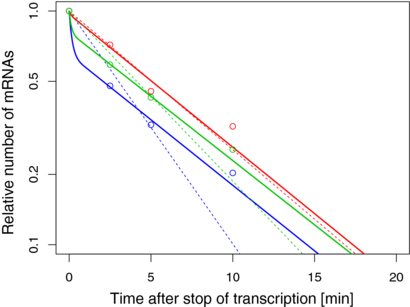
Figure 3. Experimental mRNA decay data (on logarithmic scale) after the inhibition of transcription adapted from [14] (circles). The solid curves obtained from a fit to (1) by using (5) and (6) yield an improved description of the decay data compared to the standard exponential fit (dashed lines). The curves show the decay of atoS (blue), fabB (green) and ykgE (red) mRNA. The mRNAs are of different length L (609, 407, 240 codons, respectively) and consequently they remain in the transient period for different time intervals tL = L/v. The effect on the stability of the mRNA deriving from partial shielding is more pronounced for longer mRNAs. Indeed, with the fitted values of the rates ω1 = 6.6 min−1 and ω2 = 0.13 min−1 (atoS, blue line), ω1 = 8.4 min−1 and ω2 = 0.13 min−1 (fabB, green line) as well as ω1 = 6.3 min−1 and ω2 = 0.13 min−1 (ykgE, red line), we obtain the following average lifetimes, 〈U〉 = 0.44 min, 〈U〉 = 0.59 min and 〈U〉 = 2.30 min, which decrease with the length of the mRNA.
Download figure:
Standard image High-resolution imageIn figure 4, we display the variety of decay patterns as obtained through the fitting process based on equation (5). From the 220 mRNAs analyzed here, only 74 decay exponentially (data for E. coli from [14]). Conversely, in most cases it was found that a steep decay at short times crosses over to a slower decay at later times, in qualitative agreement with the decay pattern expected from our shielding model. Fitting with equation (5) leads to a considerable reduction of the fitting error. Indeed, compared to a model based on a constant decay rate we find that the mean square deviation of the entire data set under consideration decreases about threefold (not shown). Since the shape of the decay pattern is more accurately described by equation (5), one can also achieve a much more accurate estimate of the half-life t1/2 defined in equation (3). Figure 5(A) reveals that there is a systematic decrease of the half-life t1/2 if we apply equation (5) in comparison to a simple exponential fit. Indeed, the average half-life over the entire analyzed data set reduces from 4.40 to 3.99 min. This observation becomes intuitive when we consider figure 3 again. In two out of the three cases, the fitted decay curves produced by the shielding model result in shorter half-lives, whereas the fit with a constant rate systematically overestimates them.

Figure 4. Categories of decay patterns found after fitting the experimental data of E. coli from [14] to the ribosome shielding model as described by equation (5). In all cases, the relative amount of mRNAs is plotted semi-logarithmically versus the time after the interruption of transcription. For the current analysis, we considered only experimental decay patterns that show a nearly bona-fide behavior (see the text), leading to a total of 220 mRNA species. We could distinguish four different classes of decay patterns. On the one hand, for 74 mRNA species one sees an exponential decay (black, top left). All other patterns deviate from an exponential decay and display a stronger decay for shorter times followed by a more moderate, exponential decay at larger t. In particular, the red patterns decay extremely fast for a short period followed by a transition to a moderate decay (top right). The 57 mRNAs of this class have a high value of the unshielded degradation rate ω1 and are thus degraded very efficiently before reaching a stationary ribosome coverage at time tL. Conversely, the 60 mRNAs depicted by the blue patterns (bottom, right) have a more moderate decay at short times, but also display a transition to a slower, exponential decay at time tL. The mRNAs pertaining to the former categories are short to intermediate, whereas long mRNAs (bottom, left) have a transient to stationary ribosome coverage which is particularly long. The 29 mRNAs of this group are longer than 400 codons. Note that the subdivision of the decay patterns in the four classes is by no means unambiguous but gives an overview over different types of patterns. Three characteristic examples are discussed in detail in figure 3.
Download figure:
Standard image High-resolution image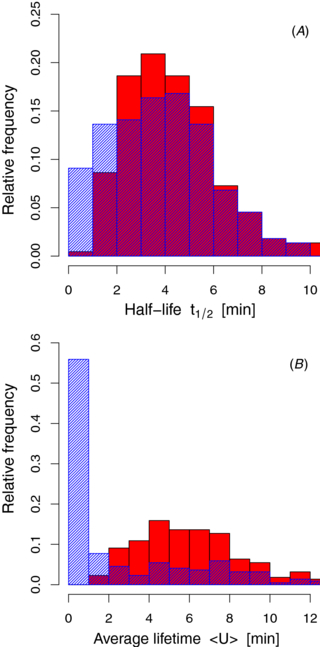
Figure 5. Distribution of half-lives t1/2 and average lifetimes 〈U〉. (A) Comparison of the distribution of the half-lives t1/2 when fitting the data with a purely exponential model (red) and the ribosome shielding model (blue). In the latter, the distribution is shifted to smaller times resulting in a reduced average half-life. (B) Comparison of the distribution of the average lifetimes 〈U〉 for the two models. The ribosome shielding model leads to much smaller average lifetimes because many mRNAs are degraded shortly after their synthesis.
Download figure:
Standard image High-resolution imageSince most decay patterns are not exponential, the half-life of an mRNA alone is not sufficient to characterize these patterns. For an exponential decay law, the average lifetime 〈U〉, defined in equation (2), and the half-life t1/2 are related via t1/2 = 〈U〉 · log (2). For a generic lifetime distribution, this relationship, however, does not hold. The analysis of the experimental data reveals that the shielding model yields much smaller average lifetimes 〈U〉 than a model with a constant degradation rate, as shown in figure 5(B). Indeed, the average lifetime over the whole data set reads 2.6 min, whereas the estimate for the simple exponential model is as large as 6.3 min. It is interesting to compare these small lifetimes to the timescale of ribosomal loading. It is usually thought that each mRNA contributes to the synthesis of proteins. However, only mRNAs that live longer than the timescale tL can produce proteins. The lifetime distribution computed at tL, ΦU(tL), determines the fraction of mRNAs of a given gene that are degraded until time tL. Thereby, the explicit computation showed that for many mRNA species a considerable amount of mRNAs produces no protein at all. Hence, although an exponential fit might be able to predict a reasonably accurate half-life t1/2, it gives a poor estimate for the average lifetime of an mRNA thus leading to a wrong estimate of the rate of protein synthesis.
One important result of the fit between our theory and the experimental data is that the degradation rate ω1 associated with the unshielded mRNA segments is always larger than the rate ω2 associated with the shielded mRNA segments. In fact, for the majority of the genes our fit delivers values where ω1 differs from ω2 by at least one order of magnitude (see figure 6). To fully appreciate this point, one should keep in mind that the fitting procedure is made without any bias concerning the values of these two rates. Whenever the fitting with the data gives two similar or identical rates, i.e., ω1 = ω2, one can infer that our hypothesis concerning the variation of mRNA stability during translation plays no role in the process of degradation. This would be the case if the ribosomes followed closely the RNA polymerase during the process of transcription. As shown in figure 4, only 74 of 220 mRNAs analyzed there show an exponential decrease of the mRNA amount. This means that only in a minority of the cases, the two rates ω1 and ω2 are identical and no effect of transient shielding by ribosomes is observable. Conversely, for the majority of the mRNAs the rate of the unshielded stretch of mRNA ω1 is much larger than the rate of the shielded stretch, ω2. From figure 6, it is also evident that longer mRNAs tend to have smaller values of the rate ω1. There is therefore a competition between two effects both contributing to shorten the lifetime of an mRNA. On the one hand, the longer the mRNA the longer the time during which it is unprotected. On the other hand, the larger the ω1, the less stable is the mRNA during the transient unprotected phase. In different experiments and organisms, it was found that the length of the coding region of an mRNA and its stability are sometimes correlated [38–40, 12, 6]. Our analysis of the data from [14] reveals, however, no strong correlation between length and stability (see figure 7). This might not be too surprising because each mRNA species is regulated individually thus giving rise to the broad range of lifetimes shown in figure 5. However, if we subdivide the set of mRNA species into classes sharing the same degradation rates ω1 and ω2, then—within each class—we observe a clear negative correlation between the length of the coding region and mRNA average lifetime. The three mRNAs displayed in figure 3, for example, vary in length from 609 codons for the gene atoS, to 407 codons for the gene fabB, and 240 codons for the gene ykgE. These three examples exhibit similar degradation rates (see table 1), but the average lifetimes decrease with the mRNA length. Since for longer mRNAs the steady state is reached at a later time point tL, the initial unprotected phase is also longer. Hence, in this case, longer mRNAs exhibit a shorter average lifetime. In figure 7, we show the length of the mRNA versus the average lifetime 〈U〉 and half-life th, respectively. While for the complete set of genes there is no clear pattern or correlation, among each subset of highlighted genes there is a clear negative correlation. As mentioned earlier, our interpretation is that the mRNAs within any given subset share the same parameters because they are degraded according to common mechanisms and have similar affinities to the degrading enzymes.
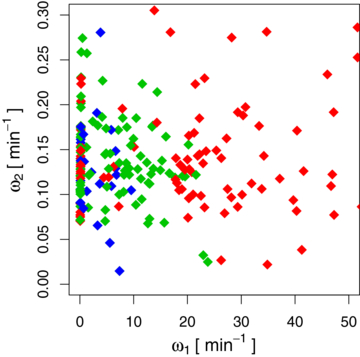
Figure 6. Gene-to-gene comparison between ω1 and ω2. Each diamond represents a pair of rates of a given mRNA from our present analysis. The mRNAs denoted by red diamonds are shorter than 250 codons, those with green diamonds range between 250 and 500 codons and the blue ones represent mRNAs longer than 500 codons. The value of ω2 is widely scattered, whereas there is a hierarchy for the value of ω1. Longer mRNAs tend to have a smaller rate ω1. The diamonds that lie close to the y-axis represent the mRNAs that decay exponentially, i.e., ω1 = ω2.
Download figure:
Standard image High-resolution image
Figure 7. Half-life (top) and mean lifetime (bottom) versus length of the coding sequence for the data analyzed in figure 4. The plot reveals no strong overall correlation between mRNA stability and mRNA length. However, when we highlight mRNAs with similar rates ω1 and ω2, a negative correlation is clearly visible. This phenomenon can be easily explained within the ribosome shielding model. Longer mRNAs are unprotected for a longer period and are therefore more susceptible for degradation.
Download figure:
Standard image High-resolution imageTable 1. Fitting parameters for the three mRNA species shown in figure 3. The rates ω1 and ω2 enter the age-dependent degradation rate defined in equation (5). The length of the mRNA determines the transient time tL.
| Gene name | Length (codons) | ω1 (min−1) | ω2 (min−1) | 〈U〉 (min ) |
|---|---|---|---|---|
| atoS | 609 | 6.6 | 0.13 | 0.44 |
| fabB | 407 | 8.4 | 0.13 | 0.59 |
| ykgE | 240 | 6.3 | 0.13 | 2.30 |
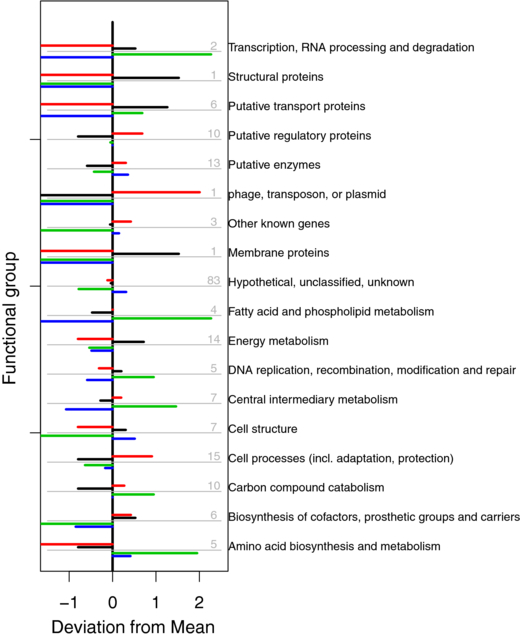
We have furthermore investigated if the different decay patterns are related to known gene functions. In figure 8, we assess whether genes of any of the decay category shown in figure 4 are either over- or underrepresented in 18 different functional groups. Therefore, we computed the deviation from the mean, defined as the logarithm of the relative frequency of mRNAs of a particular decay category in any of the functional groups. A large positive or negative deviation is observed mostly when only very few mRNAs belong to a particular functional group. The association to any gene function is therefore most likely not significant from a statistical point of view.
Figure 8. Distribution of the decay patterns in functional groups. The gray-shaded numbers give the numbers of mRNAs in each group. The colored bars represent mRNAs belonging to each of the four mRNA decay categories identified in figure 4. A positive (negative) deviation denotes a disproportional high (low) share of mRNAs of a given decay category in that particular functional group (see the main text). Due to the small sample size, however, these results have a poor statistical significance and are thus only indicative of possible trends.
Download figure:
Standard image High-resolution image
In applying our theory to the experimental data, we have made the assumption that the effect of the drug rifampicin leads to a fast global interruption of transcription. We have taken into account obvious deviations from this assumption by eliminating from our analyses those decay patterns that do not satisfy our mathematical bona-fide criteria determined in [25]. Nevertheless, it is reasonable to believe that transcription stops rather gradually over timescale short compared to the time of the first measurement. Our theory can be readily extended to cases where the stop of transcription is delayed (see [41, appendix C.2]). Practically, this can be achieved by rescaling the time after stop of transcription accordingly. The general effect of such a delay would be of retarding the decay of the amount of mRNA with the consequence that the values of the degradation rate ω1 as deduced here may be considered as lower bounds for its real values.
4. Conclusions
In this study, we have developed a theoretical model for endonucleolytic mRNA degradation that was based on the assumption that ribosomes shield the mRNA against endonucleolytic degrading processes. We have applied our model to experimental data of E. coli from [14] and we have shown that our description greatly improves the accuracy of the data analysis. Furthermore, we identified different classes of decay patterns where the purely exponential decay appears only in a minority of the cases.
We have assumed that during the transient time tL the mRNA is only partially covered by ribosomes. The unbiased fit of the model with the data shows that only for about a third of the genes there seems to be no effect of ribosome shielding. For these genes, one can assume that co-transcriptional translation might render the initial ribosome loading phase negligible. However, for all other genes the data reveal that the degradation rate for the covered region of the mRNA must be smaller than the degradation rate for the uncovered region of the mRNA. This finding leads us to conclude that co-transcriptional translation might be much less common than believed so far.
Our theory produces a more accurate estimate of the average lifetimes because it is able to describe the real behavior of the decay pattern. The values of the average lifetimes thus computed are definitively smaller than those estimated according to the standard exponential fit. This implies that a large fraction of mRNAs is degraded before being able to produce any protein. This surprising and counter-intuitive result must be taken into account when assessing the actual rate of protein synthesis and shows that post-transcriptional control may be of similar significance as transcriptional control for gene regulation in E. coli [2]. Moreover, this conclusion confirms the hypothesis in [7] that in E. coli longer mRNAs tend to produce less proteins than shorter ones.