


Abstract
Iron chalcogenide superconductors have become one of the most investigated superconducting materials in recent years due to high upper critical fields, competing interactions and complex electronic and magnetic phase diagrams. The structural complexity, defects and atomic site occupancies significantly affect the normal and superconducting states in these compounds. In this work we review the vortex behavior, critical current density and high magnetic field pair-breaking mechanism in iron chalcogenide superconductors. We also point to relevant structural features and normal-state properties.
Export citation and abstract BibTeX RIS
Corrections were made to this article on 15 January 2013. The name of the sixth author was corrected.
1. Introduction
The discovery of superconductivity in La(O,F)FeAs with superconducting transition temperature Tc = 26 K [1] stimulated intensive research on related materials. This resulted in the discovery of several families of iron-based superconductors with the highest Tc = 56 K [1–23], including REOFePn (RE = rareearth; Pn = P or As, FePn-1111 type) [1–7], AFe2As2 (A = alkaline or alkaline-earth metal, FeAs-122 type) [8–10], AFeAs (FeAs-111 type) [11, 12], (Sr4M2O6)(Fe2Pn2) (M = Sc, Ti or V, FePn-42622 type) [13, 14], FeCh (Ch = S, Se, Te, FeCh-11 type) [15–17] and AxFe2−ySe2 (AFeCh-122 type) [18–23].
The crystal structure of FeCh and AFeCh-122 systems features a square-planar lattice of Fe with tetrahedral coordination, which is the common ingredient found in all iron-based superconductors, but they also have some distinctive characteristics. For example, FeCh-11 type materials have a rather simple crystal structure without the charge reservoir layer. FeSe exhibits a significant pressure effect [24]: under external pressure, the Tc can be increased from 8 to 37 K and the dTc/dP can reach 9.1 K GPa−1, the highest increase in all iron-based superconductors. Fe(Te,Se) and Fe(Te,S) contain strongly magnetic excess Fe in Fe(2) site that provides local moments and tunes details of magnetic structure depending upon the amount of excess Fe [25, 26]. On the other hand, in AFeCh-122 materials the hole Fermi surfaces (FSs) are absent [27, 28], which is different from other iron-based superconductors where both electron and hole FSs are present [29], suggesting pairing symmetry other than s ± [30]. There are also vacancies in the Fe plane that order at T = 578 K resulting in long-range antiferromagnetic (AFM) order at TN = 559 K [31]. Finally, one of the most distinctive features in AFeCh-122 is the proximity of semiconducting state [23], which is magnetic but is spatially separated and coexists with superconducting regions on the 10–100 nm length scale [32–38]. This is different from iron pnictides where superconductivity emerges when the spin density wave (SDW) state is suppressed [39].
On the other hand, because of large upper critical fields μ0Hc2 and small lower critical fields, iron-based superconductors exhibit rich vortex phenomena in the mixed state and exotic temperature dependences of μ0Hc2(T). There are also some promising technical application perspectives due to high Tc and large μ0Hc2. The distinctive features of iron chalcogenides will lead to the pronounced differences of the superconducting properties in magnetic fields when compared to pnictides, such as the different contributions of multiband and spin paramagnetic effects which will determine the temperature dependence of the μ0Hc2(T), the different strengths of vortex thermal fluctuations in mixed state and the different behaviors of critical current density Jc in magnetic fields.
In this paper, we review the superconducting properties of iron chalcogenide superconductors in high magnetic fields, while comparing these properties with those of iron pnictide superconductors. In section 2, we address vortex physics, especially thermally activated flux flow. Section 3 describes the Jc, and in section 4, we describe the important features of μ0Hc2 and compare μ0Hc2 in iron pnictide and iron chalcogenide superconductors. Finally, in section 5, we summarize the main results we discussed and outline general perspectives of this field.
2. Vortex physics in iron chalcogenide superconductors
Iron-based superconductors are extreme type-II superconductors with κ ∼ 100 and a large range of magnetic field penetration in the mixed state of μ0H–T phase diagram. Hence, rich vortex physics is expected in all iron-based superconductors. In the mixed state the thermal fluctuation effects on the vortex behavior can be quantified by the Ginzburg number Gi

where kB is Boltzmann constant, μ0 is vacuum permeability,  is the thermodynamic critical field (ϕ0 is magnetic flux quantum), λab(0) is the London penetration depth in the ab plane, and ξab(0) and ξc(0) are the coherence lengths in the ab plane and c-axis, at T = 0 K, respectively. Here we assume ξa(0) = ξb(0) = ξab(0), which is consistent with the tetragonal lattice symmetry of iron-based superconductors. The Gi is basically the squared ratio of the thermal energy to the condensation energy in the volume occupied by the Cooper pair [40]; it can be rewritten as [40]

where γm is the mass anisotropy in a uniaxial crystal, γm = mc/mab = (ξab/ξc)2 = (Hc2,ab/Hc2,c)2, and m is the effective mass and n is carrier density. The Gi can be increased strongly if (i) Tc increases, (ii) effective mass increases, (iii) mass anisotropy increases or (iv) carrier density decreases. In the layered cuprate oxide superconductors vortex behavior can be affected dramatically by thermal fluctuation (Gi∼10−3 − 1) because of high Tc and large γm when compared to conventional Bardeen–Cooper–Schrieffer (BCS) superconductors where vortex thermal fluctuation is negligible (Gi ∼10−10 − 10 −6) [40]. In iron-based superconductors, thermal fluctuation effects (Gi ∼10−4 − 10−2) also influence vortex properties [40]. Some iron-based superconductors exhibit significant vortex fluctuations similar to those in the cuprates with smallest anisotropy, such as YBa2Cu3O7−x (YBCO), despite smaller Tc and γm. Relatively large thermal fluctuation effects may be related to the low n and large m [41–43]. In FeCh-11 superconductors, Tc is smaller at ambient pressure as compared to FeAs-122 materials but the Gi (∼10−3) is larger than the latter one (Gi ∼10−4) [40], which could be ascribed to the significant mass enhancement [41]. Therefore, thermally activated vortex dynamics is expected even at low temperatures.
2.1. Thermally activated flux flow
Thermal fluctuations in FeCh-11 superconductors can result in the thermally activated flux flow (TAFF) behavior where the vortex bundles hop between neighboring pinning centers. According to the TAFF theory, the resistivity in TAFF region can be expressed as [44–46]

where ν0 is an attempt frequency for a flux bundle hopping, L is the hopping distance, B is the magnetic induction, J is the applied current density, Jc0 is the critical current density in the absence of flux creep, V is the bundle volume and T is the temperature. If J is small enough and JBV L/T ≪ 1, we obtain

where U = Jc0BV L is the thermal activation energy and ρc = ν0LB/Jc0, which is usually considered to be temperature independent. For cuprate superconductors, the prefactor 2ρcU/T is usually assumed as a constant ρ0f [45], therefore, ln ρ(T,μ0H) = ln ρ0f − U(T,μ0H)/T. On the other hand, according to the condensation model [46], U(T,μ0H) = (μ0Hc(t))2ξn(t), where μ0Hc is the thermodynamic critical field, ξ is the coherence length, t = T/Tc, and n depends on the dimensionality of the vortex system with the range from 0 to 3. Since μ0Hc∝1 − t, and ξ∝(1 − t)−1/2 near Tc [47], it is obtained that U(T,μ0H) = U0(μ0H)(1 − t)q, where q = 2 − n/2. It is generally assumed that U(T,μ0H) = U0(μ0H)(1 − t), i.e. n = 2, and the ln ρ − 1/T becomes Arrhenius relation

where ln ρ0(μ0H) = ln ρ0f + U0(μ0H)/Tc is a temperature-independent term and U0(μ0H) is the apparent activation energy. Furthermore, it can be concluded that −∂ ln ρ(T,μ0H)/∂T−1 = U0(μ0H). Hence, the ln ρ versus 1/T should be linear in the TAFF region. The slope is U0(μ0H) and its y-intercept represents ln ρ0(μ0H).
As shown in figures 1(a) and (b), the experimental data can be fitted using the Arrhenius relation very well for both FeSe and Fe1.03Te0.55Se0.45 (Se-45) single crystals [48, 49]. The good linear behavior indicates that the temperature dependence of U(T,μ0H) is approximately linear, i.e. U(T,μ0H) = U0(μ0H)(1 − t) [45, 46]. The log ρ(T,μ0H) lines for compounds extrapolate to the same temperature Tcross, which should be equal to Tc [50]. For FeSe single crystal, the extrapolated temperatures are about 11.1 K for both H∥(101) and H⊥(101). This behavior has also been observed in NdFeAsO0.7F0.3 single crystals for H∥c, however, it is not the case for H∥ab [51]. For FeSe single crystal, the obtained U0 are similar for H∥(101) and H⊥(101) (inset of figure 1(a)) and much smaller than in Fe(Te,Se) [49, 52]. Moreover, ln ρ0(μ0H) − U0(μ0H) is linear for both field directions (inset of figure 1(a)). Fits using ln ρ0(μ0H) = ln ρ0f + U0(μ0H)/Tc yielded values of ρ0f and Tc as 37(1) mΩ cm and 11.2(1) K for H∥(101) and 39(2) mΩ cm and 11.2(1) K for H⊥(101). The Tc values are consistent with the values of Tcross within the error bars. As shown in figures 1(c) and (d), the field dependence of U0(H) exhibits a power-law behavior for both FeSe and Se-45, i.e. U0(μ0H) ∼ (μ0H)−α. There are two types of power-law behavior at low and high fields. For FeSe, α ∼0.25 for μ0H < 3 T and α ∼ 0.7 for μ0H > 3 T. Se-45 exhibits similar behavior to FeSe (α ∼ 0.25 for μ0H < 2 T and α ∼ 0.55 for μ0H > 2 T). The weak power-law dependence of U0(μ0H) at low fields implies that single-vortex pinning dominates in this region [44], followed by a quicker decrease of U0(μ0H) at high fields where the vortex spacing becomes significantly smaller than penetration depth in higher fields and a crossover to a collective-pinning regime occurs. In this region, the U0(μ0H) becomes strongly dependent on the field [53]. A similar crossover has been observed in Nd(O,F)FeAs single crystals [51]. Because α = 0.5 and 1 correspond to a planar-defect pinning and a point-defect pinning, respectively [54], for FeSe, the fitted α values vary between 0.5 and 1, suggesting that the pinning centers may be mixed with point and planar defects. On the other hand, for Se-45, the fitted α values are close to 0.5, implying that the vortices are mainly pinned by the collective point defects in the high-field region.

Figure 1. Arrhenius plots for resistivity in various fields for (a) FeSe single crystal with H⊥(101) and (b) Fe1.03Te0.55Se0.45 single crystals with H∥c. The corresponding solid lines are fitting results from the Arrhenius relation. Inset of (a): ln ρ0(μ0H) versus U0(μ0H) derived from the Arrhenius relation for both field directions. The solid lines are linear fitting results. (c) and (d) Field dependence of U0(μ0H) for FeSe and Fe1.03Te0.55Se0.45, respectively. The solid lines are power-law functions U0(μ0H) ∼ (μ0H)−α. (a) Reprinted with permission from [48]. Copyright 2012 by the American Physical Society. (b) Reprinted with permission from [49]. Copyright 2010 by the Elsevier.
Download figure:
Standard imageLarge fitting errors occur for Fe1.14Te0.91S0.09 (S-09) single crystal when using the Arrhenius relation in the TAFF region (solid lines), especially for H∥ab (figures 2(a) and (b)). Deviation from the Arrhenius relation indicates that the assumptions of constant ρ0f and linear temperature dependence of U(T,μ0H) could be invalid in S-09. If U(T,μ0H) = U0(μ0H)(1 − t) and ρ0f = const, this will result in −∂ ln ρ(T,μ0H)/∂T−1 = U0(μ0H), and U0(μ0H) should be a set of horizontal lines as shown in figures 2(c) and (d). The limited lengths of horizontal lines correspond to the temperature interval used for estimating U0(μ0H) in the Arrhenius relation. It can be seen that −∂ ln ρ(T,μ0H)/∂T−1 increases sharply with decreasing temperature, which was also observed in Bi-2212 thin films [55]. The center of each U0(μ0H) horizontal line approximately intersects the −∂ ln ρ(T,μ0H)/∂T−1 curve, and therefore each U0(μ0H) is only the average value of its −∂ ln ρ(T,μ0H)/∂T−1 in the fitting temperature region. Hence, the U(T,μ0H) determined using the Arrhenius relation does not reflect the true evolution of thermal activation energy with temperature in S-09, particularly for H∥ab.

Figure 2. (a) and (b) Temperature dependence of longitudinal resistivities log ρ(T,μ0H) of Fe1.14Te0.91S0.09 in various magnetic fields for H∥ab and H∥c, respectively. The corresponding solid and black dashed lines are fitting results from the Arrhenius relation (equations (5) and (6)). (c) and (d) Experimental −∂ ln ρ/∂T−1 data in the TAFF region for H∥ab and H∥c, respectively. The red solid horizontal lines correspond to U0(μ0H) obtained from the Arrhenius relation and the blue dashed lines are plotted using equation (7). The parameters are determined via fitting equation (6) to the corresponding experimental resistivity data shown in panels (a) and (b). Reprinted with permission from [50]. Copyright 2010 by the American Physical Society.
Download figure:
Standard imageIf ρ0f = 2ρcU(T,μ0H)/T is temperature dependent due to the term U(T,μ0H) = U0(μ0H)(1 − t)q and q can be different from 1, then it can be shown from equation (4) [56] that

and thus

where q, ρc and U0(μ0H) are temperature-independent free parameters, and Tc derived from the Arrhenius relation is used for fitting. Figures 2(a) and (b) reveal that all fitting curves (dashed lines) agree well with experimental data and the results are better than the Arrhenius relation, especially for H∥ab. Figures 2(c) and (d) clearly show the advantage of equation (7) over the Arrhenius relation. It can effectively capture the upturn trend of −∂ ln ρ/∂T−1 with decreasing temperature. As shown in figure 3(a), the U0(μ0H) values obtained using equation (6) are comparable to that in FeSe but smaller than in Fe(Te,Se) [48, 49, 52]. Similar to FeSe and Fe(Te,Se), there are also two ranges in the field dependence of U0(H) curves with different α for both field directions in S-09. For H∥ab, α = 0.12(2) for μ0H < 5 T and α = 1.7(3) for μ0H > 5 T; For H∥c, α = 0.21(3) for μ0H < 5 T and α = 1.3(2) for μ0H > 5 T. In the low-field region, the small α suggests that single-vortex pinning dominates, similar to FeSe and Fe(Te,Se). At high fields α is larger than 1, implying that the material enters a collective pinning regime and the pinning centers are point defects [54]. On the other hand, the values of q change from about 1 for H∥c to 2 for H∥ab, independent on the field intensity for both directions (figure 3(b)). The value of q = 2 has also been observed in many cuprates superconductors [55–57]. The nonlinear temperature dependence of U0(T,μ0H) and non-constant prefactor ρ0f are also common to other iron-based superconductors [58, 59].
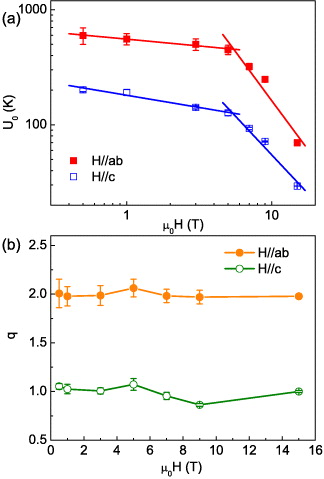
Figure 3. Magnetic field dependences of (a) U0 and (b) q obtained from fitting the resistivity in the TAFF region using equation (6) for Fe1.14Te0.91S0.09. The open and filled squares represent U0(μ0H) for H∥c and H∥ab, respectively, while the open and filled circles show corresponding q, respectively. The solid lines in (a) are power-law functions U0(μ0H) ∼ (μ0H)−α. Reprinted with permission from [50]. Copyright 2010 by the American Physical Society.
Download figure:
Standard imageIt should be noted that the low volume fraction of superconductivity in Fe(Te,S) should not significantly affect the analysis of TAFF. Because of the inhomogeneity of crystals, the conductivity can be expressed as σ = σsc + σnormal, where σsc is the conductivity of superconducting fraction and σnormal is the conductivity of the normal fraction of the crystal. When T < Tc,zero, σ = σsc = ∞, i.e. ρ = 0 and the normal-state part of sample is short-circuited. On the other hand, the resistivity in the TAFF regime is about one to three orders of magnitude less than in the normal state [45, 46]. It means that although the conductivity σsc in this range is finite, it is still much larger than σnormal, and we can approximate σ ≈ σsc.
In K0.64Fe1.44Se2 and Tl0.58Rb0.42Fe1.72Se2 single crystals, as shown in figure 4, the good linear behavior of ln ρ(T,μ0H) versus 1/T in a wide temperature range for both field directions indicates that the temperature dependence of U(T,μ0H) is approximately linear [60], i.e. q = 1, and the ρ0f is constant, similar to FeSe and Fe(Te,Se) [48, 49]. For K0.64 Fe1.44Se2, fitting by the function ln ρ0(μ0H) = ln ρ0f + U0(μ0H)/Tc yields ρ0f = 5.3(1) and 12.4(1) Ω cm and Tc = 31.8(3) and 32.3(2) K for H∥ab and H∥c, respectively (inset of figure 4(a)). On the other hand, the log ρ(T,μ0H) lines for different fields extrapolate to one temperature Tcross ∼ 32 K for both field directions, consistent with the values of Tc within the error bars. The U0(μ0H) values obtained for both superconductors are much larger than in FeCh-11 materials; they are comparable to that in polycrystalline NdFeAsO0.7F0.3 [51], but are still much smaller than in polycrystalline SmFeAsO0.9F0.1 [58]. The power-law fitting yields α = 0.78(2) and 0.84(2) for H∥ab and H∥c in K0.64Fe1.44Se2 and α = 0.27(2) for H∥ab and 0.22(2) for H∥c in Tl0.58Rb0.42Fe1.72Se2 (insets of figures 4(b)–(d)). For both materials, the field dependencies of U0(μ0H) are similar for both field directions, indicating that the pinning forces weakly depend on orientation [60]. But the values of α are rather different. For K0.64Fe1.44Se2, the values of α are similar to those in FeSe, suggesting that both point and planar defects act as the pinning centers. On the other hand, the much smaller values of α in Tl0.58Rb0.42Fe1.72Se2 imply that the single-vortex pinning mechanism is dominant in fields up to 15 T.
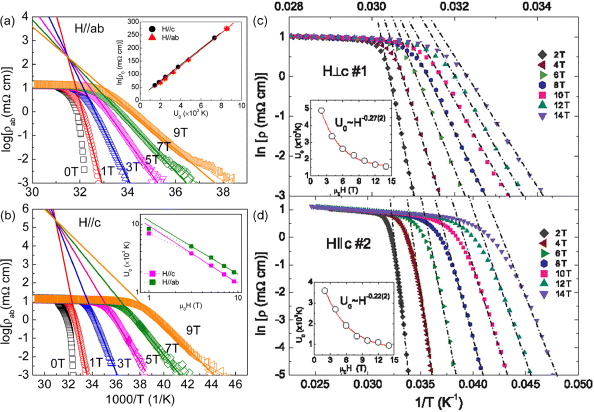
Figure 4. Arrhenius plot for resistivity at various fields of K0.64Fe1.44Se2 for (a) H∥ab and (b) H∥c and Tl0.58Rb0.42Fe1.72Se2 for (c) H∥ab and (d) H∥c. The corresponding solid lines are fitting results from the Arrhenius relation. Inset of (a): ln ρ0(μ0H) versus U0(μ0H) derived from the Arrhenius relation for K0.64 Fe1.44Se2. The solid lines are linear fitting results. Inset of (b): field dependence of U0(μ0H) of K0.64Fe1.44 Se2. Insets of (c) and (d): field dependences of U0(μ0H) in Tl0.58Rb0.42Fe1.72Se2 for H∥ab and H∥c, respectively. The solid lines in the insets of (b–d) are power-law functions U0(μ0H) ∼ (μ0H)−α. Panels (c) and (d) reprinted with permission from [60]. Copyright 2012 by the American Physical Society.
Download figure:
Standard image3. Critical current density
Since the discovery of iron-based superconductors, the combination of rather high Tc and high μ0Hc2 has induced great interests for application. For practical applications of superconductors, however, high Jc is another key parameter that needs to be investigated. YBCO has superior current-carrying properties but the stringent weak-link effect of grain boundaries (GBs) restricts the range of applications and increases the cost of fabrication [61]. In iron-based superconductors (figures 5(a) and (b)) [62], the high μ0Hc2 gives some promise for applications at high fields, where low-temperature Nb3Sn superconductor is at disadvantage because of low μ0Hc2 [40].

Figure 5. (a) Jc–Tc–μ0Hc2 contour lines of Nb3Sn, YBa2Cu3O7−x, MgB2 and iron-based superconductors. (b) Tc–H phase diagrams for various superconductors. The solid and dashed lines show the μ0Hc2 and the irreversibility fields H* for H∥c, respectively. (a) Reprinted with permission from [62]. (b) Reprinted with permission from [40]. Copyright 2011 by the IOP Publishing.
Download figure:
Standard imageIron chalcogenide superconductors crystallize in a relatively simple crystal structure, but often with defects and relatively large range of stoichiometry. In addition, there is a sensitivity to atmosphere in AFeCh-122. However, lower anisotropy γ of μ0Hc2 when compared to iron pnictide superconductors is advantageous for applications such as superconducting wires for high-field magnets.
3.1. Jc and flux pinning in FeCh-11 and AFeCh-122 single crystals
Figure 6 shows the Jc of FeSe, FeTe0.61Se0.39 and FeTe0.9S0.1 single crystals at various fields and temperatures [48, 63, 64]. At T ∼ 5 K, the Jc of FeSe is about 2.4 × 10³ A cm−2 for H⊥(101) at zero field. This is lower than Jc in FeTe0.61Se0.39 and FeTe0.9S0.1, which is about 2 × 10⁵ and 3 × 10⁵ A cm−2 for H∥c, respectively. FeTe0.61Se0.39 shows relative high Jc and it remains above 7 × 10⁴ A cm−2 at μ0H = 5 T. Moreover, the Tc of optimally doped Fe(Te,Se) (Se ∼ 0.4 − 0.5) is about 14 K, which is higher than in Fe(Te,S) and FeSe. It implies that the optimally doped Fe(Te,Se) might be suitable for applications. On the other hand, the anisotropy γJc of Jc (γJc = JH∥(101)c/JH⊥(101)c or JH∥abc/JH∥cc) is about 4–5 for FeSe and FeTe0.9S0.1 [48, 64].
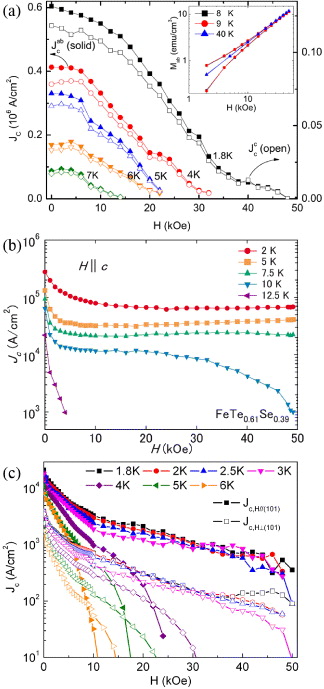
Figure 6. Jc(T,μ0H) at various temperatures and fields for (a) FeTe0.9S0.1, (b) FeTe0.61Se0.39 and (c) FeSe. (a) Reprinted with permission from [64]. (b) Reprinted with permission from [63]. Copyright 2009 by the American Physical Society.
Download figure:
Standard imageWhen compared to FeCh-11 superconductors, the much higher Tc and μ0Hc2 of AFeSe-122 superconductors immediately raise a question whether the Jc values of these materials are more promising for practical applications. As shown in figure 7(a), however, the early studies indicate that Jc of KxFe2−ySe2 is rather low (∼(0.7–2.6) ×103 A cm−2 at 5 K) [65, 66], even lower than that of FeSe [48]. Therefore, it is important to explore pathways for the enhancement of Jc in AFeCh-122 compounds.

Figure 7. (a) Field dependences of Jabc(μ0H) of sulfur-doped KxFe2−ySe2−zSz and quenched KxFe2−ySe2 single crystals at 1.8 K. (b) Reduced field dependence of fp(h) at various temperatures for quenched KxFe2−ySe2 single crystal. Solid line is fitting curve using fp = Ahp(1 − h)q. Inset:  as a function of Hirr. The fitting result using
  is shown as solid lines. (c) Reduced temperature dependence of μ0Hirr( t) with the fitting result using the (1 − t)β law (solid line) for quenched KxFe2−ySe2 single crystal. (d) Reduced temperature dependence of the Jc(t) at zero field for quenched Kx Fe2−ySe2 single crystal. The solid line shows the fitting result using Jc(0)(1 − t2)γ. The measured and estimated μ0Hirr are shown as filled and open circles in inset of (b) and (c). Reprinted with permission from [70]. Copyright 2011 by the American Physical Society.
Download figure:
Standard imageIt was soon found that sulfur doping can remarkably enhance the Jc of KxFe2−ySe2−zSz [67]. As shown in figure 7(a), the Jabc(μ0H) (H∥c) exhibits a small increase in the high-field region for z = 0.32 when compared to the z = 0 sample. On the other hand, the enhancement is about one order of magnitude for z = 0.99 (Jabc(0) = 7.4 × 10³ A cm−2 at 1.8 K) in the entire magnetic-field range. For higher S content, the Jabc(0) is still much larger than in z = 0 sample, but the Jabc(μ0H) at high fields is smaller. It should be noted that the Tc decreases significantly when z > 0.32. When compared to z = 0 (Tc, onset = 33.0 K), the z = 0.99 crystal has Tc,onset = 24.6 K, whereas z = 1.04 corresponds to Tc,onset = 18.2 K [68]. Therefore, the sample with z = 0.99 exhibits the best performance among sulfur-doped samples investigated. Moreover, the ratio of Jcc(μ0H)/Jabc(μ0H) is approximately 1 and is smaller than in FeCh-11 superconductors. Although the Jc of z = 0 sample is much larger than in KxFe2−ySe2 and also larger than in FeSe, it is still smaller than in FeTe0.61Se0.39 and FeTe0.9S0.1.
Metallic and superconducting state was induced by post-annealing and quenching treatment in as-grown and insulating KxFe2−ySe2 crystals, which is a notable improvement in superconducting properties [69]. Therefore, some effects of this process on the Jc are also expected [70]. Post-annealing and quenching process can further increase Jabc(0) to 7.4 × 10³ A cm−2 at 1.8 K which is about 50 times larger than that of the as-grown sample (figure 4(a)). This cannot be simply ascribed to the improvement of the superconducting volume fraction, because the volume fraction of the quenched crystal is only about four times larger than that of the as-grown crystal. It could also be related to the enhanced flux pinning force due to the post-annealing and quenching treatment. The Jc in the quenched crystal is also slightly higher than that in KxFe2−ySe2 crystals grown using the one-step technique [71] and are the highest known Jc values among AFeCh-122 type materials until now. The quenched sample also exhibits a good performance at high fields. The Jabc(μ0H = 4.8 T) for the quenched sample is still larger than 104 A cm−2 at 1.8 K, whereas for the as-grown sample, it has already decreased about one order of magnitude.
As shown in figure 7(b), detailed studies on the temperature and field dependences of the vortex pinning force Fp = μ0HJc show that it follows the Dew-Huges [72] scaling law: fp∝hp(1 − h)q, where fp = Fp/Fmaxp is the normalized vortex pinning force, Fmaxp corresponds to the maximum pinning force and h = H/Hirr is the reduced field. The results indicate that there is a dominant pinning mechanism. The obtained p and q is 0.86(1) and 1.83(2), respectively and the value of hmaxfit = p/(p + q) ≈ 0.32 is consistent with the peak positions (hmaxexp ≈ 0.33) of the experimental curves at different temperatures. Those values are close to the expected values for core normal point-like pinning (p = 1, q = 2 and hmaxfit = 0.33) [69]. These point-like pinning centers might come from the random distribution of iron vacancies after quenching, similar to FeAs-122 type materials [73, 74]. On the other hand, the Fmaxp can be fitted using Fmaxp∝(μ0Hirr)α with α = 1.67(1) (inset of figure 4(b)), close to the theoretical value (α = 2) for the core normal point-like pinning [72]. Moreover, as shown in figure 7(c), the temperature dependence of μ0Hirr can be fitted with equation μ0Hirr(T) = μ0Hirr(0)(1 − t)β, and we obtained β = 1.21(1), close to the characteristic value of 3D giant flux creep (β = 1.5) [53]. For type-II superconductors, vortices interact with pinning centers either via the spatial variations in the Tc ('δTc pinning') or by scattering of charge carriers with reduced mean free path l near defects ('δl pinning') [44]. These two pinning types result in the different temperature dependences of Jc(t) in the single vortex pinning regime i.e. low-field and zero-field regions. For δTc pinning, JδTcc,H=0(t) = Jc,H=0(0)(1 − t2)7/6(1 + t2)5/6 while for δl pinning, Jδlc,H=0(t) = Jc,H=0(0)(1 − t2)5/2(1 + t2)−1/2 [77]. As shown in figure 3(c), the Jc,H=0(t) is between the two curves corresponding to δTc and δl pinnings, respectively, but much closer and similar in shape to the δTc-pinning curve. Using Jc,H=0(t) = xJδTcc,H=0(t) + (1 − x)Jδlc,H=0(t), the experimental data can be fitted very well with x = 0.74(2), suggesting that both δTc and δl pinnings play roles in the quenched KxFe2−ySe2 single crystals, but the former mechanism is dominant. The dominant effect of δTc pinning also implies that the main pinning centers lead to the distribution of Tc in their vicinity or might even be non-superconducting, like Y2O3 and Y–Cu–O precipitates in YBa2 Cu3O7−x thin films [78]. Although the Jabc of quenched KxFe2−ySe2 single crystals is enhanced significantly when compared to the as-grown samples, it is still smaller than in FeTe0.61Se0.39 and other iron pnictide superconductors [73, 74]. There might be more room to improve the current-carrying capacity for AFeCh-122 superconductors in the future using methods such as A site ionic disorder and nanometer-scale second phases.
It should be noted that if the phase separation scale is microns or even larger, the insulating region could have some effect on the calculation of the absolute values of Jc. This is because the volume of insulating phase has been used to calculate the Jc from M − H curve, i.e., the real Jc values might be even larger than the calculated ones. However, the phase separation should have minor effects on the field and temperature dependences of Jc, i.e. the pinning mechanism should not be affected by this type of phase separation. If the phase separation is in the nanometer range, as it has been observed in KxFe2−ySe2 by transmission electron microscopy [75], the effects on Jc are similar to what has been discussed above regarding the pinning mechanism. The insulating second phase can be considered as the pinning center, similar to nanometer-scale BaZrO3 inclusions in YBCO coatings on metals [76].
3.2. GBs properties of iron-based superconductors
For practical applications, especially for fabrication of superconducting wires and tapes, superconductors are usually made in the polycrystalline bulk or thin-film form. Therefore, besides enhancement of Jc by various artificial pinning centers in the grains, i.e. enhancement of intragrain properties, the GBs properties are also of great interest for the applications of iron-based superconductors.
There are two studies so far on the Ba(Fe,Co)2As2 epitaxial thin films deposited on bicrystal substrates (figure 8) [79, 80]. Both show that the Jc across bicrystal grain boundary (BGB) has an exponential dependence on GB misorientation angle θ, indicating a weak-link effect for high-angle BGBs. However, the critical GB misorientation angles θc are different: about 6° and about 10° [79, 80]. According to the study of Katase et al, the slopes of the exponential decay are much smaller than those for YBCO BGBs, and the critical angle is approximately 9–10°, which is substantially larger than that of YBCO (∼3–5°, inset of figure 8(a)) [80, 81]. Larger critical angle suggests smaller constraints for the in-plane orientation for substrate or buffer layers to obtain high-Jc iron-based superconducting films on flexible metal substrates. This observation will certainly be advantageous for tape applications. Similar study is lacking in iron selenide superconductors, and therefore related studies on FeCh-11 or AFeCh-122 films will be of interest to understand the GB properties.
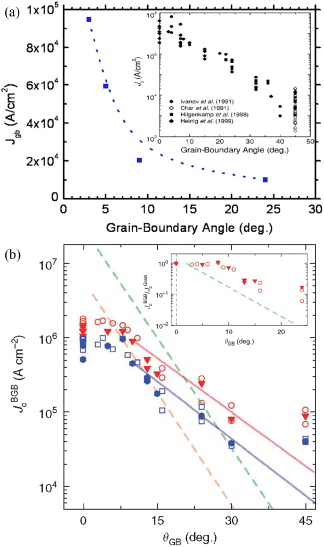
Figure 8. (a) Dependence of the intergrain Jc,gb(12 K, 0.5 T, θ) on the misorientation angle θ for Ba(Fe,Co)2As2 BGB junction. Inset shows the Jc, gb(θ) for YBCO. (b) Jc, gb(θ) for Ba(Fe,Co)2As2 BGB junctions grown on [001]-tilt bicrystal substrates of MgO (open symbols) and (La,Sr)(Al,Ta)O3 (filled symbols) at 4 K (red symbols) and 12 K (blue symbols). The red and blue solid lines are fitted to the empirical equation of  . The average data of the YBCO BGB junctions taken at 4 and 77 K are indicated by the green and orange dashed lines, respectively. The inset shows the ratio of the intragrain Jc, g and Jc, gb to θGB at 4 K on MgO (open circle) and (La,Sr)(Al,Ta)O3 (filled triangle) bicrystals, respectively. The dashed green line shows the result of the YBCO BGB junctions. (a) Reprinted with permission from [79]. Copyright 2009 by the American Institute of Physics. (b) Reprinted with permission from [80]. Copyright 2011 by the Macmillan Publishers Ltd: Nature Commun.
Download figure:
Standard image3.3. Iron chalcogenide superconducting wires and tapes
After the discovery of iron-based superconductors, the trials for fabrication of iron-based superconducting wires were immediately carried out [82–84]. There are two methods to prepare iron-based superconducting wires and tapes, power-in-tube (PIT) and coated conductor techniques.
PIT technique has been used widely in Bi-based cuprate oxide wires (first-generation high-temperature superconductor (HTS) wires) and MgB2 [85, 86]. Ozaki et al [87] fabricated Fe(Se,Te) wires by an ex situ PIT method with the transport Jc(0) of about 64 A cm−2 at 4.2 K. Recently, chemical-transformation PIT method was used to fabricate FeSe wires with a transport Jc(0) of 588 A cm2 at 4.2 K for a three-core wire (figure 9(a)) [88]. Although the Jc is enhanced considerably, it is much smaller than that of iron arsenic superconducting wires prepared using PIT method. For example in (Ba,K)Fe2As2 the Jc(0) reaches 1 × 10⁴ A cm−2 at 4.2 K [89]. But it should be noted that the Jc for both iron chalcogenide and iron arsenic superconducting wires fabricated using PIT method are much smaller than those of single crystals [48, 63, 74], implying that the texturing of grains in wires is important due to the GB weak-link effect.

Figure 9. (a) Field dependence of Jc(B) for single-core and three-core FeSe wires. (b) Jc(B) and (c) Fp(B) of FeSe0.5Te0.5 thin films at 4.2 K compared with the results of other superconducting wires or tapes. Solid lines in (c) are the fitting results using the Dew-Huges's scaling law. (a) Reprinted with permission from [88]. Copyright 2011 by the IOP Publishing. (b) Reprinted with permission from [90]. Copyright 2011 by the American Institute of Physics.
Download figure:
Standard imageCoated conductor technique has been successfully developed for the YBCO coated conductors (second-generation HTS wires) to overcome the weak-link effect [61]. The FeSe0.5Te0.5 thin films deposited on Hastelloy substrates, on which an MgO buffer layer has been formed by ion beam assisted deposition (IBAD), exhibit a nearly isotropic Jc(0) exceeding 2 × 10⁵ A cm−2 at 4.2 K and still higher than 1 × 10⁴ A cm−2 at a magnetic field as high as 25 T (figure 9(b)) [90]. This gives the superior property in high fields (⩾20 T) when compared to Nb3Sn or Ni–Ti wires. The fitting of field dependency of the Fp using Dew-Huges scaling law yields q ∼ 2 and p ∼ 1 (figure 9(c)), similar to KxFe2−y(Se,S)2 and quenched KxFe2−ySe2 [67, 70]. This suggests that the point-defect core pinning is dominant due to the inhomogeneous distribution of Se and Te [90]. In the core-pinning regime, Fp is a product of the individual Fp, ind and the pinning center density n. This implies that the Jc of FeSe0.5Te0.5 thin films can still be enhanced by simply adding more defects to act as pinning centers [90]. Moreover, the weak-link effect of FeSe0.5Te0.5 may not be as severe as that of YBCO. Although the IBAD substrates have many low-angle GBs in the textured MgO template, the Jc(0) of FeSe0.5Te0.5 thin films on IBAD-MgO with in-plane misorientation angle Δϕ = 4.5° is just a little lower than that of thin films deposited on LaAlO3 single-crystal substrate [90]. These results should be confirmed with further studies of the thin films grown on controlled bicrystal substrates. On the other hand, depositing FeSe0.5Te0.5 thin films directly on textured metal tapes may be possible because FeSe0.5Te0.5 thin films are prepared in vacuum unlike YBCO-coated conductors. This considerably simplifies the synthesis procedure and reduces production costs [62]. A similar study on the Ba(Fe,Co)2As2 thin films deposited on IBAD-MgO-buffered Hastelloy substrates shows that the Jc(0) is (1.2–3.6) × 106 A cm−2 at 2 K with Δϕ ∼3°, regardless of the larger Δϕ (5.5–7.3°) of the MgO buffer layers [91]. It is much larger than that of Ba(Fe,Co)2As2 wire prepared by PIT method and comparable to that on MgO single crystals and remains at 1 × 10⁶ A cm−2 at T ⩽ 10 K [89, 91]. This observation is consistent with the fact that the Δϕ of Ba(Fe,Co)2As2 is much smaller than the θc = 9° [91]. These results demonstrate that the coated conductors technique is a promising method to fabricate iron-based superconducting tapes for high field applications.
4. Upper critical fields
The upper critical field μ0Hc2 is one of the most important superconducting parameters which provides valuable information on fundamental superconducting properties, such as coherence length, anisotropy, details of underlying electronic structures and dimensionality of superconductivity as well as insights into the pair-breaking mechanism. Iron-based superconductors usually have very high μ0Hc2 and exhibit rich variety of temperature dependence of μ0Hc2(T).
4.1. Pair breaking mechanisms and multiband effects on μ0Hc2
The s wave Cooper pair is formed by two electrons that attract together with opposite spins and momenta. External magnetic fields contributes to depairing via two primary mechanisms (figure 10(a)) [92]. One is the orbital pair breaking mechanism. The Lorentz force acts on paired electrons with opposite momenta and the superconductivity is destroyed when the kinetic energy exceeds the condensation energy of the Cooper pairs. Another mechanism is the Pauli paramagnetic pair breaking. When the Pauli spin susceptibility energy (Zeeman energy) exceeds the condensation energy as shown in figure 10(b), the singlet pair with opposite spins is broken into unbound triplet along the field direction (Zeeman effect, also called spin-paramagnetic effect).

Figure 10. (a) Schematics of depairing mechanism of a singlet Copper pair via the external magnetic field. (b) Schematic field dependences of the Gibbs free energies of the normal state and superconducting state in a type-II superconductor. The free-energy curve of the normal state without Zeeman energy is the upper horizontal line, crossing the free-energy curve of a type-II superconductor at B*c2. The free-energy curve of the normal state including Zeeman energy is the red line, crossing the free-energy curve of a type-II superconductor at Bpc2 and the zero-field free-energy curve of the superconducting state (lower horizontal line) at the Pauli limiting field Bp. Reprinted with permission from [92]. Copyright 2009 by the IOP Publishing.
Download figure:
Standard imageThrough the Maki parameters α (see below) and λso [93], the effects of Pauli spin paramagnetism and spin-orbital scattering have been included in the Werthamer–Helfand–Hohenberg (WHH) theory for a single-band s wave weak-coupled type-II superconductor in the dirty limit [94]. The μ0Hc2(T) is given by

where ψ(x) is digamma function, γ ≡ [(αh)2 − (λso/2)2]1/2 and

If the orbital effect is dominant (α = 0) and the spin-orbital scattering is negligible (λso = 0), the equation can be simplified as

which describes the temperature dependence of orbital limited upper critical field μ0H*c2(T). At zero temperature it becomes

On the other hand, if we only consider the spin-paramagnetic effect alone, the zero-temperature Pauli limiting field μ0Hp(0) (Chandrasekhar–Clogston limit field for a weakly coupled superconductor) is [95, 96]

where Δ is the s wave superconducting gap. Including strong-coupling corrections in the BCS theory due to electron–phonon and electron–electron interactions gives [92, 97]

Here ηΔ describes the strong coupling intraband correction for the gap, I is the Stoner factor I = N(EF)J, N(EF) is the electronic density of states (DOS) per spin at the Fermi energy EF, J is an effective exchange integral, ηib is introduced to describe phenomenologically the effect of the gap anisotropy, λep is electron–phonon coupling constant and ε = 0.5 or 1 [92, 97, 98].
When compared to the orbital pair breaking effect, the relative contribution of the Pauli paramagnetic pair breaking effect is quantified by the Maki parameter
 /Hp(0). When α > 1, the spin-paramagnetic effect becomes essential [93] and the actual upper critical field μ0Hc2(0) is given by

In the single-band clean limit, the Maki parameter α is given by [40]


where vab and vc are the Fermi velocities in the ab plane and along the c-axis, respectively, m is the electron effective mass and m0 is free electron mass. For conventional single-band BCS superconductors, because of m ∼ m0, vab ∼ vc, and low Tc, the α is usually small, i.e. the orbital pair breaking mechanism is dominant. On the other hand, for some exotic superconductors, such as heavy fermion superconductors with m ≫ m0 or organic superconductors with large ratio of vab/vc, the condition of α > 1 can be easily satisfied and the spin-paramagnetic effect is dominant. When α is large enough and superconductors are in the clean limit, the Fulde–Ferrell–Larkin–Ovchinnikov (FFLO) state may appear, resulting in a non-zero momentum of the Cooper pairs and the spatial oscillations of the superconducting order parameter [99, 100].
On the other hand, for the superconductors with several disconnected Fermi surfaces, the multiband effects on the μ0Hc2 should be considered. The most famous example is MgB2 where the μ0Hc2 can be described successfully using the two-band BCS model in the dirty limit [101, 102].
In the dirty limit, taking into account both orbital and spin-paramagnetic effect with interband and intraband scattering contributions, the μ0Hc2(T) is given by

where t = T/Tc0, and


D1 and D2 are intraband diffusivities of the bands 1 and 2; λ11 and λ22 are the intraband couplings in the bands 1 and 2, and λ12 and λ21 describe the interband couplings between bands 1 and 2; γ12 and γ21 are interband scatting rates between band 1 and 2. If neglecting interband scattering (γ12 = γ21 = 0), we obtain

where ![$U[x]=\mathrm {Re}\left[\psi \left(\frac {1}{2}+x\right)-\psi \left(\frac {1}{2}\right)\right]$](https://content.cld.iop.org/journals/1468-6996/13/5/054305/revision1/stam455430ieqn6.gif) , h = μ0Hc2D0/(2Φ0T), D0 = μBΦ0/π = ℏ2/2m is quantum diffusivity, k = D1/D0, η = D2/D1. When the spin-paramagnetic effect is negligible (D0 ≪ D1,2), Hc2 can be simplified to
, h = μ0Hc2D0/(2Φ0T), D0 = μBΦ0/π = ℏ2/2m is quantum diffusivity, k = D1/D0, η = D2/D1. When the spin-paramagnetic effect is negligible (D0 ≪ D1,2), Hc2 can be simplified to

Moreover, for η = 1, equation (28) can be further reduced to equation (10) [93, 94].
4.2. Features of μ0Hc2(T) in iron arsenic superconductors
All parameters of equations (15) and (16) that might lead to a large α exist in iron-based superconductors [40], therefore the spin-paramagnetic effect needs to be considered. Furthermore, there are several disconnected electron and hole sheets at the FS that originate from the hybridized d-orbitals of iron [29]. This suggests that the multiband effect on the μ0Hc2(T) should also be taken into account. For iron arsenic superconductors, due to the different contributions of multiband and spin-paramagnetic effects, there are various temperature dependences of μ0Hc2(T) for different systems (see the review paper about this topic [103] and references therein). Figure 11 shows several typical μ0Hc2(T) dependences in iron arsenic superconductors. FePn-1111 system (LnFeAs(O,F), figure 11(a)) shows a pronounced upturn curvature in μ0Hc2,c(T) at low temperatures. In contrast, μ0Hc2,ab(T) exhibits a downturn curvature with decreasing temperature [51, 104]. Both can be explained within a two-band theory with a high diffusivity ratio of electron band to hole band, but the spin-paramagnetic effect also needs to be considered, especially for H∥ab [51, 104, 105]. For the FeAs-122 system (A(Fe,Co)2As2, figure 11(b)), the upturn curvature of μ0Hc2,c(T) present in FeAs-1111 system does not appear, but it still shows a positive curvature at temperatures far below Tc without saturation. On the other hand μ0Hc2,ab(T) tends to saturate with decreasing temperature [106, 107]. This can also be interpreted using a two-band theory with a larger diffusivity ratio of two bands when compared to FePn-1111 system [106, 107]. Similar to FePn-1111 system, the spin-paramagnetic effect may also have some effect on the μ0Hc2,ab(T) [107]. For KFe2As2 and LiFeAs (figures 11(c) and (d)), both μ0Hc2,ab(T) and μ0Hc2,c(T) show saturation trends at low temperatures with different negative curvatures. The former can be ascribed to the spin-paramagnetic effect and the latter is mainly determined by the orbital-limited field in the one-band scenario [108, 109].

Figure 11. Temperature dependence of μ0Hc2(T) for (a) polycrystalline LaFeAsO0.89F0.11, (b) Sr(Fe,Co)As2 thin film, (c) KFe2As2 single crystal and (d) LiFeAs single crystal. (a) Reprinted with permission from [104]. Copyright 2011 by the Macmillan Publishers Ltd: Nature. (b) Reprinted with permission from [106]. Copyright 2009 by the American Physical Society. (c) Reprinted with permission from [108]. Copyright 2009 by the Physical Society of Japan. (d) Reprinted with permission from [109]. Copyright 2011 by the American Physical Society.
Download figure:
Standard image4.3. Features of μ0Hc2(T) in iron chalcogenide superconductors
Both multiband and spin-paramagnetic effects contribute to μ0Hc2(T) in iron chalcogenide superconductors. However, the multiband effect is much weaker when compared to iron arsenides, and the spin-paramagnetic effect is usually the dominant factor.
In Fe(Te,Se) (as shown on examples of Fe1.02Te0.61Se0.39 (Se-39) and Fe1.05Te0.89Se0.11 (Se-11) in figures 12(a) and (b)) both μ0Hc2(T) for H∥ab and H∥c can be explained well using the WHH model with spin-paramagnetic effect when neglecting spin-orbital scattering. It indicates that the spin-paramagnetic effect is the dominant pair-breaking mechanism for both H∥ab and H∥c [110, 111, 114]. For the Fe(Te,Se) in the clean limit (grown by Bridgman–Stockbarger technique) the μ0Hc2(T) is Pauli limited. This may suggest the emergence of the FFLO state at low temperatures [114]. The dominance of spin-paramagnetic effect in Fe(Te,Se) may be due to the disorder induced by Te(Se) substitution/vacancies and excess Fe in Fe(2) site [92, 115]. For Se-39, more Se doping introduces more disorder than in Se-11. This effect could contribute to the larger αH∥ab of Se-39 when compared to Se-11. However, it cannot explain the inverse trend of αH∥c. Therefore, another effect must compete with disorder. It may be the effect of excess Fe in Fe(2) position, which is the unique feature of 11-system, different from other Fe pnictide superconductors. The Fe(2) has larger local magnetic moment than Fe(1) in Fe-(Te,Se) layers. The Fe(2) moment is present even if the SDW antiferromagnetic ordering of the Fe plane is suppressed by doping or pressure, contributing to N(EF) [25]. According to equation (13), μ0Hp(0) can be decreased if the Stoner factor increases via enhancement of J or N(EF). Excess Fe in Fe(2) site with local magnetic moment could interact with itinerant electron in Fe layer, resulting in exchange-enhanced Pauli paramagnetism or Ruderman–Kittel–Kasuya–Yosida (RKKY) interaction, thus enhancing J. Hence, higher content of excess Fe in Se-11, could lead to larger αH∥c than in Se-39. Another possibility may be that the N(EF) is decreased with increasing the content of Se [116]. This trend will also enhance the Pauli-limited field, i.e. suppress the spin-paramagnetic effect.
As shown in figure 12(c), spin-paramagnetic effect is also dominant in μ0Hc2(T) of S-09 with larger α and obvious spin-orbital scattering [117], when compared to Se-39 and Se-11. The spin-paramagnetic effect should have the same origin as in Se-39 and Se-11 due to disorder. Moreover, since the N(EF) of FeS is larger than that of FeSe, [116], it is likely that the N(EF) of S-09 is larger than that of Fe(Te,Se) with the same doping content. This will lead to the smaller μ0Hp(0), i.e. larger α. On the other hand, non-zero λso can also be explained via increasing Kondo-like scattering from excess Fe in Fe(2) site, consistent with the definition of λso, which is proportional to the spin-flip scattering rate [93, 94]. It is also consistent with the Kondo behavior of S-09 in the normal state, related to the excess Fe in Fe(2) that act as the Kondo-like impurities [117]. The presence of Kondo-type interactions in binary iron chalcogenides, first inferred from the normal-state scattering and μ0Hc2(T) behavior, has later been confirmed by the neutron scattering measurements [118].

Figure 12. Temperature dependence of μ0Hc2(T) for (a) Fe1.02Te0.61Se0.39, (b) Fe1.05Te0.89 Se0.11, (c) Fe1.14Te0.91S0.09 and (d) FeSe single crystals. Insets: the anisotropy γ of μ0Hc2(T). (a) and (b) Reprinted with permission from [110]. (c) Reprinted with permission from [117]. Copyright 2010 by the American Physical Society. (d) Reprinted with permission from [119]. Copyright 2012 by the American Physical Society.
Download figure:
Standard imageFurthermore, the evaluated mean free path of S-09, l = 1.35 nm using the Drude model l = ℏ(3π2)1/3/(e2ρ0n2/3), suggests that S-09 is a dirty-limit superconductor since l/ξ(0) = 0.396 [117]. Therefore, the FFLO state at high fields is unlikely in S-09 because the short mean free path will remove any momentum anisotropy [99, 100].
The μ0Hc2,H∥(101)(T) of FeSe single crystal at low temperatures is larger than the value evaluated from the WHH theory with α = 0 and λso = 0 (figure 12(d)) [119], which is distinctively different from Fe(Te,Se) and Fe(Te,S) where the WHH curve is far above the experimental data. The enhancement of the μ0Hc2(T) at low temperatures and high fields implies that the multiband effect is not negligible. By using the coupling constants, determined from muon spin resonance (μSR) experiment with very small interband coupling [120], the μ0Hc2,H∥(101)(T) data from both rf and resistivity measurements can be very well explained using a two-band model with η = 0.40. It is similar to the value of FeAs-122 but much larger than that of other two-band iron-based superconductors, such as FeAs-1111 [51, 104]. Large η leads to the absence of the upturn of μ0Hc2(T) at low temperatures, which is observed in FeAs-1111 superconductors [51, 104], but not in FeAs-122 compounds [106]. We have also performed simulations for different values of coupling constants: (i) dominant intraband coupling, w > 0 and (ii) dominant interband coupling, w < 0. The different sets of fitting parameters results in almost identical result, fitting the experimental data well (figure 12(d)). The derived η is in the range of 0.32–0.44, suggesting that the fitting results are insensitive to the choice of coupling constants. Thus, either interband and intraband coupling strength are comparable or their difference is below the resolution of our experiment. On the other hand, assuming μ0Hc2(T = 0.35 K) ≈ μ0Hc2(0), the μ0Hc2(0) are 17.4(2) and 19.7(4) T for H∥(101) and H⊥(101), respectively. Given the electron–phonon coupling parameter λe−ph = 0.5 (typical value for weak-coupling BCS superconductors) [121], the Pauli limiting field μ0Hp(0) = 1.86Tc(1 + λe−ph)1/2 is 19.8 T [97]. This is nearly the same as the μ0Hc2,H⊥(101)(T = 0.35 K) and larger than value for H∥(101). It suggests that the spin-paramagnetic effect might also have some influence on the μ0Hc2(T), but should not be the dominant effect. The situation is rather different in Fe(Te,Se) and Fe(Te,S) where the spin-paramagnetic effect governs μ0Hc2(T) [110, 117]. The existence of two bands is also confirmed from the Hall measurement [119].
The anisotropy of μ0Hc2(T), γ(T) (=Hc2,ab(T)/Hc2,c(T)) (insets of figures 12(a)–(c)) decreases with decreasing temperature, reaching ∼1 for all Fe(Te,Se) and Fe(Te,S) compounds. Similar results have been reported in the literature [66, 122]. These results show that Fe(Te,Se) and Fe(Te,S) are high-field isotropic superconductors. When T is close to Tc, the γ of Se-11 is smaller than that of Se-39 but larger than in Fe(Te,S). Although the behavior of γ(T) is similar in Fe(Te,Se)/Fe(Te,S) and FeAs-based superconductors, the value is smaller in the former compounds [103]. For FeSe, the γ(T) (=Hc2,H⊥(101)(T)/Hc2,H∥(101)(T)) is nearly constant and close to 1, but it is difficult to compare this with other FeCh-11 superconductors due to the differences of the orientation.
In AFeCh-122 superconductors, the slopes of μ0Hc2(T) near Tc0, dμ0Hc2(T)/dT|T=Tc(∼6–10 T K−1) are similar to those in FeCh-11 materials for H∥ab but are much smaller (∼1–3 T K−1) than in the latter for H∥c (figure 13) [60, 110, 117, 123–125]. The larger Tc compared to FeCh-11 superconductors leads to the significantly larger Hc2(0) evaluated from equation (11) for H∥ab. The μ0Hc2(0) values are usually ∼125–275 T and ∼30–60 T for H∥ab and H∥c, respectively [60, 123, 125].

Figure 13. Temperature dependence of μ0Hc2(T) near Tc0 for (a) K0.64Fe1.44Se2, (b) Rb0.8Fe1.68Se2, (c) Cs0.81Fe1.61Se2 and (d) Tl0.58Rb0.42Fe1.72Se2 single crystals. (b) Reprinted with permission from [123] and (c) Reprinted with permission from [124]. Copyright 2011 by the American Physical Society. (d) Reprinted with permission from [123]. Copyright 2011 by the European Physical Society.
Download figure:
Standard imageRecent studies on the μ0Hc2(T) of K0.8Fe1.76Se2 and Tl0.58Rb0.42Fe1.72Se2 single crystals up to 60 T show that μ0Hc2(T) for H∥c presents an almost linear temperature dependence and slight upturn at low temperatures, whereas the curve of μ0Hc2(T) for H∥ab has a convex curvature with a much larger value and gradually tends to saturate at low temperatures (figure 14) [60, 126]. The μ0Hc2(T) for H∥c is slightly larger than the value predicted with equation (11) at low temperatures, but is smaller than the theoretical one for H∥ab. For H∥ab, fitting with equation (8) yields α = 5.6 and λso = 0.3, indicating that the spin-paramagnetic effect may play an important role in suppressing superconductivity for H∥ab [60]. On the other hand, the enhancement of μ0Hc2(T) for H∥c at low temperatures may be related to the multiband effect [60]. These behaviors are very similar to those of FeAs-1111 and FeAs-122, but not FeCh-11 compounds. In K0.8Fe1.76Se2, the γ(T) increases with temperature and finally decreases gradually with decreasing temperature. But in Tl0.58Rb0.42Fe1.72Se2, the γ(T) decreases with temperature in the entire measurement range with larger values when compared to K0.8Fe1.76Se2. Similar to other iron-based superconductors, the decrease of γ(T) with temperature may be related to the multiband effect or to the gradual setting in of pair breaking by the spin-paramagnetic effect, which requires μ0Hc2,ab = μ0Hc2,c in the low-temperature and high-field limit [103]. On the other hand, the γ(T) values in K0.8Fe1.76Se2 and Tl0.58Rb0.42Fe1.72Se2 are much larger than those in FeCh-11 materials. This difference could be related to the decrease of dimensionality when compared to FeCh-11 superconductors.

Figure 14. Temperature dependence of μ0Hc2(T) up to 60 T for (a) K0.8Fe1.76Se2 and (b) Tl0.58Rb0.42Fe1.72Se2 single crystals. (a) Reprinted with permission from [126]. Copyright 2011 by the American Physical Society. (b) Reprinted with permission from [60]. Copyright 2012 by the American Physical Society.
Download figure:
Standard imageFor both FeCh-11 and AFeCh-122 superconductors, doping on Fe site is usually detrimental for superconductivity [127, 128]. On the contrary, in FeAs-based superconductors doping on Fe site is beneficial as it induces superconductivity in compounds such as Ba(Fe,Co)2As2 [8]. In FeCh-11 materials, doping on Ch site enhances superconductivity [16, 17], whereas it has an opposite trend in AFeCh-122 where S and Te doping decreases Tc [68, 129]. However, the suppression of superconductivity is far less strong when compared to doping on Fe site.
As shown in figure 15(a), the lattice parameters decrease with S doping due to the smaller ionic size of S2− than Se2−. The trend of lattice contraction approximately follows the Vegard's law. In addition, doping S into Se site does not lead to random Fe occupation of Fe1 and Fe2 sites. The refinements within single-phase I4/m crystallographic space group show that the Fe1 site has a low occupancy, whereas the Fe2 site is almost fully occupied. Besides KxFe2−yS2, all other crystals show metallic behavior with resistivities below  at temperatures above Tc (figure 15(b)). It should be noted that the temperature of
  varies non-monotonically with the doping level of S(z), implying that the temperature of crossover may be influenced by both K and Fe deficiencies. Shoemaker et al [130] found that the temperature dependence of resistivity in the normal state can be described well by a two-phase model containing metallic and insulating phases. This result suggests that the metal-semiconductor crossover can be also partially related to the two-phase coexistence in KxFe2−ySe2, i.e. the phase separation in the samples, which has been observed by various measurement technique [32–38]. On the other hand, the crystal with z = 2 is semiconducting even if the Fe deficiency is smaller than in the other samples. Whether there is also phase separation in KxFe2−yS2 needs to be investigated in the future.

Figure 15. (a) Unit cell parameters as a function of S substitution. Inset: crystal structure of KxFe2−ySe2−zSz in I4/m unit cell with vacant Fe1 sites marked light red and Fe2 sites marked dark purple. (b) Temperature dependence of the in-plane resistivity ρab(T) of the KxFe2−ySe2−zSz in zero field. Inset: temperature dependence of ρab(T) below 40 K for 0 ⩽ z ⩽ 1.2. (c) Temperature dependence of χ(T) at μ0H = 0.1 T for H∥c for zero-field cooling (ZFC) and FC, respectively. (d) Magnetic and superconducting phase diagram of KxFe2−ySe2−zSz. Green, blue and orange colors show semiconducting, magnetic and superconducting regions, respectively. Red symbols denote spin glass transitions. Reprinted with permission from [68]. Copyright 2011 by the American Physical Society.
Download figure:
Standard imageThe changes in the ground state phase diagram of KxFe2−ySe2−zSz are due to the sulfur doping and should not be influenced by the microscopic phase separation. If KxFe2−ySe2 shows superconducting behavior, the Tc is always above 30 K and is never below 30 K [75]. It means that the Tc is not sensitive to the compositional fluctuation of K or Fe once superconductivity appears. So, the gradual decrease of Tc in KxFe2−ySe2−zSz is difficult to ascribe to compositional fluctuations due to the phase separation. In contrast to  , the Tc is monotonically suppressed to lower temperature with the increase in S and cannot be observed above 2 K for z ⩾1.58. The superconductivity of KxFe2−ySe2−zSz single crystals with z < 1.58 is confirmed by the magnetization measurement (figure 15(c)). The Curie–Weiss temperature dependence is absent for all samples above 50 K as shown in figure 15(c). Magnetic susceptibilities are weakly temperature dependent with no significant anomalies above 50 K. This suggests the presence of low-dimensional short-range magnetic correlations and/or a long-range AFM order above 300 K. Interestingly, non-superconducting samples show bifurcation between the ZFC and FC curves for both field directions, suggesting spin glass (SG) transition at low temperatures in the 1.58 ⩽ z ⩽ 2 range. The magnetic and superconducting phase diagram of KxFe2−ySe2−zSz is shown in figure 15(d). Semiconductor-metal crossover can be traced for 0 ⩽z ⩽ 1.58 at high temperatures. In this z region, KxFe2−ySe2−zSz is a superconducting metal at low temperatures. For z = 1.58, ρ(T) is metallic with no superconducting Tc down to 2 K. For 1.58 ⩽ z ⩽ 2, we observe a drop in χ − T curves that could be related to a SG transition. For z = 2, the KxFe2−ySe2−zSz becomes a small-gap semiconductor with no metallic crossover and with a SG transition below 32 K.
The gradual changes of Tc are difficult to explain only by the slight variation of Fe and K contents, because usually the superconductivity appears with higher Fe content when K content (x) < 0.85 [131, 75]. As opposed to this trend, the KxFe2−ySe2−zSz crystals with larger z values have higher Fe contents but lower Tc, indicating that Tc is not only governed by K/Fe stoichiometry or vacancies. The local environment of Fe profoundly changes with S doping, inducing the changes in band structure and physical properties. In the KxFe2−ySe2−zSz crystal structure refined in I4/m space group, Fe atoms have block-like distribution where four Fe2 sites form a square around Se atom, making a cluster distinct from Fe1 site with low occupancy (inset of figure 15(a)) [31]. Therefore there are Fe1–Fe2 distances as well as intra- and inter-cluster Fe2–Fe2 distances. All cluster distances are unchanged with S doping whereas the Fe1–Fe2 distances decrease significantly (figure 16(a)). A similar magnetization behavior above 50 K and rather different superconducting Tc values as S content varies from 0 to 2 coincide with the nearly unchanged Fe2–Fe2 bond lengths. This result shows that superconductivity is insensitive to the size of Fe2–Fe2 clusters whereas the unchanged high-temperature magnetism could be related to the unchanged Fe2–Fe2 bond lengths. On the other hand, the SG behavior arising at low temperatures for non-superconducting samples can be explained by the non-zero random occupancy of Fe1 (vacancy) site for a higher S content (figure 16(b)), randomly changing the inter-cluster exchange interactions [132].
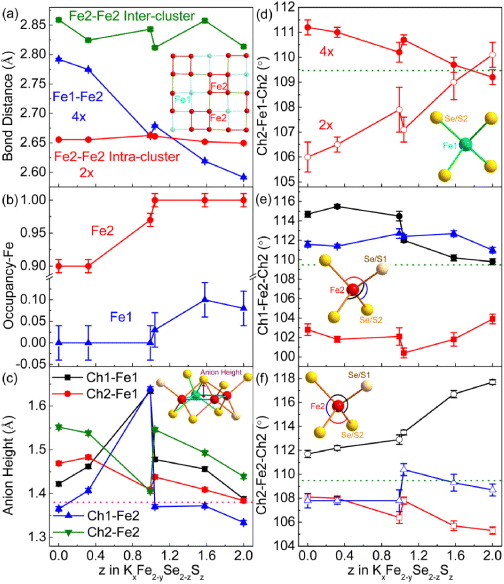
Figure 16. (a) Bond lengths between Fe sites. Inset shows top view of Fe layer. (b) Occupancy of Fe1 and Fe2 sites. (c) Anion height. Inset shows side view of Fe–Ch sheet. (d) Ch2–Fe1–Ch2, (e) Ch1–Fe2–Ch2 and (f) Ch2–Fe2–Ch2 bond angles of KxFe2−ySe2−zSz as a function of S substitution, x. Insets of (d–f) show Fe–Ch tetrahedron for Fe1–Ch1 and Fe2–Ch1(2). The dotted pink line in (c) shows the optimal bond lengths for Tc. The dotted green lines in (d–f) indicate the optimal angle for Tc. Reprinted with permission from [68]. Copyright 2011 by the American Physical Society.
Download figure:
Standard imageThe correlation of Tc with the anion height between Fe and Pn (Ch) layers was empirically observed. There is an optimal distance (∼1.38 Å) with a maximum Tc ∼ of 55 K [133]. This seems to be invalid in KxFe2−ySe2−zSz materials, where there are two Fe and two Ch sites and four Fe–Ch heights. There is no monotonic decrease as Tc is tuned to 0, whereas both Se and S end members have rather similar anion heights (figure 16(c)). The bond angle α between Pn(Ch)–Fe–Pn(Ch) is more instructive since Tc in iron pnictides is optimized when Fe–Pn (Ch) tetrahedron is regular (α = 109.47°) [134]. In KxFe2−ySe2−zSz, the Ch2–Fe1–Ch2 angle changes toward the optimal value with increasing S content (figure 16(d)), but the local environment of Fe2 site exhibits inverse trend. Among six angles in the Fe2–Ch1(2) tetrahedron, three (Ch1–Fe2–Ch2) are nearly unchanged with S doping (figure 16(e)). The other three (Ch1–Fe2–Ch1) change significantly (maximum 6°) and deviate from optimal value from Se-rich to S-rich side (figure 16(f)). Hence, the increasing distortion of Fe2–Ch tetrahedron with S doping is closely correlated to the suppression of Tc. This distortion may lead to carrier localization, decreasing the density of states at the Fermi energy, which is confirmed by the measurement of thermal properties as discussed below. Therefore, the regularity of Fe2–Ch1(2) tetrahedron is an important structural factor governing the formation of the metallic states in KxFe2−ySe2−zSz, and consequently the Tc.
Thermal properties indicate that the density of states at the Fermi energy decreases with S doping, resulting in the suppression of correlation strength [135, 136]. As shown in figure 17(a), the suppression of Tc with the increase of sulfur concentration is confirmed by the shift of transition temperature where the Seebeck coefficient S becomes 0 because Cooper pairs carry no entropy in the superconducting state. The diffusive Seebeck response of a Fermi liquid dominates and is expected to be linear versus temperature in the zero-temperature limit, with a magnitude proportional to the strength of electron correlations in the simple Boltzmann picture [137]. This is similar to the temperature linearity of electronic specific heat, Ce/T = γ. In a one-band system both can be described by


where e is the electron charge and TF is the Fermi temperature, which is related to EF and N(EF) (=3n/2EF = 3n/kBTF) [137]. For superconducting crystals, the Seebeck coefficient in the normal state is independent of magnetic field and exhibits a linear relationship with temperature which can be fitted using equation (29) very well in the low-temperature range (figure 17(a)). With S doping, S/T is suppressed from −0.48 μV K−2 to a very small value of ∼0.03 μV K−2 for crystals without superconducting transition. Similar to S/T, the electronic Sommerfeld coefficient in the normal state γn is also gradually suppressed with the increase in sulfur content (inset of figure 17(b)). According to equations (29) and (30), S/T and γn are related to n and N(EF). Since sulfur has an identical electronic configuration to selenium, there should be no simple change in the carrier concentration with sulfur doping because the elemental analysis is consistent with full occupancy of Se (S) sites [68]. The absolute value of the dimensionless ratio of the Seebeck coefficient to specific heat, q = NAveS/Tγn, where NAv is the Avogadro number, gives the carrier density n. The values of q do not exhibit significant change [136]. Therefore, the suppressions of S/T and γn reflects a suppression of N(EF).
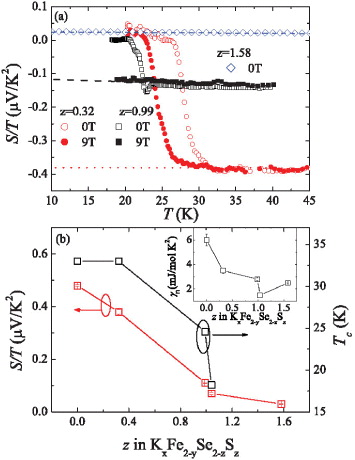
Figure 17. (a) Temperature dependence of the Seebeck coefficient divided by T, S/T, for KxFe2−ySe2−zSz with z = 0.32, 0.99 and 1.58 under 0 T (open symbols) and 9 T (solid symbols), respectively. The dashed lines are the linear fitting results. (b) The relationship between the zero-temperature extrapolated value of S/T (open circle) and Tc (open square) to S concentration z. The inset shows the relationship between the Sommerfeld coefficient γn and z. Reprinted with permission from [136]. Copyright 2011 by the American Physical Society.
Download figure:
Standard imageThe ratio of Tc to TF characterizes the correlation strength in superconductors. In unconventional superconductors, such as CeCoIn5 and YBa2Cu3O6.67, this ratio is about 0.1, but it is only ∼0.02 in BCS superconductors, such as LuNi2B2C [135]. In Fe1+yTe1−xSex, Tc/TF it is also near 0.1, pointing to the importance of electronic correlations [138]. The ratio Tc/TF ∼ 0.04 for K0.64Fe1.44Se2 implies a weakly correlated superconductor [135] when compared to Fe1+y Te1−xSex. A theoretical study pointed out that the ordered Fe vacancies could induce band narrowing and consequently decrease the correlation strength needed for the Mott transition [139]. With increasing sulfur content, the value of Tc/TF decreases further [136]. This implies a suppression of electron correlation strength as the system is tuned toward semiconducting states. The effective mass m, derived from kBTF = ℏ2k2F/2m, is also suppressed with the increase in S content, consistent with the decrease of correlation strength with S doping [136].
S doping affects not only Tc and properties in the normal state, but also μ0Hc2(T). As shown in figure 18(a), with S doping, for K0.70Fe1.55Se1.01S0.99 (S-99), dμ0Hc2(T)/dT|T=Tc is 2.74(7) and 0.649(7) T K−1 for H∥ab and H∥c, respectively, and for K0.76Fe1.61Se0.96S1.04 (S-104), dμ0Hc2(T)/dT|T=Tc is 3.15(4) and 0.499(4) T K for H∥ab and H∥c, respectively [140]. Both are much smaller than in K0.64Fe1.44Se2 (S-0). Therefore, the μ0Hc2(T) values obtained with equation (10) are significantly smaller than those in S-0 for both field directions. Using λe−ph = 0.5, the Pauli limiting field μ0Hp(0) = 1.86Tc(1 + λe−ph)1/2 is 53.5 and 41.0 T for S-99 and S-104, respectively. Both values are larger than extrapolated μ0Hc2,c(0) using equation (11) for S-99 and S-104. It should be noted that for the μ0Hc2,c(T) of S-99 and S-104, there is no upturn at low temperatures when compared to undoped AFeSe-122 materials [60, 126]. Moreover, the fits using simplified WHH theory are rather satisfactory for temperatures far below Tc for H∥c for both S doped samples. All this implies that for S-99 and S-104 the spin-paramagnetic and multiband effects are negligible when the magnetic field is applied along the c-axis. This is different from undoped AFeSe-122 materials [60, 126]. The changes of the μ0Hc2,c(T) with S doping could be due to the changes of band structure. Experiments in higher field and lower temperature are needed to shed more light on the behaviors of μ0Hc2,ab(T).

Figure 18. (a) Temperature dependence of μ0Hc2(T) for K0.64Fe1.44Se2 (S-0), K0.70Fe1.55Se1.01S0.99 (S-99) and K0.76Fe1.61Se0.96S1.04 (S-104) single crystals. Scaling behavior of the ρab(T,μ0H) versus μ0Hs = μ0H(cos2 θ + γ2sin2 θ)1/2 for (b) S-0, (c) S-99 and (d) S-104 at different magnetic fields and temperatures. The insets in (b–d) show the temperature dependence of γ(T) determined using GL theory for S-0, S-99 and S-104, respectively. Reprinted with permission from [140]. Copyright 2011 by the European Physical Society.
Download figure:
Standard imageTo characterize the evolution of the anisotropy γ(T) with S doping near Tc, the angular-dependent resistivity ρab(θ,μ0H,T) is measured at various magnetic fields and temperatures, where θ is the angle between the direction of external filed and the c-axis of the samples. According to the anisotropic Ginzburg–Landau (GL) model, the effective upper critical field μ0HGLc2(θ) can be represented as [141]

where γ = Hc2,ab/Hc2,c = (mc/mab)1/2 = ξab/ξc. Since the resistivity in the mixed state depends on the effective field H/HGLc2(θ), the resistivity can be scaled with H/HGLc2(θ) and data should collapse onto one curve in different magnetic fields at a certain temperature when a proper γ(T) value is chosen [141]. Figures 18(b)–(d) show the relation between resistivity and scaling field μ0Hs = μ0H(sin2θ + Γ2cos2θ)1/2 for S-0, S-99 and S-104, respectively. Good scaling is obtained by adjusting γ(T). The temperature dependence and value of γ(T) for S-0 (the inset of figure 18(b)) are similar to reported results [126]. For S-99 and S-104, the γ(T) exhibits the same trend as that for S-0, i.e. increasing with temperature. However, the value increases gradually with increasing S content (figures 18(c) and (d)). It changes from ∼3 for S-0 to ∼6 for S-104. The larger anisotropy with increasing S content may suggest that the two-dimensional Fermi surface is becoming less warped with S doping [123].
4.4. Spin-paramagnetic effect in iron-based superconductors
According to equation (14), the Maki parameter α can be calculated as α = [(H*c2(0)/Hc2(0))2 − 1]1/2. It can be also obtained from the fitting using equation (8) or (27). We summarize the α of iron-based superconductors reported in the literature for H∥ab and H∥c (figure 19). There are three general trends for α: (i) αH∥ab are larger than αH∥c for all of superconductors, indicating that the spin-paramagnetic effect is weaker for H∥c than H∥ab. (ii) FeCh-11 shows the largest α for both field directions with α > 1, reflecting that the spin-paramagnetic effect is the dominant pair-breaking effect for both field directions. (iii) For FeAs-based superconductors where the spin-paramagnetic effect is considered, the αH∥ab are usually larger than 1 but the αH∥c are usually smaller than 1, implying that the spin paramagnetic effect is dominant for H∥ab. The larger αH∥ab when compared to αH∥c can be understood from equations (15) and (16). When assuming other parameters are the same for H∥ab and H∥c, if vab is larger than vc it will lead to the larger αH∥ab than αH∥c. Theoretical calculations confirms this assumption [42, 142]. On the other hand, assuming that the relaxation time of the conduction electrons τ is isotropic and independent of Fermi velocities, the anisotropy of resistivity in the normal state γρ(0) is proportional to <v2ab > FS/ < v2c > FS, where <··· > FS denotes the average on the FS [143]. The experimental results of γρ(0) also confirmed that vab is larger than vc [143]. Briefly, because of vi = ∂ k/∂ki, the cylinder-like Fermi surface in iron-based superconductors will usually result in vab ≫ vc, therefore αH∥ab larger than αH∥c. Moreover, in the case of a cylinder-like Fermi surface, the open electronic orbits along the c-axis at low temperatures will also make the orbitally limiting upper critical field unlikely [60]. On the other hand, the evolution of spin-paramagnetic effect in iron-based superconductors (FeCh-11, AFeCh-122 > FeAs-111 > FeAs-122 > FeAs-1111) can be partially related to the evolution of the enhancement of effective mass in these materials according to equations (15) and (16) (figure 20) [41]. Moreover, the low carrier density n in iron-based superconductors [42, 43], resulting in the smaller EF according to the free electron model, will also lead to the larger α.

Figure 19. Maki parameters α obtained from α = [(H*c2(0)/Hc2(0))2 − 1]1/2 or fitting using equation (8) or (13) in various iron-based superconductors for (a) H∥ab and (b) H∥c: Tl0.58Rb0.42Fe1.72Se2 [60], SmFeAsO0.8F0.2 [105], SmFeAsO0.85 [105], KFe2As2 [108], Fe1.02 Se0.61Te0.39 [110], Fe1.05Se0.89Te0.11 [110], FeTe0.6Se0.4 [112], LaO0.9 F0.1FeAs1−x [115], Fe1.14Te0.91S0.09 [117], Fe1.11Te0.6Se0.4 [122], Ba0.68K0.32Fe2As2 [144], SrFe1.85Co0.15As2 [145], LiFeAs [109, 146–148], EuFe2 As2 [149], FeSe0.5Te0.5 thin film [150], (Ba,K)Fe2As2 [150], Ba0.6K0.4Fe2As2 [151] and Ca10(Pt4As8)((Fe0.97Pt0.03)2As2)5 [152].
Download figure:
Standard image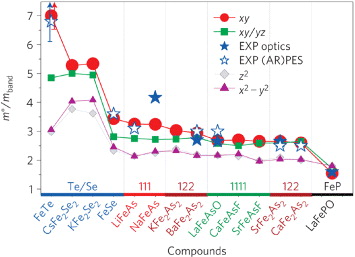
Figure 20. The mass enhancement m*/mband of the iron 3d orbitals in the paramagnetic state, calculated with the density functional theory and cellular dynamical mean field theory (DFT + CDMFT), and the low-energy effective mass enhancement obtained from optical spectroscopy experiments and (angle-resolved) photoemission spectroscopy experiments. Reprinted with permission from [41]. Copyright 2011 by the Macmillan Publishers Ltd: Nature Mat.
Download figure:
Standard imageWe now comment on the recently discovered phase separation in KxFe2−ySe2 crystals [32–38]. Since the wide-gap semiconducting phase is locked at high temperatures, (super)conductivity originates from the volume fraction of the sample that is conducting below the high-temperature structural transition. This should not have a major effect on μ0Hc2(T) phase diagrams, fits and estimate of mechanism of pair breaking in high fields. The values of Jc could be affected to some extent because the Bean model was applied to inhomogeneous samples. Yet, due to the rather small scale of phase separation and Josephson coupling that bridges insulating nanoislands [35], values of Jc represent a lower estimate of Jc and should be close to the intrinsic values for the superconducting phase. A similar argument can be applied for diffusion thermopower S and conclusions based on the correlation strength in the normal state since S does not depend on the sample geometry. In contrast, resistivity values represent the upper limit of ρ for the superconducting phase, similar to polycrystalline samples with grain boundary contributions.
5. Conclusions
In summary, iron chalcogenide superconductors now have Tc and μ0Hc2 values that are comparable to those of iron pnictide superconductors. Whereas the Jc are still low in KxFe2−ySe2 when compared to ternary arsenide superconductors, the μ0Hc2 values are in similar range. Because of the strong correlations present in the normal state and/or in the parent materials, spin-paramagnetic effects on μ0Hc2(T) are significant in binary FeCh-11 superconductors, probably masking multiband evolution of μ0Hc2(T). Enhanced spin-paramagnetic effects most likely originate from a Kondo-like interaction with the more localized Fe orbitals. This is in contrast to ternary AFeCh-122 materials where electronic correlations in the normal state are weaker and where much of the μ0Hc2(T) and vortex behavior is still unexplored due to extremely large upper critical fields and complex structural features.
Acknowledgments
We thank T P Murphy, E S Choi, D Graf and S W Tozer for useful discussions and experiment support at NHMFL and J B Warren for help with scanning electron microscopy measurement at Brookhaven Nation Laboratory. This work was carried out at the Brookhaven National Laboratory, which is operated for the US Department of Energy by Brookhaven Science Associates DE-Ac02-98CH10886. This work was in part supported by the US Department of Energy, Office of Science, Office of Basic Energy Sciences as part of the Energy Frontier Research Center (EFRC), Center for Emergent Superconductivity (CES) (HL and CP). A portion of this work was performed at the National High Magnetic Field Laboratory, which is supported by NSF Cooperative Agreement no DMR-0084173, by the State of Florida, and by the US Department of Energy.