
Abstract
The purpose of this study is to investigate and optimize the process parameters for bovine serum albumin (BSA) adsorption onto calcium bentonite (CaB) using the Box-Behnken experimental design method. Calcium bentonite was characterized using FT-IR, SEM, XRD, zeta potential measurements, and Boehm titration methods. The BSA adsorption capacity of calcium bentonite was modelled with respect to pH (2.8, 4.8, and 6.8), temperature (25 °C, 32.5 °C, and 40 °C), and initial protein concentration (0.1–1.2 mg ml−1) using the Box-Behnken experimental design method. The Design Expert 13.0 software was used to optimize the process conditions and obtain three-dimensional response surface graphs. A regression model, which gives the relationship between the process parameters and BSA adsorption capacity, was obtained using Design Expert software. The developed model showed that the most effective parameter on adsorption was the initial protein concentration followed by pH and temperature. The maximum adsorption capacity was obtained about 171 mg/g under optimal conditions (pH 4.8, 40 °C, and 1 mg ml−1 of initial BSA concentration). BSA adsorption onto CaB fit the pseudo-second order kinetic model. This study showed that process parameters for BSA adsorption can be effectively investigated and optimized using the Box-Behnken experimental design method with a fewer number of experiments.
Export citation and abstract BibTeX RIS

Original content from this work may be used under the terms of the Creative Commons Attribution 4.0 licence. Any further distribution of this work must maintain attribution to the author(s) and the title of the work, journal citation and DOI.
1. Introduction
The phenomenon of protein adsorption is an important process in the development of drug delivery systems, medical implants, and other biomedical applications. Bovine serum albumin (BSA) is commonly used as a model protein for studying the adsorption characteristics of various adsorbents, such as natural clays [1–7], zeolite [8, 9], carbon [10–13], alginate [14, 15], and chitosan [16]. Among these, natural clays and clay minerals have unique properties that make them particularly effective for protein adsorption due to their two-dimensional layered structure, swelling, and ion exchange properties [17]. Bentonite, a natural biocompatible material, is one such clay mineral that has good adsorption characteristics and can be used as an adsorbent for protein uptake.
Bentonite can interact with cations or with protein as well [7] and is widely used to separate proteins from wine due to its negatively charged structure [1]. Although overall negative basal surface charge of bentonite is balanced by the interlayer cations and is not effected by the pH of the solution, the charge at the bentonite layer edges is affected by the solution pH due to the protonation/deprotonation of silanol groups [2]. Clays also effect the solution pH by releasing cations during the hydrolysis of the structure [7]. The pH of the solution also determines the charge of the protein, which is positively charged below the isoelectric point (pI) and negatively charged above pI. The interactions between protein and bentonite are not only affected by the pH of the solution but also the presence of other ions [7] and the species of interlayer cation [3] as well as the initial concentrations of bentonite and protein, and temperature. In the literature, some researchers have explained these interactions between natural clays and BSA [1, 3, 5, 7] by using some spectrophotometric methods. However, so far, we have not come across any report related to the mathematical modelling and optimization of these parameters via experimental design methods. Fitting experimental data to the appropriate model is very important and is required for designing the process [18]. With experimental design methods, a higher amount of experimental data and their mathematical relationships can be obtained with fewer experiments. Moreover, the process parameters can be easily optimized using the experimental design methods. Box-Behnken experimental design, one of response surface methods, has many advantages in engineering [19] and is considered to be more proficient and powerful than full factorial design and central composite design [20].
The aim of this study was to model the adsorption of BSA onto calcium bentonite (CaB) using experimental design methodology. The effects of pH, temperature, and initial BSA concentration, as well as their interactions on BSA adsorption, were investigated using the Box-Behnken experimental design method, and the optimum process conditions were determined. The equilibrium adsorption data were modelled using a regression model with Design Expert 13.0 software (academic version). The kinetics of BSA adsorption were also modelled using theoretical models. The examination and modelling of adsorption in terms of equilibrium and kinetics provided important information for elucidating the adsorption mechanism.
2. Materials and methods
2.1. Materials
Sigma-Aldrich branded bovine protein (bovine serum albumin, BSA) with a molecular weight of 66 430 Da was used in the experiments. Commercial calcium bentonite (CaB) obtained from Ünye Madencilik (Ünye-Turkey) was sieved to a particle size of 150–500 μm and dehumidified at 105 °C overnight before using in adsorption experiments.
In order to prepare buffer solutions, Sigma-Aldrich branded, analytical grade sodium chloride (NaCl), monosodium phosphate (H2NaO4P), disodium hydrogen phosphate (HNa2O4P), phosphoric acid (H3PO4), sodium acetate (CH3COONa.3H2O), and glacial acetic acid (CH3COOH) were used.
2.2. Characterization of calcium bentonite
Surface morphology of Calcium Bentonite (CaB) was characterized by CamScan Announce the Apollo 300 Scanning Electron Microscope (SEM). For SEM analysis, the samples were coated with a thin gold layer with the help of an automatic spray coater under N2 atmosphere. The crystal structure of the CaB was investigated with the Philips Panalytical X'Pert Pro X-Ray Diffractometer device, in which x-rays were produced in CuKα tube at 45 kV and 40 mA values. NICOLET iS50 Fourier Transform Infrared (FTIR) Spectroscopy was used in order to determine the functional groups in the structure of CaB. Zeta potential measurements were performed on Zetasizer 3000 HSA (Malvern). In order to determine the ion exchange and adsorption properties of adsorbents, it is extremely important to analyse the functional groups in their structure. In order to determine the functional groups on the CaB surface, the titration method determined by Boehm [21, 22] was used.
2.3. BSA adsorption studies via experimental design
3-factor 3-level Box-Behnken experimental design (BBD), one of the response surface methods (RSM), was applied to examine the effect of pH, temperature and initial BSA concentration on BSA adsorption onto CaB. BSA adsorption studies were carried at different pH (2.8, 4.8, and 6.8), BSA concentration (0.1–1.2 mg ml−1) and temperature (25 °C–40 °C), which were designated as X1, X2 and X3, respectively in BBD plan. These factors and coded levels selected for the experimental design were given in table 1.
Table 1. Factors and levels for BBD experimental design.
| Factors | |||
|---|---|---|---|
| Coded levels | X1 (pH) | X2 (C0 , mg/ml) | X3 (T, °C) |
| −1 | 2.8 | 0.2 | 25 |
| 0 | 4.8 | 0.6 | 32.5 |
| 1 | 6.8 | 1.0 | 40 |
The number of experiments (N) required for the design is calculated as N = 2k(k−1)+n, where k is the number of factors and n is the number of experiments repeated in center point. BBD plan consisting of 15 experiments was created and adsorption experiments were performed accordingly (table 2). 0.1 g of CaB was weighed and added to 20 ml of BSA solution in 50 ml Erlenmeyer flasks. Adsorption experiments were conducted under isothermal conditions by shaking at 130 rpm in a shaker for 1 h. To maintain a constant pH during the adsorption studies, BSA solutions were prepared in the appropriate buffer solutions. Specifically, 50 mM sodium phosphate buffer, 10 mM sodium acetate buffer, and 100 mM sodium phosphate buffer were prepared to achieve pH values of 2.8, 4.8, and 6.8, respectively. After adsorption took place, the mixtures were filtered and the BSA concentration in the filtrate was determined at 280 nm wavelength via Analytic Jena Specord 120 UV Spectrophotometer. BSA adsorption capacity was calculated by using equation (1).

where, qe is the adsorption capacity at equilibrium (mg/g); C0 is initial BSA concentration (mg/mL); Ce is BSA concentration at equilibrium (mg/mL); V represents the volume (mL) of the BSA solution and m is the amount of CaB (g). Each adsorption experiment was repeated three times and average values were presented.
Table 2. Box-Behnken experimental design plan and adsorption capacities.
| Run | X1 (pH) | X2 (C0, mg/mL) | X3 (T, °C) | qe,exp (mg/g) |
|---|---|---|---|---|
| 1 | −1 (2.8) | 1 (1.0) | 0 (32.5) | 67.694 |
| 2 | 0 (4.8) | 1 (1.0) | 1 (40) | 171.226 |
| 3 | 0 (4.8) | 0 (0.6) | 0 (32.5) | 87.957 |
| 4 | 0 (4.8) | 0 (0.6) | 0 (32.5) | 88.964 |
| 5 | 1 (6.8) | 0 (0.6) | 1 (40) | 46.031 |
| 6 | 0 (4.8) | −1 (0.2) | −1 (25) | 31.240 |
| 7 | 1 (6.8) | 0 (0.6) | −1 (25) | 7.461 |
| 8 | 0 (4.8) | 0 (0.6) | 0 (32.5) | 91.808 |
| 9 | −1 (2.8) | 0 (0.6) | 1 (40) | 50.500 |
| 10 | −1 (2.8) | 0 (0.6) | −1 (25) | 56.450 |
| 11 | 1 (6.8) | 1 (1.0) | 0 (32.5) | 26.501 |
| 12 | 0 (4.8) | −1 (0.2) | 1 (40) | 30.804 |
| 13 | 0 (4.8) | 1 (1.0) | −1 (25) | 144.360 |
| 14 | −1 (2.8) | −1 (0.2) | 0 (32.5) | 27.202 |
| 15 | 1 (6.8) | −1 (0.2) | 0 (32.5) | 3.000 |
2.4. Modelling
The obtained experimental adsorption capacities were transferred to the Design Expert 13.0 software and then, regression model, which shows the relationship between the pH, BSA concentration, temperature and BSA adsorption capacity, was developed. Developed regression model were statistically evaluated with ANOVA (Analysis of Variance). The effects of pH, temperature and initial BSA concentration on BSA adsorption were also investigated by using three-dimensional surface graphics obtained from Design Expert. Optimum operating parameters were also determined by using optimization module in the software.
2.5. BSA adsorption kinetics
BSA solution at a concentration of 0.5 mg ml−1 was used for the kinetic study. 0.42 g CaB was added to the prepared 100 ml BSA solution, then, the mixture were shaken at 130 rpm at 25 °C. During the adsorption process, at the different time intervals, samples were taken from the mixtures with the aid of syringes and filtered through a 0.45 μm membrane filter. Each 1 ml sample taken was diluted by adding 5 ml of buffer solution at working pH, and then the BSA concentration was measured.
BSA adsorption capacities (qt) were calculated as in equation (2).

where qt is the adsorption capacity at time t (mg/g); C0 is the initial BSA concentration (mg/mL); Ct is the BSA concentration at time t (mg/mL); V represents the volume (ml) of the BSA solution and m is the amount of CaB (g).
Pseudo first order, pseudo second order and intraparticle diffusion kinetic models were examined in order to determine the rate expression of the adsorption process.
The pseudo-first order kinetic model is given by Lagergren as follows [23]:

where k1 denotes the first order rate constant (min −1), qe and qt are the adsorption capacities at equilibrium and time t (mg/g), respectively. By integrating equation (3) at t = 0, qt = 0 and t = t, qt = qt boundary conditions, equation (4) is obtained.

The pseudo-second order kinetic model equation is on the basis that adsorption includes chemical sorption [23] and its mathematical equation is;

where k2 denotes the second order rate constant (g/mg.min), qe and qt are the capacities at equilibrium and time t (mg/g), respectively. By integrating equation (5) at t = 0 → qt = 0 and t = t → qt = qt boundary conditions, equation (6) is obtained.

The intraparticle diffusion model was developed by Weber and Morris and is expressed as follows [24]:

where ki is intraparticle diffusion rate constant (mg/g. min2), C is a constant that gives information about the thickness of the layer formed between the adsorbent and the adsorbate. The rate constant ki and C are calculated from the slope and intercept point of qt − t1/2 graph, respectively.
3. Results and discussions
3.1. Characterization of calcium bentonite
Upon examination of the Scanning Electron Microscope (SEM) images of calcium bentonite (figure 1(a)), it is evident that it has a porous structure. The silicate layers in its structure are also clearly visible, as shown in figure 1(b). This layered structure is believed to be effective on the adsorption of Bovine Serum Albumin (BSA). The X-ray diffraction (XRD) pattern of calcium bentonite is shown in figure 2. The library of the XRD spectrometer device was used to identify that CaB is mostly in the montmorillonite structure.

Figure 1. SEM images of CaB (a): 1000x; (b): 20000x.
Download figure:
Standard image High-resolution image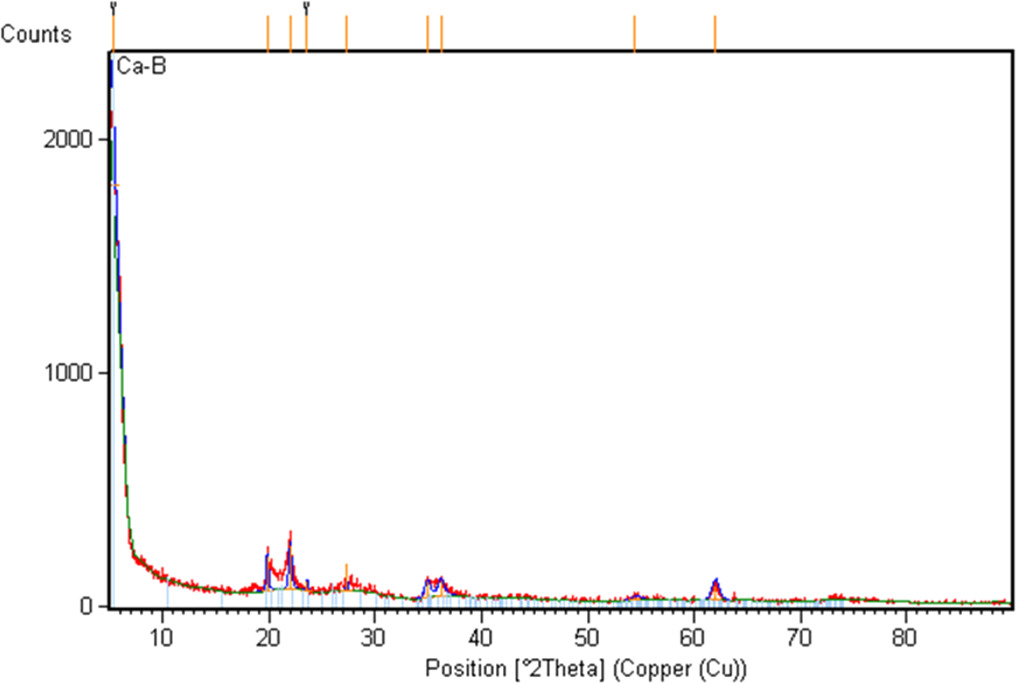
Figure 2. XRD graph of calcium bentonite.
Download figure:
Standard image High-resolution imageIn the FTIR spectrum of calcium bentonite (figure 3), a tension vibration band of water molecules attached to the Si-O surface with weak hydrogen bonds is observed at 3622 cm−1. A broad band of adsorbed water molecules was observed at 3402 cm−1. The band observed at 1633 cm−1 is the deformation band of the hydroxyl of water. The intensive peak observed at 1000 cm−1 is related to the Si–O tension vibration of Si–O–Si groups in the tetrahedral layer. The bands observed at 514 cm−1 and 448 cm−1 indicate the presence of octahedral Si–O–Al and Si–O–Si bending vibrations, respectively [25].

Figure 3. FTIR spectrum of calcium bentonite.
Download figure:
Standard image High-resolution imageThe change in zeta potential of calcium bentonite with pH was investigated graphically (figure 4), it is seen that CaB has negative zeta potential at all pH conditions. The amount of acidic and basic groups were determined via Boehm titration method, accordingly it was determined that CaB has 1.5 meq g−1 total basic surface groups, while there is only 0.3 meq g−1 total acidic surface group in it. The concentration of the total basic surface groups in the CaB structure is much higher than the acidic groups.
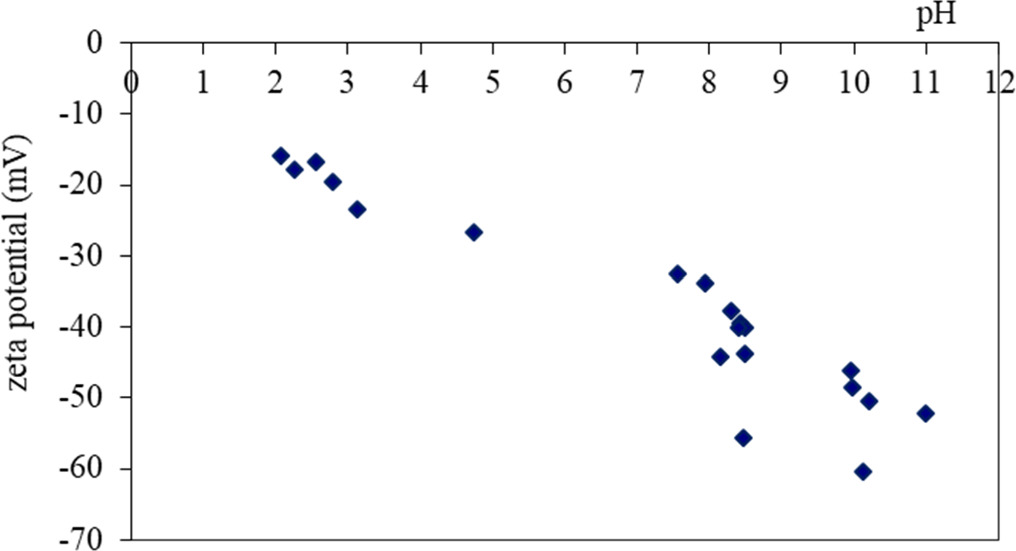
Figure 4. Zeta potentials of calcium bentonite.
Download figure:
Standard image High-resolution image3.2. BSA adsorption with Box-Behnken design approach
BSA adsorption onto CaB was experimented according to the Box-Behnken design matrix given in table 2. BSA adsorption capacities, qe,exp , obtained for each run can also be seen in table 2. The highest adsorption capacity was obtained as 171.226 mg g−1 with 1 mg ml−1 initial BSA concentration and pH 4.8 at 40 °C, while the lowest capacity was 3.000 mg g−1 with 0.2 mg ml−1 initial BSA concentration and pH 6.8 at 32.5 °C. The adsorption capacity values obtained at the center point (0 0 0) ranged from 87.956 mg g−1 to 91.808 mg g−1.
3.3. Development of regression model
BSA adsorption capacities were input to the Design-Expert software in order to develop regression model with the R2 value of 0.9998, which gives the relationship between the pH, BSA concentration, temperature, and adsorption capacity (equation (8)). In equation (8), X1, X2 and X3 represent the codded values of pH, initial BSA concentration and temperature, respectively. In order to analyse the effect of process parameters and their interactions, absolute values of the coefficients of the model were examined. As can be seen that the initial concentration (X2) is the most effective parameter with the highest coefficient, while the temperature (X3) is the least effective parameter with the smallest coefficient. The positive coefficient of the initial BSA concentration (X2) and temperature (X3) indicates that the adsorption capacity increases with the increase of the initial BSA concentration and temperature. On the other hand, the negative coefficient of solution pH (X3) indicates that the adsorption capacity decreases with an increase in pH.

3.4. Statistical analysis of developed model
The statistical significance of the developed model (equation (8)) was evaluated by using ANOVA analysis obtained from Design-Expert software. ANOVA analysis results of the developed model were given in table 3.
Table 3. ANOVA Results.
| Sum of squares | df | Mean squares | F-value | p-value | |
|---|---|---|---|---|---|
| Model | 32288.08 | 12 | 2690.67 | 674.56 | 0.0015 |
| X1 | 714.41 | 1 | 714.41 | 179.11 | 0.0055 |
| X2 | 16070.89 | 1 | 16070.89 | 4029.04 | 0.0002 |
| X3 | 174.64 | 1 | 174.64 | 43.78 | 0.0221 |
| X1X2 | 69.66 | 1 | 69.66 | 17.46 | 0.0528 |
| X1X3 | 495.57 | 1 | 495.57 | 124.24 | 0.008 |
| X2X3 | 186.35 | 1 | 186.35 | 46.72 | 0.0207 |
| X1 2 | 11755.41 | 1 | 11755.41 | 2947.13 | 0.0003 |
| X2 2 | 16.71 | 1 | 16.71 | 4.19 | 0.1773 |
| X3 2 | 178.79 | 1 | 178.79 | 44.82 | 0.0216 |
| X1 2X2 | 4505.38 | 1 | 4505.38 | 1129.52 | 0.0009 |
| X1 2X3 | 4.79 | 1 | 4.79 | 1.20 | 0.3874 |
| X1X2 2 | 16.93 | 1 | 16.93 | 4.25 | 0.1755 |
The p-value of the model was found to be 0.0015, which indicates that the model is statistically significant above 99.5% level. Adsorption capacities (qe,model) obtained by using developed regression model (equation 8) are presented in table 4 with the experimental adsorption capacities. Fitness of the experimental data to the model was evaluated using error values, which were calculated with the equation (9)

where, qe,exp and qe,model are the experimental and theoretical equilibrium adsorption capacity (mg/g), respectively. As can be seen in table 4, very small error values showed that the developed model to determine the BSA protein adsorption capacity is applicable in the selected operating ranges.
Table 4. Experimental and theoretical adsorption capacities.
| Run | X1 | X2 | X3 | qe, exp (mg/g) | qe, model (mg/g) | Error (%) |
|---|---|---|---|---|---|---|
| 1 | −1 | 1 | 0 | 67.694 | 67.394 | 0.44286 |
| 2 | 0 | 1 | 1 | 171.226 | 171.226 | 0.00018 |
| 3 | 0 | 0 | 0 | 87.957 | 89.576 | 1.84131 |
| 4 | 0 | 0 | 0 | 88.964 | 89.576 | 0.68829 |
| 5 | 1 | 0 | 1 | 46.031 | 46.032 | 0.00043 |
| 6 | 0 | −1 | −1 | 31.240 | 31.240 | 0.00051 |
| 7 | 1 | 0 | −1 | 7.461 | 7.460 | 0.01273 |
| 8 | 0 | 0 | 0 | 91.808 | 89.576 | 2.43080 |
| 9 | −1 | 0 | 1 | 50.500 | 50.499 | 0.00091 |
| 10 | −1 | 0 | −1 | 56.450 | 56.450 | 0.00058 |
| 11 | 1 | 1 | 0 | 26.501 | 26.500 | 0.00208 |
| 12 | 0 | −1 | 1 | 30.804 | 30.804 | 0.00120 |
| 13 | 0 | 1 | −1 | 144.360 | 144.360 | 0.00014 |
| 14 | −1 | −1 | 0 | 27.202 | 27.202 | 0.00176 |
| 15 | 1 | −1 | 0 | 3.000 | 2.999 | 0.00167 |
3.5. Optimization of process parameters
The Optimization module in the Design-Expert Software was used to determine the optimum process parameters. In the optimization process, it was aimed to maximize the BSA adsorption capacity by keeping the process parameters within the studied range (table 1). Accordingly, selected optimum process parameters are presented in table 5.
Table 5. Optimum process parameters.
| pH (X1) | C0, mg/mL (X2) | T, °C (X3) | qe,model (mg/g) | qe,exp (mg/g) | Error (%) |
|---|---|---|---|---|---|
| 4.8 (0) | 1.0 (+1) | 40 (+1) | 171.226 | 170. 351 | 0.0051 |
Adsorption experiments were carried out with the determined optimum process parameters, and compared with the adsorption capacity obtained from the model (table 5). It is clearly seen that the adsorption capacity obtained from the experiment performed at optimum pH, initial concentration and temperature values and the adsorption capacity obtained from the developed model are quite close to each other.
3.6. Response surface graphs
In order to observe the effect of process parameters on BSA adsorption capacity, response surface graphs obtained via Design Expert software were examined. BSA adsorption capacity (qe) in relation to pH and BSA initial concentration is presented in figure 5 as a response surface graph. As seen in the figure 5, BSA adsorption capacity increased up to pH 4.8, it reached its maximum value at this point, and then started to decrease. On the other hand, adsorption capacity showed a linear increase with the increasing initial BSA concentration. The maximum adsorption capacity (144.360 mg g−1) was observed at pH 4.8 with 1 mg ml−1 initial BSA concentration.

Figure 5. BSA adsorption capacity change with BSA concentration and pH.
Download figure:
Standard image High-resolution imageThe response surface graph relating BSA adsorption capacity with pH and temperature is shown in figure 6. Similarly, BSA adsorption capacity increased with pH until 4.8, then decrease with the further increase of pH. The maximum adsorption capacity (103.142 mg g−1) was obtained at pH 4.8 and at the highest temperature (40 °C). The response surface graph relating BSA adsorption capacity with temperature and initial concentration is shown in figure 7. The highest BSA adsorption capacity (171.226 mg g−1) was obtained at the point where the temperature (40 °C) and initial concentration (1 mg ml−1) were the highest.
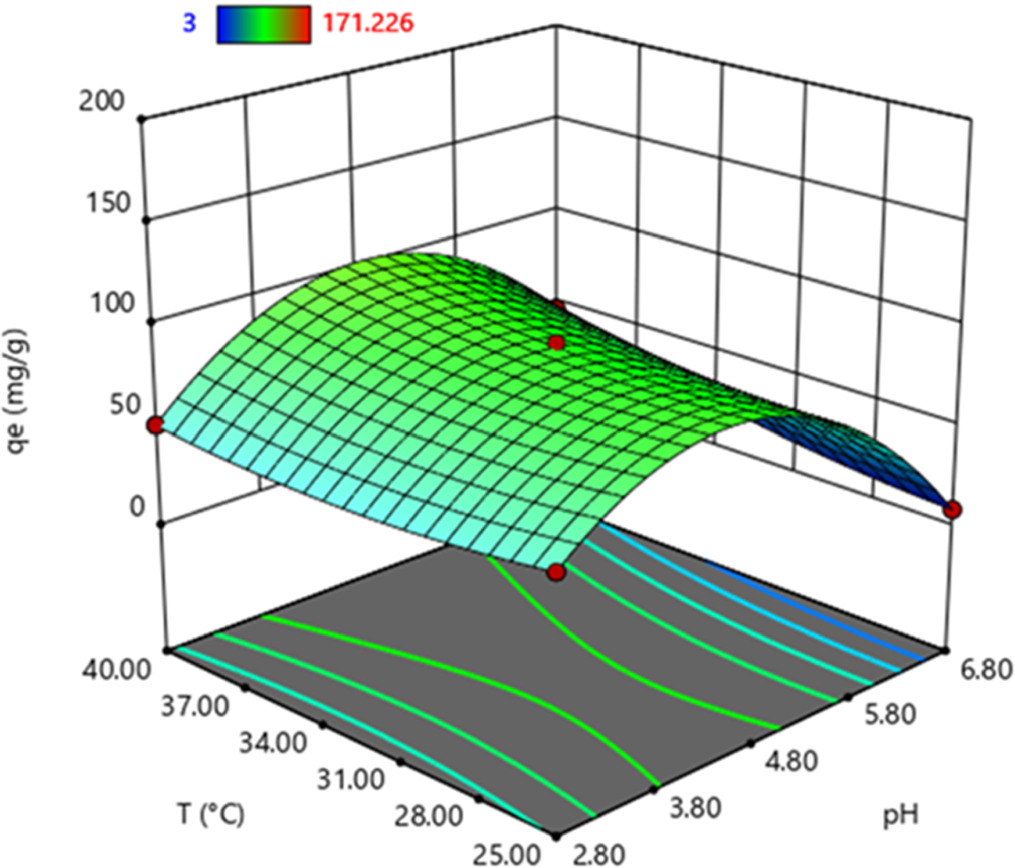
Figure 6. BSA adsorption capacity change with pH and temperature.
Download figure:
Standard image High-resolution image
Figure 7. BSA adsorption capacity change with BSA concentration and temperature.
Download figure:
Standard image High-resolution image3.7. Adsorption kinetics and kinetic modelling
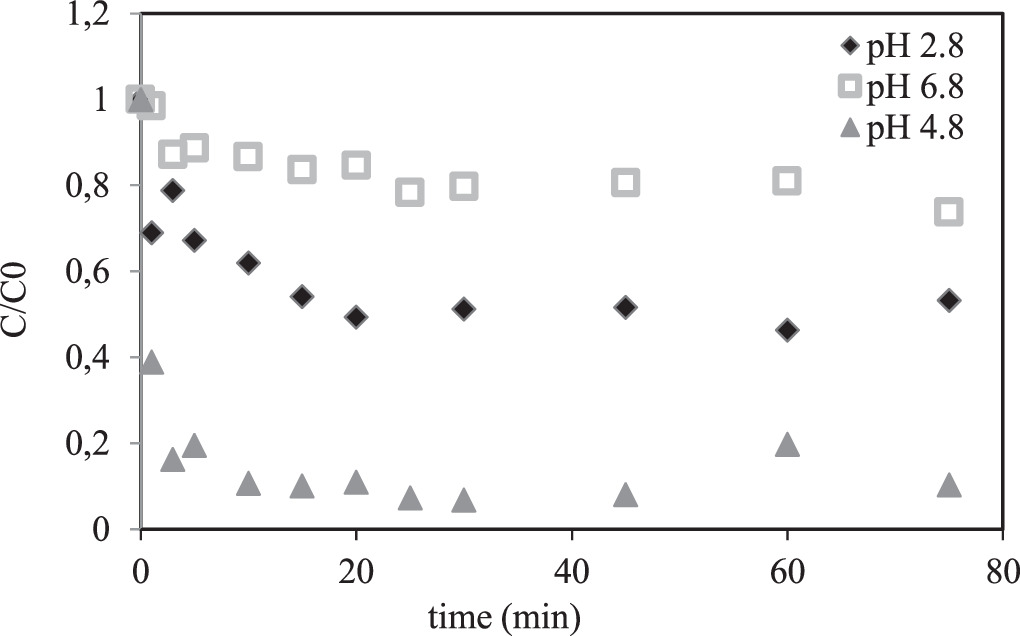
Variation of BSA concentration with time during the adsorption process is presented in figure 8. Adsorption process was completed in the first 20th, 15th and 10th minutes for pH 2.8, 4.8 and 6,8, respectively. As the pH increased, the equilibrium time decreased, indicating an increase in adsorption rate. However, the adsorption capacity also considerably decreased. Experimental data obtained from kinetic adsorption experiments were fitted to pseudo-first-order, pseudo-second-order kinetic models and intraparticle diffusion model. Pseudo-first order kinetic model was examined by plotting log (qe-qt) against time (not given). When the R2 values of the linearized Lagergren equation given in table 6 are examined, it is seen that the experimental results do not fit the first-order kinetic model. The compatibility of the adsorption kinetics of BSA on CaB to the intraparticle diffusion model was examined with the t1/2-qt plots, but no linear relationship was observed (not given). When the R2 values given in table 6 were also examined, it can be seen that the adsorption kinetics does not fit the intraparticle diffusion model as well.
Figure 8. Variation of BSA concentration with time.
Download figure:
Standard image High-resolution image
Table 6. BSA adsorption kinetic models' constants.
| pH | Pseudo-first order | Pseudo-second order | Intraparticle diffusion | |
|---|---|---|---|---|
| R2 | k2 (g/mg.min) | R2 | R2 | |
| 2.8 | 0.6039 | 0.0051 | 0.9917 | 0.7270 |
| 4.8 | 0.3455 | 0.00797 | 0.9942 | 0.7175 |
| 6.8 | 0.727 | 0.0166 | 0.9652 | 0.7388 |
The suitability of the pseudo-second order kinetic model for BSA adsorption on CaB was evaluated by plotting t/qt against time for all experimental conditions. Each plot displayed a linear curve with high R2 values (not shown). The second order adsorption rate constant (k2) and correlation coefficients are presented in table 6. Based on these results, it can be concluded that BSA adsorption onto CaB adheres to the pseudo-second order kinetic model, which indicates the chemical interactions. Similarly, Mucha et al (2020) showed that BSA adsorption kinetics onto bentonite followed by the pseudo-second order kinetic model [7]. Strong association between BSA and montmorillonite was described by Elovich model in another study [5]. As known that Elovich model suggests that the reaction on the heterogeneous surface determines the overall adsorption rate.
3.8. Effect of pH and adsorption mechanism
There is a considerable amount of BSA adsorption at pH 2.8. This can be explained with the electrostatic attraction between positively charged BSA and negative zeta potential of CaB (figure 4). However, interlayer cations (Ca2+) in the CaB can cause a repulsion between positively charged protein as well. Low BSA adsorption capacity of CaB can be explained with the electrostatic repulsion of negatively charged BSA and negative surface charge of CaB at pH 6.8.
The highest adsorption capacity was obtained at pH 4.8, which is the isoelectric point (pI) of BSA. It was reported in the literature that protein adsorption is higher at pH values close to the isoelectric point of BSA [1, 2, 25]. Tran et al [1] was reported that the adhesion forces between the protein and the adsorbent increased at the isoelectric point. BSA adsorption onto clays near isoelectric point seems to be very complex; there are some studies trying to illuminate clay and protein interactions around pI. Hydrophobic interactions may dominate the adsorption at this point. Proteins have almost the same amount of both positively and negatively charged surface group around pI. Due to the columbic attraction between the positive amino and negative carboxylic groups on BSA molecule, the protein structure becomes folded i.e. more compact [1], that may allow more protein molecules presence within the clay layers, which can be seen in figure 1(b). This structural change on BSA molecule adsorbed on montmorillonite was also observed in another study [3].
4. Conclusion
BSA adsorption onto calcium bentonite (CaB) was investigated with Box Behnken experimental design method under different experimental conditions. BSA adsorption capacity of CaB was modelled with respect to pH, temperature and initial BSA concentration by using Design-Expert software. The correlation coefficient (R2) of the developed model was found to be 0.9998. The initial BSA concentration with the largest coefficient was the most effective parameter, while the temperature with the smallest coefficient was the least effective parameter. Optimum process parameters for pH, temperature and initial BSA concentration were determined as 4.8, 40 °C and 1 mg ml−1, respectively. Accordingly, maximum BSA adsorption capacity was found as 171.226 mg g−1 at the optimum conditions. Layered and porous structure of CaB was effective on high BSA adsorption capacity. The effects of the process parameters were examined with the three dimension response surface graphs.
The literature and our findings demonstrate that the interaction between BSA and CaB cannot be described only physical interactions but also electrostatic interactions and hydrophobicity are effective. Maximum BSA adsorption was obtained at the isoelectric point of BSA, since the protein has a neutral surface charge at this point, hydrophobic effects can dominate this interaction. BSA molecules with the compact structure can easily penetrate within the CaB layers without any repulsion by the interlayer cations, resulted in high adsorption. Adsorption at below/above isoelectric point of BSA can be explained by the electrostatic attraction/repulsion between positively/negatively charged BSA and negative CaB liquid interface. BSA adsorption on CaB fitted to the pseudo-second order kinetic model very well that indicates the strong interations of BSA and CaB.
Acknowledgments
This study was supported by Yildiz Technical University Scientific Research Projects Coordinator with the project number of 2014-07-01-YL08.
Data availability statement
The data that support the findings of this study are available upon reasonable request from the authors.