

Abstract
A study was conducted to investigate the effect of an increase in the concentration of PbO on the structural, thermal, optical, and gamma ray shielding behavior of TeO2-CdO based glasses. The glasses were found to contain TeO4 and TeO3 units, as well as CdO metal oxide clusters, as indicated by the Raman spectrum. The glasses displayed minor weight loss (approximately 3%), suggesting high resistance to thermal degradation. With an increase in the concentration of PbO, the glass transition temperature (Tg), onset temperature (To), and crystallization temperature (Tc) all decreased. Additionally, the indirect band gap energy decreased from 3.497–3.337 eV as the lead oxide concentration increased. Moreover, the effects of PbO concentration on the linear attenuation coefficient (LAC) were investigated. The LAC values were found to be highest at 39.5 keV and decreased with increasing energy. As the PbO concentration increased, LAC values also increase. The Zeff displayed an inverse relationship with energy, except for an abrupt increase at 121.8 keV. The half value layer was found to be positively correlated with energy and varied with changes in PbO and CdO concentrations. The glasses demonstrated effective gamma radiation shielding properties, with the HVL remaining small even at higher energies, suggesting potential applications in industries such as medical imaging where thin shielding materials are preferred.
Export citation and abstract BibTeX RIS
1. Introduction
Gamma-rays having no mass and can readily travel at the speed of light over a distance of kilometers in vacuum. Given this circumstance, it is reasonable to assume that the most invasive and challenging to protect radiations are neutrons and gamma rays. Gamma rays can cause diseases of the skin or blood, as well as eye ailments and malignancies, thus it is crucial to protect against them [1–5].
Concrete is the most typical material used to insulate the reactors from radiation [6]. It is effective at both absorbing gamma rays and using elastic and inelastic scattering to slow down fast neutrons. The shielding from the gamma-rays is significantly improved by adding heavy materials to the concrete shield to increase its density [7]. Nuclear reactors are surrounded by a thick layer of concrete, which serves to both sustain the reactor and its associated equipment as well as shield the area from high level radiation released by the reactor. The main benefits of using concrete are that it is less expensive than other materials and can be customized for any type of construction design. Finding alternative materials to concrete for radiation shielding is required due to the material's numerous shortcomings. Concrete's variable composition and water content are the main disadvantages of using it as a radiation shielding material. Because of this variation, predictions of the radiation's spread and the shield's ability to dampen it are imprecise at best.
The thickness needed to cut gamma ray intensity in half is affected by the presence of heavy metals in radiation shielding materials. In light of this discussion, it's clear that advances in radiation shielding technology, such as heavy metal oxide (HMO) glasses, are urgently needed [8–11].
In consideration of this circumstance, scientists have looked into the idea of using glasses containing HMOs as gamma-ray shields [12–15]. In terms of technology, glass is crucial to industry, and it is obvious that modern life is impossible without glass. The most modern glass and optical substance for technological and radiation shielding purposes is lead glass. Lead glass is altered by the addition of various oxides, and the presence of distinct structural units and structural groups noticeably alters the glass' physical qualities [16–18]. Additionally, the high density of lead-containing glasses makes them ideal for use in the radiation shielding industry.
The addition of PbO, TeO2, and CdO to glass compositions can significantly impact the properties of the resulting glasses. PbO acts as a network modifier in glass compositions, leading to an increase in the number of non-bridging oxygen atoms and a decrease in the glass transition temperature [19]. TeO2, on the other hand, acts as a glass former and has a high refractive index, making it attractive for optical applications. Studies have shown that the addition of TeO2 to PbO-based glasses can improve their thermal stability and increase their refractive index, making them attractive for optical applications [20]. The presence of CdO can also affect the glass structure, resulting in changes in the density and molar volume [21]. Furthermore, the combination of PbO, TeO2, and CdO in glass compositions has been investigated for their potential in photonic applications. The addition of CdO can enhance their luminescence properties, while the addition of PbO and TeO2 can improve their nonlinear optical properties [22]. Overall, the addition of PbO, TeO2, and CdO to glass compositions can significantly impact their optical, structural, and thermal properties, making them attractive for various applications in optics, electronics, and energy storage.
In the recent works, we have studied the mechanical, structural properties using the x-ray diffraction (XRD) and Fourier Transform Infrared Spectroscopy (FTIR), optical properties using the derivative of absorption spectra fitting (DASF) method of PbO-TeO2-CdO glasses [23, 24]. In extension to the previous reporting's, in the present work, the structural behaviour is elaborated by Raman spectroscopy, thermal behaviour by thermogravimetric analysis (TGA) and differential scanning calorimetry (DSC), optical behaviour by Tauc's plot method and gamma ray shielding behaviour in the low energy range (39.5–295.9 keV) using the Phy-X software for the PbO-TeO2-CdO glasses.
2. Materials and methods
2.1. Preparation of samples
This section describes a highly detailed and meticulous method of synthesizing glasses made of three important oxides - lead oxide (PbO), tellurium oxide (TeO2), and cadmium oxide (CdO). To ensure a consistent mixture, the high-purity oxides were carefully mixed in an agate mortar. This process helps to achieve a homogeneous mixture of the components, which is a critical aspect of the synthesis process. The next step involved melting the mixture in a high-temperature muffle furnace at 980 °C. An alumina crucible was used to melt the mixture, and once it was molten, it was poured into a preheated graphite mould. The sample was annealed for two hours after the mould was put in an annealing furnace at 320 °C. After the annealing procedure, the sample was cooled to room temperature over the course of a day. The prepared glasses are displayed in figure 1.

Figure 1. Picture of the present glasses.
Download figure:
Standard image High-resolution imageThe resulting glasses were labelled P1, P2, P3, and P4, each having varying proportions of PbO, TeO2, and CdO, which resulted in different densities as:
P1: 70 PbO - 10 TeO2 - 20 CdO (density = 5.576 g/cm3)
P2: 72.5 PbO - 10 TeO2—17.5 CdO (density = 5.722 g/cm3)
P3: 75 PbO - 10 TeO2 - 15 CdO (density = 5.947 g/cm3)
P4: 77.5 PbO - 10 TeO2 - 12.5 CdO (density = 6.082 g/cm3)
To calculate the densities, Archimedes' principle was employed, which is a widely used and reliable method for measuring the densities of solid materials [25, 26].
2.2. Structural properties measurement
The Confocal Raman Spectrometer with PL (STR500Airix), available at Material Research Centre, Malaviya National Institute of Technology, Jaipur, Rajasthan, India, offers a range of advanced features for researchers and scientists. Its compact and flexible system configuration makes it an ideal choice for a variety of applications. With high resolution capabilities of less than 0.5 cm−1, it can accurately capture detailed molecular information. The system also boasts confocal optics and fully automated 2D, 3D, and 4D Raman imaging capabilities, allowing for precise spatial and temporal analysis. The STR500Airix is equipped with three lasers: 325 nm, 532 nm, and 785 nm, providing users with options for their specific experimental needs. The present data is recorded with 532 nm laser.
2.3. Thermal properties measurement
The Perkin Elmer's STA 6000, available at Material Research Centre, Malaviya National Institute of Technology, Jaipur, Rajasthan, India, is used for the thermal analysis. It is designed to perform simultaneous thermal analysis of materials by measuring their thermal properties, including weight change, heat flow, and temperature. The instrument is equipped with a dual-furnace system that allows it to perform TGA and DSC simultaneously. The TGA function of the instrument measures weight change in a sample, allowing the determination of thermal decomposition and stability of materials. The DSC function measures the amount of heat required to increase the temperature of a sample, providing information about the material's heat capacity and phase transitions. The STA 6000 is also equipped with advanced features that enhance its performance and reliability. The instrument has a high-resolution sensor that provides accurate and precise measurements, as well as a flexible furnace design that allows for quick and easy sample loading and unloading.
2.4. Optical properties measurement
The instrumentation employed in this part is the Perkin Elmer Lambda 19 UV–vis-NIR spectrophotometer, available at Material Research Centre, Malaviya National Institute of Technology, Jaipur, Rajasthan, India, which has the capability to measure electromagnetic spectra within the range of 180 to 3200 nm. Specifically, the UV–vis spectra within the wavelength range of 200 to 800 nm were acquired utilizing this equipment.
2.5. Gamma ray shielding measurement
The LAC, the simplest and most crucial radiation shielding factor to study, must be determined in order to determine how effectively a glass system can block photons. The LAC can be determined for any glass composition using a variety of methods, including (I) Monte Carlo simulations using some basic codes like FLUKA or Geant4 [27, 28], (II) experimental strategies utilizing lead equivalent thickness technique or any different appropriate arrangement [29], and (III) computer programs like Phy-X [30].
In order to obtain accurate findings using the first way, specialists who are experienced with simulation models and capable of writing exact input files that specify the experimental settings are needed. The second approach necessitates the use of an experimental laboratory, physical materials, and a number of radioisotopes. These variables can make experimental procedures often difficult, which forces researchers to examine some materials' efficacy utilizing free internet tools. The program WinXCom [31], created in 2004 by Gerward and his collaborators, is frequently used to determine the MAC for several kinds of materials, including concretes, polymers, ceramics and glasses [32]. It's crucial to note that this software is unable to determine any additional shielding parameters. Phy-X/PSD, a recent software tool created in 2020 by Sakar and his team, can, in comparison, evaluate 18 shielding factors with just a slight difference from experimental findings. The Phy-X software is running on a remote server with an Intel(R) Core(TM) i7-2600 CPU running at 3.40 GHz, 1GB of installed RAM, and Ubuntu 14.04.3 LTS as the operating system. NodeJS v8.4.0 is the application language, and Nginx 1.15.8 is the web server. In this work, we used Phy-X software to calculate the radiation shielding properties.
3. Results and discussion
3.1. Structural properties
The Raman spectra is depicted in figure 2. This composite exhibits several prominent peaks, including those at 138, 738, and 948 cm−1, as well as several minor peaks at 303, 401, 495, and 673 cm−1.

Figure 2. Raman spectra of the present samples.
Download figure:
Standard image High-resolution imageThe peak at 673 cm−1 is assigned to the Te-O-Te stretching vibrations of TeO4 trigonal bipyramidal units through oxygen located at axial position. This suggests the presence of TeO4 units, which are commonly found in tellurite glasses [33, 34]. In addition to the peaks mentioned above, the Raman spectrum of PbO-TeO2-CdO glasses also exhibited minor peaks at 495 cm−1 and 401 cm−1, which correspond to the bending vibrations of Te-O-Te chains [35]. These peaks are indicative of the presence of tellurite units in the glass structure. The peak at 303 cm−1 is related to the 2TA (L) mode of CdO. This suggests the presence of CdO in the composite, which is consistent with the composition of the glass. CdO is commonly used as a fluxing agent in glass production, as it can lower the melting point of the glass and promote the formation of a more homogeneous glass structure [36, 37]. The peaks at 388 and 673 cm−1 can be attributed to the presence of CdO2 and Cd(OH)2, respectively. These peaks suggest that there may be some oxidation or hydrolysis of the CdO in the glass [36, 37]. The vibrational band at 138 cm−1 indicates the presence of PbO in the ternary composite. This is consistent with the composition of the glass, which contains PbO as one of its components[38, 39]. The Raman band at 738 cm−1 shows the existence of [TeO3]2-/[TeO3+1]4- functional groups. This suggests the presence of TeO3 units in the composite, which are also commonly found in tellurite glasses. TeO3 units are known to play a critical role in determining the properties of tellurite glasses, such as their refractive index and thermal stability [39–42]. The second-order vibrational band at 948 cm−1 is related to the presence of CdO metal oxide in the ternary composite [37]. This band is particularly important because it provides evidence for the formation of metal oxide clusters in the glass.
Overall, the Raman spectrum of PbO-TeO2-CdO glasses provides important insights into the structure and properties of these materials. The presence of TeO4 and TeO3 units, as well as CdO metal oxide clusters, suggests that this composite may have unique optical and mechanical properties that make it suitable for a variety of applications, including optical fiber amplifiers, laser hosts, and nonlinear optical devices.
3.2. Thermal properties
TGA is a technique used to investigate the thermal stability of materials by measuring changes in their weight as they are heated. In the case of PbO-TeO2-CdO glasses, TGA was used to investigate the thermal stability.
The TGA plot (figure 3) of PbO-TeO2-CdO glasses displayed remarkable thermal stability, with only minor weight loss (approximately 3%) observed. This indicates that the composite is highly resistant to thermal degradation and can withstand high temperatures without significant changes in its structure or properties. The minor weight loss observed could be attributed to the loss of water molecules and/or volatile components that may be present in the composite [43].
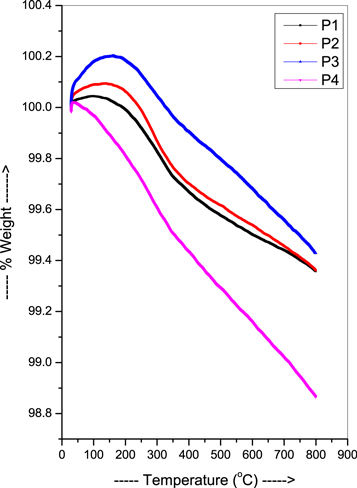
Figure 3. TGA plot of the present samples.
Download figure:
Standard image High-resolution imageThe high thermal stability of PbO-TeO2-CdO glasses makes them suitable for a range of high-temperature applications. For example, they could be used in the fabrication of high-temperature sensors, thermal imaging devices, and other electronic components that require materials with high thermal stability. Additionally, the TGA results suggest that PbO-TeO2-CdO glasses may have good chemical stability and resistance to environmental degradation, making them suitable for use in harsh environments.
The DSC analysis (figure 4, table 1) shows that the Tg, To, and Tc. One exothermic peak is observed for the P1 sample whereas two exothermic peaks are observed for the P2, P3 and P4 samples respectively as shown in figure 4. The Tg is the temperature at which a glass material changes from a hard and brittle state to a more fluid-like or rubbery state upon heating. The Tg, To, and Tc are important parameters that determine the thermal stability and processing conditions of glasses. The Tg, To, and Tc of this system all decrease with an increase in the concentration of PbO for the first exothermic peak whereas mixed behaviour is observed for the second exothermic peak [44]. The addition of PbO to the PbO-TeO2-CdO system causes a change in the glass network structure. PbO acts as a network modifier by breaking the bonds between TeO2 and CdO, which are network formers. PbO has a lower electronegativity than TeO2 and CdO, so it has a lower affinity for oxygen. This results in the formation of more NBOs. NBOs weaken the network structure by reducing the number of cross-links between the network formers. This leads to a decrease in the Tg of the PbO-TeO2-CdO system [44–46].
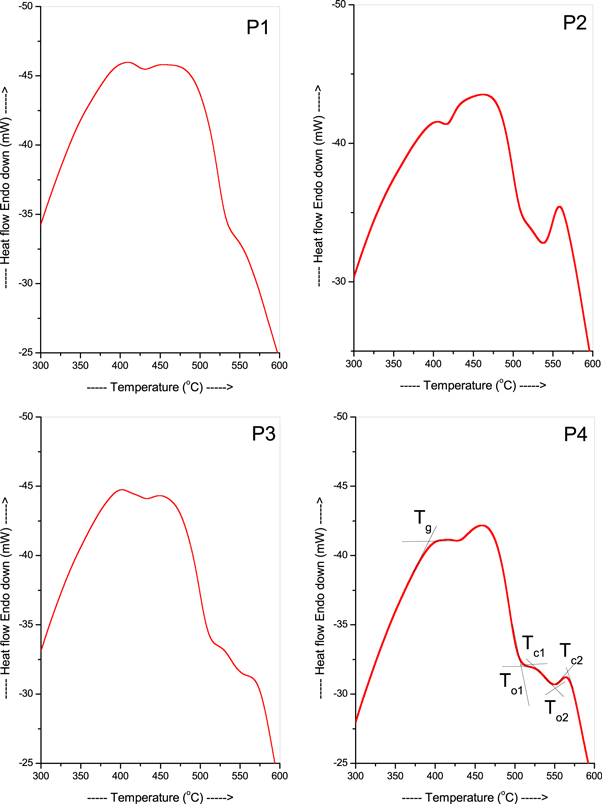
Figure 4. DSC plot for the present samples.
Download figure:
Standard image High-resolution imageTable 1. Thermal parameters for the present glasses.
| Sample Code | Thermal Parameters | ||||
|---|---|---|---|---|---|
| Tg(°C) | To1 (°C) | Tc1 (°C) | To2 (°C) | Tc2 (oC) | |
| P1 | 402 | — | — | 545 | 565 |
| P2 | 400 | 516 | 527 | 539 | 560 |
| P3 | 396 | 515 | 526 | 553 | 568 |
| P4 | 394 | 510 | 523 | 551 | 565 |
3.3. Optical properties
The section discusses the Tauc's plot (figure 5) of synthesized samples, which depicts the changes in the optical properties of PbO-TeO2-CdO glasses as lead oxide concentration increases and cadmium oxide decreases. It is observed that the band gap energy (Eg) decreases as lead oxide concentration increases, with values ranging from 3.497–3.337 eV. This pattern may be attributed to the structural changes in the glass network [47]. This band gap value further used to calculate other optical parameters which are displayed in table 2.

Figure 5. Tauc's plot for indirect energy band gap.
Download figure:
Standard image High-resolution imageTable 2. UV parameters of present glasses.
| Properties | Glass samples | |||
|---|---|---|---|---|
| P1 | P2 | P3 | P4 | |
| Eg (eV) | 3.497 | 3.437 | 3.388 | 3.337 |
| n | 2.275 | 2.288 | 2.299 | 2.312 |
| ε | 5.174 | 5.237 | 5.289 | 5.344 |
| Optical dielectric constant | 4.174 | 4.237 | 4.289 | 4.344 |
| RL | 0.152 | 0.154 | 0.155 | 0.157 |
| Rm(cm3 mol-1) | 20.647 | 20.489 | 20.048 | 19.937 |
| M | 0.418 | 0.414 | 0.412 | 0.408 |
| αm x 10−24 cm3 | 8.190 | 8.127 | 7.952 | 7.908 |
| αe x 1023 | 8.259 | 8.310 | 8.352 | 8.396 |
| T | 0.737 | 0.734 | 0.731 | 0.729 |
| M (Eg) | 0.087 | 0.086 | 0.085 | 0.083 |
| M (n) | 0.418 | 0.414 | 0.412 | 0.408 |
| χ* | 0.939 | 0.924 | 0.911 | 0.897 |
| χ(1) | 0.332 | 0.337 | 0.341 | 0.346 |
| χ3 × 10⁻¹⁵(esu) | 2.587 | 2.479 | 2.393 | 2.307 |
| n2 optical × 10−14(esu) | 4.285 | 4.082 | 3.921 | 3.759 |
As lead content increases, the refractive index(n), dielectric constant (ε), optical dielectric constant, and reflection loss (RL) values increase, with values ranging from 2.275–2.312, 5.174–5.344, 4.174–4.344, and 0.152–0.157, respectively. The increasing behavior of these parameters suggests the formation of NBOs in the glass network, which increases with lead oxide content [48]. In contrast, the transmission coefficient (T) decreases from 0.737–0.729, which behaves oppositely from reflection loss [49]. The molar refractivity (Rm) value is dependent on the polarizability of the glass matrix, which increases as non-bridging oxygen increases, making the glass network more polarized. This factor affects the value of the molar polarizability(αm) and electronic polarizability (αe) [50]. According to Dimitrov and Komatsu [51], the metallization (M) value is used to determine the metallic or non-metallic nature of a material, and if it is less than unity, the material is considered non-metallic. In the present scenario, the metallization value ranges from 0.418–0.408, indicating the non-metallic behavior of the glass samples. The energy band gap-based metallization (M (Eg)) criterion and refractive index-based metallization (M (n)) criterion values also lie in the range of 0.087–0.083 and 0.418–0.408, respectively, which is less than unity [52]. Furthermore, optical electronegativity( ), non-linear optical susceptibility(
 ), and non-linear refractive index (n2°ptical) values decrease with lead oxide concentration, with values ranging from 0.939–0.897, 2.587–2.307, and 4.285–3.759, respectively. All these parameters are directly proportional to the energy band gap value, and as it decreases with lead content, these factors also decrease [50].
3.4. Gamma ray shielding properties
Figure 6 shows the graphical representation of the LAC for the P1-P4 glasses at low energy range (39.5–295.9 keV). We used Phy-X software for the calculation of the LAC values for these glasses and for the calculations of the other radiation shielding parameters.The LAC-E curve conforms to the Lambert–Beer law, indicating that the LAC values are highest at 39.5 keV and decrease as the energy increases further. At 39.5 keV, the LAC values for P1 to P4 are 80.07, 81.92, 84.88, and 86.55 cm−1, respectively, while at 45.90 keV, the same glasses exhibit LAC values of 54.09, 55.35, 57.37, and 58.50 cm−1. A significant difference in LAC was observed for the same composition between 39.50 and 45.90 keV. The LAC continued to decrease rapidly, reaching values of 14.86, 15.49, 16.35, and 16.97 cm−1 for these glasses at 121.80 keV. As we focused on a low energy range in this investigation, the photoelectric effect was the primary interaction process. This process is known to be highly inversely dependent on the radiation energy, which means that as the energy increases, the LAC decreases rapidly. Also, this process is highly depending on the atomic number of the absorber. Therefore, we found that the LAC for P1 (for example) decreased from 80.07 cm−1 at 39.50 keV to 14.86 cm−1 at 121.80 keV. Observations made by other authors have also revealed a comparable relationship between LAC and energy at low energy for different glass systems [53, 54].
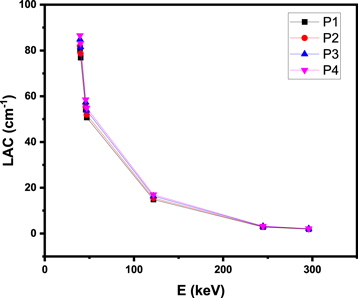
Figure 6. The LAC for the P1-P4 glasses at low energy range (39.5–295.9 keV).
Download figure:
Standard image High-resolution imageApart from the relationship between LAC and energy, it is also possible to investigate the relationship between LAC and glass composition. The four glasses we studied had constant concentrations of TeO2 (10 mol%), while the concentrations of PbO and CdO were varied. We noticed a comparable rise in LAC after increasing the amount of PbO while simultaneously decreasing the amount of CdO in the experiment. This is due to the high atomic number of Pb in comparison with Cd, and also the higher mass attenuation coefficient of lead comparing to that of Cd.Specifically, the results of our research showed that the glass with the code P4, which had a PbO content of 77.5 mol%, had the highest LAC of all of the compositions that were investigated.
The effective atomic number (Zeff) for the P1-P4 glasses was calculated and displayed in figure 7. Notably, the LAC and Zeff generally follow the same energy trend in most cases. It was noted that an increase in energy corresponds to a decrease in the Zeff. In spite of the fact that we observed that the Zeff for our glasses tends to decline with increasing energy, we observed that there is an interesting exception at 121.8 keV. In particular, we noticed a decline in Zeff between the energies of 39.50 and 47.04 keV, which was then followed by an abrupt spike at 121.8 keV and a subsequent decline that continued all the way up to 295.90 keV. Contrary to our initial expectations, we found that the maximum Zeff values for our glasses are obtained at 121.80 keV rather than at the lowest energy of 39.50 keV. Specifically, the maximum values we observed were 75.38, 75.78, 76.17, and 76.54 for P1 to P4, respectively. We attribute the sudden shift in Zeff at 121.8 keV to the K-absorption edge of the constituent elements in the glasses. Our glasses are composed of lead, which has a K-absorption edge at 88 keV. This is a value that is relatively near to the energy at which we saw a sudden change in Zeff, which was at 121.8 keV. According to this observation, using heavy elements in radiation attenuation purposes, such as lead, can be helpful, particularly at low energy ranges.

Figure 7. Zeff for the P1-P4 glasses.
Download figure:
Standard image High-resolution imageIn addition to our investigation of Zeff, we also determined the required thickness of the P1-P4 glasses to attenuate 50% of photons with energies ranging from 39.5–295.90 keV (figure 8). By analyzing this figure, we are able to determine how variations in energy as well as variations in the concentrations of PbO and CdO impact the HVL, thereby shedding light on the influence of composition. Based on our results, we can conclude that the HVL is positively related to energy, with HVL increasing in response to higher energy levels between 39.5 to 295.90 keV.
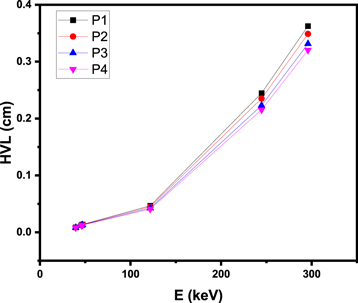
Figure 8. HVL for the P1-P4 glasses between 39.5–295.90 keV.
Download figure:
Standard image High-resolution imageAt 39.50 keV, the HVL of P1 measures a mere 0.009 cm, increasing to 0.013 cm at 45.90 keV, and then rising dramatically to 0.047 cm and 0.363 cm at 121.8 keV and 295.90 keV, respectively. Similarly, at 39.5 keV and 45.90 keV, the HVL of P1-P4 is exceptionally small, ranging between 0.008 cm and 0.013 cm.
Practical applications of P1-P4 glasses in radiation shielding require an exceptionally thin coating. This is particularly important in industries such as medical imaging, where bulky or heavy shielding materials are often impractical. By providing a wafer-thin layer of protection, P1-P4 glasses offer an attractive alternative to traditional shielding materials.
Despite increasing at higher energies, the HVL of our glasses remains small. The maximum HVL we observe, at 295.90 keV, ranges from 0.320 cm to 0.363 cm. While these values are larger than those at lower energies, they still indicate that our glasses are effective at shielding against radiation across a broad range of energies.
Our investigation into the composition of our glasses has revealed that the addition of PbO leads to a reduction in HVL. Notably, we found that P4 displays the least HVL at a specific energy due to its higher density when compared to the other glasses we studied. These findings emphasize the critical role of thoughtful glass composition in maximizing the effectiveness of radiation shielding.
We determined the mean free path (MFP) of the P1-P4 glasses we prepared and calculated the average MFP across all samples ( ). The
  was calculated in two energy ranges: from 39.5 to 47.04 keV and from 121.8 to 295.90 keV. The
  in the first energy range is depicted in figure 9, while the
  in the second range is shown in figure 10. The results show that the
  decreases consistently as we move from the P1 sample to the P4 sample. This indicates that the addition of PbO has a significant impact on reducing the
  These findings are consistent with the trends observed in the previous figures, which also demonstrate a decrease in
  with the addition of PbO. A comparison of the
  values shown in figures 9 and 10 reveals that the
  values in figure 10 exceed those in figure 9. This discrepancy can be attributed to the higher energy range depicted in figure 10, as increasing the energy level results in an increase in

Figure 9.
 across all samples between 39.5 and 47.04 keV.
Download figure:
Standard image High-resolution image
Figure 10.
 across all samples between 121.8 and 295.90 keV.
Download figure:
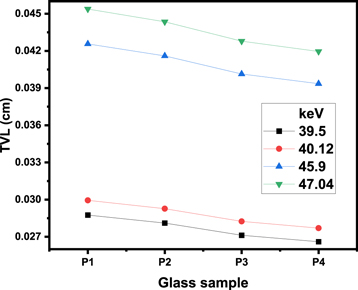
Standard image High-resolution imageWe evaluated the tenth value layer for the P1-P4 glasses at very low energy (up to 47.04 keV). The TVL values for the P1-P4 samples in the range of 39.50–47.04 keV is given in figure 11. Due to our selection of very low energy levels, we have observed that the TVL is quite small. Specifically, at energy levels of 39.50 keV and 40.12 keV, the TVL ranges from 0.027 to 0.029 cm and from 0.028 to 0.030 cm, respectively. At higher energy levels of 46.90 keV and 47.04 keV, the TVL is found to be in the range of 0.039 to 0.043 cm and 0.042 to 0.045 cm, respectively. It is important to apply a very thin layer of these glasses in order to ensure appropriate protection from radiation with a low energy level. To be more specific, a layer with a thickness of about 0.028 cm is adequate for providing the necessary shielding for an energy level of 39.50 keV, but a layer with a thickness of approximately 0.04 cm is necessary for an energy level of 47.04 keV.
Figure 11. The TVL values for the P1-P4 samples in the range of 39.50–47.04 keV.
Download figure:
Standard image High-resolution image
4. Conclusion
The purpose of the study was to analyze the impact of an increase in PbO concentration on the structural, thermal, optical, and gamma ray shielding properties of TeO2-CdO based glasses. The Raman spectrum revealed the presence of TeO4 and TeO3 units, as well as CdO metal oxide clusters in the glasses. The glasses exhibited minor weight loss, indicating excellent resistance to thermal degradation and the ability to withstand high temperatures without any significant changes in their structure or properties. The study found that an increase in PbO concentration resulted in a decrease in the Tg, To, and Tc. Furthermore, the indirect band gap energy of the glass samples decreased from 3.497–3.337 eV with increasing lead oxide concentration. Besides, the TeO2-CdO based glasses with varying PbO concentrations (up to 77.5 mol%) exhibit promising gamma radiation shielding properties. For instance, at 39.5 keV, the LAC values for P1 to P4 glasses were found to range from 80.07 to 86.55 cm-1. Given the observed relationship between increased PbO concentration and improved shielding effectiveness, future research could explore the incorporation of other heavy metal oxides into the glass matrix to further optimize the radiation shielding performance. This could lead to the development of novel glass compositions with tailored properties for specific applications in industries requiring lightweight, thin (HVL as low as 0.008 cm at 39.5 keV), and efficient radiation shielding materials.
Acknowledgment
This research project was funded by the Deanship of Scientific Research, Princess Nourah bint Abdulrahman University, through the Program of Research Project Funding After Publication, grant No (43- PRFA-P-71).
Data availability statement
All data that support the findings of this study are included within the article (and any supplementary files).
Declaration of competing interest
The authors declare that they have no known competing financial interests or personal relationships that could have appeared to influence the work reported in this paper.