

Abstract
In this work, we measured the breakdown curves of radio-frequency (13.56 MHz) capacitive discharge in acetylene and in carbon dioxide. The electron drift velocity values were determined in the reduced electric field range 319 Td ≤ E/N ≤ 3409 Td (1 Townsend = 10−17 Vcm2) in acetylene and 272 Td ≤ E/N ≤ 6240 Td in carbon dioxide from turning points on the measured breakdown curves. Treating the electron motion equations and the gas breakdown criterion in the rf electric field we have demonstrated that the method of electron drift velocity determination we employed is universal for arbitrary gasses, and a possible dependence of the electron mobility and diffusion on the reduced electric field strength E/N does not affect the drift velocity values obtained with it. We have demonstrated that in the range of E/N values we have studied the ionization rate exceeds the attachment rate considerably therefore one may neglect the effect the attachment of free electrons to gas molecules plays on electron drift velocity. We have explained the reason why the values of the electron drift velocity we have obtained differ from those obtained by other authors.
Export citation and abstract BibTeX RIS
Introduction
Gas discharge plasma in acetylene (C2H2) is widely used for deposition of polymer films [1, 2], diamond and diamond-like carbon coatings [3–5]. Carbon nanotubes, nanowalls, and a number of other nanostructures are grown with its assistance [6–10]. In plasma containing an acetylene additive, dust particles are formed [11–14] affecting the characteristics of both the burning discharge and the afterglow. A number of studies have examined plasma-assisted combustion in mixtures of acetylene with air [15, 16]. Also, acetylene is present in the atmospheres of the Earth, Jupiter, Saturn, and Titan [17, 18], where it is formed due to the photodissociation of methane molecules.
For hydrodynamic description of processes in acetylene plasma, one needs to know the electron drift velocity Vdr in a wide range of the reduced electric field E/N (ratio of electric field strength to pressure E/p is also often used, but the gas temperature T must be specified), where N is the particle number density.
The electron drift velocity in C2H2 was determined in [19–23]. Four of the papers [19–22] used the double-shutter drift tube. Bowman and Gordon [19] measured the electron drift velocities in acetylene for the range of low E/N from 0.9 to 7.2 Td (1 Td = 10–17 V cm2), that is, in the range 0.3 ≤ E/p ≤ 2.4 V/(cm Torr) for the gas temperature of 293 K. Cottrell et al [20] determined the Vdr for the E/N range from 0.18 to 60 Td (0.06 ≤ E/p ≤ 20 V/(cm Torr)). Nakamura [21] measured the drift velocity in pure C2H2 and in C2H2–Ar mixtures over the E/N range from 3 to 200 Td (1 ≤ E/p ≤ 66 V/(cm Torr)). Using the obtained drift velocity and two-term Boltzmann equation analysis, Nakamura determined a set of electron collision cross sections for the acetylene molecule, which we use below as 'Nakamura's set'. Hasegawa and Date [22] measured the electron drift velocity in different organic gasses (including acetylene) over the E/N range from 300 to 2800 Td (100 ≤ E/p ≤ 924 V/(cm Torr)).
Pinhão et al [23] measured in a scanning drift tube apparatus under time-of-flight conditions such swarm parameters of electrons as the bulk drift velocity, the bulk longitudinal component of the diffusion tensor, and the effective ionization frequency in three gasses C2Hn (n = 2, 4 and 6) over a range of the reduced electric field 1 Td ≤ E/N ≤ 1790 Td (0.3 ≤ E/p ≤ 591 V/(cm Torr)). They also performed various kinetic swarm calculations: solutions of the electron Boltzmann equation and Monte Carlo simulations ('bulk' and 'flux').
It can be seen from the cited works that in papers [19–21] the electron drift velocity was measured in the E/N range below 200 Td. Only the authors of two papers [22, 23] performed their studies in the range of high electric fields (E/N > 300 Td), while their results differ noticeably, especially at high E/N values.
Now the electron transport in carbon dioxide (CO2) attracts considerable attention because CO2 makes the main contribution to the greenhouse effect аs well as because it is widely pervasive in the atmospheres of the planets and satellites of the solar system. The Vdr values have been registered and calculated mainly in the range E/N ≤ 1000 Td [24–32]. And only in [33] they have been measured by Schlümbohm for the range E/N = 450—6000 Td (E/p from 150 to 2000 V/(cm Torr)). The authors of paper [34] have determined the values of the bulk electron drift velocity under time-of-flight conditions over a wide range of the reduced electric field (15 Td ≤ E/N ≤ 2660 Td), as well as they have calculated Vdr values with the Monte Carlo simulations and solutions of the electron Boltzmann equation. Recent paper [35] has employed the time–of–flight (TOF) and the pulsed Townsend (PT) techniques, and the bulk drift velocity values were determined in the range 8 Td ≤ E/N ≤ 2000 Td. Note that in the range of higher values E/N > 1000 Td the results of measurements and calculations [34, 35] not only exceed considerably Vdr values, measured by Schlümbohm [33], but they also differ between themselves remarkably. Therefore it is of interest to measure the Vdr in CO2 in the range E/N > 1000 Td. Note that the recommended Vdr dependence in a wide range of E/N is proposed in the Raju reference [36].
Therefore, we measured the electron drift velocity in acetylene and in carbon dioxide using an independent method, namely from the breakdown curves of radio-frequency capacitive discharge. This method was previously proposed in [37] and then used to determine the drift velocity of electrons in 11 gases (see, for example, [38–40] and the literature cited therein). This method does not claim to be as accurate as the time-of-flight or the double-shutter drift methods. However, it is relatively simple, and it allows measurement of the drift velocity in a wide range of electric fields, including the highest fields reachable only for the most sophisticated techniques. At the same time, the accuracy of the method is sufficient for a hydrodynamic description of processes in gas discharge plasma. In the present work, we obtained Vdr in acetylene within the range of 319 Td ≤ E/N ≤ 3409 Td (105 ≤ E/p ≤ 1136 V/(cm Torr)) and of 272 Td ≤ E/N ≤ 6240 Td (90 ≤ E/p ≤ 2060 V/(cm Torr)) in carbon dioxide. For acetylene the electron drift velocity values determined by us are in good agreement with the experimental results of Hasegawa and Date [22], as well as with Monte Carlo 'flux' simulations of Pinhão et al [23]. For CO2 our data are in good agreement with MC TOF calculations [34], they exceed by about 10%–15% (at 2000 Td and 6000 Td, respectively) the data by Schlümbohm [33], but at 2000 Td they are 1.27 times and by 1.47 times lower than the results of experiment in [34] and [35], respectively.
Experimental
Gas breakdown in acetylene and carbon dioxide was studied in the discharge chamber, the scheme of which is shown in figure 1. The inner diameter of the tube was 56 mm. RF voltage with a frequency f = 13.56 MHz was applied to the fixed electrode, which was the chamber flange. A matching box was connected between the RF electrode and the generator to match the plasma load with the output impedance (50 Ohm) of the RF generator. The amplitude of the RF voltage Urf applied to the electrodes did not exceed 2000 V. The electrodes were placed inside the T-shaped glass tube. Gas inlet and its subsequent pumping out were carried out through the flange located in the base of the vertical part of the 'T'. Since there was no longitudinal gas flow along the tube, the pressure in all parts of the discharge chamber (including the gap between the electrodes) was the same. The grounded electrode could be moved along the tube. The distance between the stainless steel electrodes varied from 4.5 mm to 40 mm. The electrodes were flat disks 55 mm in diameter. The edges of the electrodes were rounded with a radius of 0.5 mm. There was a gap of 0.5 mm between the edge of the grounded electrode and the tube wall, through which the gas under study entered the gap between the electrodes from the main part of the chamber. Due to the low gas flow rate of 2 sccm, the pressure difference in the gap between the electrodes and in the main chamber did not exceed 1%–2%.

Figure 1. Experimental device setup.
Download figure:
Standard image High-resolution imageA mass-flow controller (STEC SEC 4400) was used to fill in the acetylene with purity of 99.6% and carbon dioxide (99.995%) manufactured by Elme Messer. The vacuum chamber was pumped out by turbomolecular (TMN–1500) and rotary vane (NVR-16D) pumps. Gas pressure was measured by two capacitive pressure gauges (Baratron, MKS Instruments) with maximum measured pressure values of 10 Torr and 1000 Torr. The experiments were carried out in the gas pressure p range of 0.02 − 60 Torr.
The experiments were carried out at a laboratory temperature of approximately 25 °C (298 K). This value was used in calculating the particle number density N, since the RF generator was switched off immediately after the breakdown of the gas, and the discharge chamber (electrodes and tube walls) did not have time to heat up. In addition, a pause of several minutes was maintained between subsequent breakdowns, which made it possible to completely renew the gas in the gap between the electrodes.
During the experiments, we fixed the gap between the electrodes L, at which the entire breakdown curve was measured - the dependence of the RF breakdown voltage amplitude on the gas pressure Urf (p). After the required gas pressure was established, the RF voltage amplitude slowly increased. After reaching a certain maximum value (which we will call 'breakdown voltage' below), Urf decreases sharply. Near the minimum of the breakdown curve, the magnitude of this decrease can be a few volts, but at lower or higher gas pressures, the RF voltage after gas breakdown decreases by tens or even hundreds of volts. Such an RF voltage jump between the electrodes can be easily registered. In addition, after the breakdown of the gas, an active current appears in the electrode circuit (the phase shift angle between the RF voltage and the RF current becomes less than π/2), and a glow appears in the discharge chamber. All these phenomena (simultaneous decrease in the amplitude of the RF voltage, the appearance of active current, and discharge glow) make it possible to reliably record the moment of gas breakdown.
The technique used by us for measuring RF breakdown curves is described in more detail below.
Technique for determination electron drift velocity from RF breakdown curves
As mentioned above, this method is simple and it does not require expensive equipment. A discharge chamber with proper gas feeding and vacuum pumping, a precise pressure meter, an RF generator, and an oscilloscope to measure RF voltage are enough. This method is based on the analysis of electrons motion equation in RF electric field and the criterion of RF gas breakdown [37]. Its advantages and disadvantages are discussed in detail in [41], therefore, here we only briefly describe the method itself.
From the electron motion equation in a uniform high-frequency electric field

(where  is the electron velocity, e and m are the electron charge and mass, respectively, Erf
is the amplitude of the RF electric field, νen
is the effective frequency of collisions of electrons with gas molecules, ω = 2 π f is the cyclic frequency of the rf oscillation) by integration, we find the equations for electron velocity and displacement
is the electron velocity, e and m are the electron charge and mass, respectively, Erf
is the amplitude of the RF electric field, νen
is the effective frequency of collisions of electrons with gas molecules, ω = 2 π f is the cyclic frequency of the rf oscillation) by integration, we find the equations for electron velocity and displacement


where ϕ = arctan(νen/ω). It is seen from (3) that the electron displacement amplitude A in rf electric field is equal to:

where the expression for the maximum instantaneous electron drift velocity Vdr is used, obtained from the equation (2):

Next we consider the criterion of gas breakdown in a high-frequency electric field. Since the maximum distance between the electrodes (L = 40 mm) at which we measured the RF breakdown curves is almost equal to the radius of the discharge tube (R = 28 mm), we can use the simplest criterion for RF breakdown, which does not take into account the diffusion loss of electrons on the tube walls (note that this will not affect the final formula for the electron drift velocity).
This criterion for gas breakdown in a uniform rf electric field was first obtained by Kihara [42]:

where νi is the frequency of ionization of molecules by electron impact (for electronegative gasses it must be replaced with the effective ionization rate νeff = νi —νa , equalling to the difference between the ionization rate and attachment one), De is the coefficient of electron diffusion, and Λ is the diffusion length of the discharge chamber. Let us use the dependence of the ionization frequency on the electron drift velocity and the first Townsend coefficient α in the form νi = α·Vdr , where

and Eeff
is the effective electric field strengths  A1 and B are constants depending on the type of gas, Vdr
= μe
·E = μe0 · E/p, De
= De0/p, μe0 and De0 are the electron mobility and diffusion coefficient for gas pressure p = 1 Torr, respectively. After substituting the expressions for νi
, α, Vdr
, De
into the equation (6), we obtain the RF breakdown equation, which includes the RF voltage Urf
measured in the experiment, the gas pressure p, and the distance L between the electrodes:
A1 and B are constants depending on the type of gas, Vdr
= μe
·E = μe0 · E/p, De
= De0/p, μe0 and De0 are the electron mobility and diffusion coefficient for gas pressure p = 1 Torr, respectively. After substituting the expressions for νi
, α, Vdr
, De
into the equation (6), we obtain the RF breakdown equation, which includes the RF voltage Urf
measured in the experiment, the gas pressure p, and the distance L between the electrodes:

Since in this equation the RF voltage amplitude depends on the gas pressure, Urf = Urf (p), we can differentiate this equation by the gas pressure p and express the first derivative dUrf (p)/dp as
As will be shown in the figures below, the rf breakdown curve (its so-called diffusion-drift branch) has a minimum and a turning point. The minimum of the rf breakdown curve is observed at dUrf (p)/dp = 0 (when the numerator of equation (9) is zero), and at the turning point dUrf (p)/dp → ∞ (when the denominator of equation (9) is zero). To exclude the exponential factor in (9), we substitute (8) in (9). Then for the turning point (for Ut and pt ), after some algebraic transformations, we obtain the expression

The first multiplier of equation (10) may be rewritten as

and from equation (11) one may get the formula for the electron drift velocity under conditions of the turning point.

It follows from comparing equations (11) and (4) that at the turning point the amplitude of electron displacement in the rf electric field is equal to half distance between electrodes, i.e. A = L/2. The oscillating electron cloud is very thin and spreads only due to longitudinal diffusion. We will use equation (12) below to determine the electron drift velocity from the turning point of the RF breakdown curve. Note that the value of Vdr at the turning point depends only on the distance between the electrodes and the rf field frequency. This equation is valid for any kind of gas (if the breakdown of the gas involves only ionization of the molecules by electrons and the escape of electrons is determined only by the oscillating motion of the electrons in the rf electric field and the diffusion spreading of the electron cloud). In this case, the coordinates of the turning point determined from the rf breakdown curves make it possible to specify the magnitude of the reduced electric field E/p, for which the electron drift velocity was measured.
The second solution of equation (10)

also depends on the electron drift velocity including the coordinates Ut and pt of the turning point as well as on the B constant from the first Townsend coefficient (7). But the values of the drift velocity determined with equation (13) are about 2 times less than ones measured in experiment with other techniques or calculated numerically. Therefore we will not use equation (13) in what follows as it clearly emerged due to the transcendental pattern of the rf breakdown criterion (8).
Above we assumed that the electron mobility μe0 and diffusion coefficient De0 (for gas pressure p = 1 Torr) did not depend on the reduced electric field E/p, they are constants and Vdr
= μe
·E = μe0 · E/p, De
= De0/p. However generally μe0 and De0 may depend on E/p. Therefore we assume that 

 Inserting μe0 and De0 in equation (8) permits one to write the rf breakdown criterion in the following form:

Its treatment furnishes for the turning point the equation

Similar to the previous, simple case, the first multiplier of equation (15) may be rewritten as

This relation indicates the universal character of formula (12) determining the electron drift velocity from the measured coordinates of the turning point of the rf breakdown curve, which does not depend both on gas species and also on a possible dependence of the electron mobility and diffusion coefficient on the reduced electric field E/p.
Here is the applicability condition of our technique for determining the electron drift velocity in a gas. The anisotropic part of electron energy distribution function has to correspond to an instantaneous value of the rf electric field strength. The electron velocity should in time tune to the change in the rf field and be equal to the drift velocity in the dc electric field whose value is equal to the instantaneous rf field value. This means that the frequency of the rf electric field (more precisely, the angular frequency ω) varies sufficiently slowly compared with the momentum-transfer rate νme [41, 43], that is, there must be νme ≫ ω. We need this condition in order that the rf reduced electric field Erf /p may be replaced with the constant field E/p of the same value. One will see from the rf breakdown curves presented below that the turning point on them with narrow gaps L between the electrodes is observed in the range of high gas pressure, when the momentum-transfer rate νme may exceed the angular frequency ω tens or even hundreds of times. But with large inter-electrode distances the turning point is displaced to the range of lower pressure values. Therefore the experiments in this paper have been performed only for this inter-electrode distance values L for which the quantity νme exceeds the angular frequency ω not less than by 10 times. This puts an upper limit to a possible gap L range (and the range of reduced electric field values E/N, E/p), in which our technique of determining the electron drift velocity values in a gas from the breakdown curves of the rf capacitive discharge is correct. To find the momentum-transfer rate νme we have employed Bolsig + code [44] (http://www.bolsig.laplace.univ-tlse.fr/), in which we have inserted the cross sections of electron collisions with acetylene molecules (Nakamura [21], Song et al [45]) and with carbon dioxide (Grofulović et al [32]).
It is well known [46–48] that runaway electrons can be observed in a sufficiently strong electric field at high values of E/N. Their appearance significantly affects DC gas breakdown and limits the hydrodynamic description under high E/N values. So let's check if this limitation affects our results. Electrons moving in the electric field gain energy due to the Coulomb force and lose energy in collisions with gas molecules, which may be described as friction. This friction force increases linearly with the electron drift velocity Vdr
. The energy gained by electrons between subsequent collisions with molecules is randomized during these collisions, due to which the electrons have an average energy  and corresponding average thermal velocity
  In a weak electric field
  as E/N increases, both velocities increase, and the ratio
  decreases. We calculated these speeds using the Bolsig + code and presented the results of the calculations in figure 2. For the appearance of runaway electrons, it is necessary that the drift velocity reach the average thermal velocity. Then the friction force will reach a maximum, and with a further increase in the drift velocity, the friction force will decrease as 1/Vd
r
2 [48]. From figure 2, it can be seen that at E/N = 10 kTd the ratio
decreases. We calculated these speeds using the Bolsig + code and presented the results of the calculations in figure 2. For the appearance of runaway electrons, it is necessary that the drift velocity reach the average thermal velocity. Then the friction force will reach a maximum, and with a further increase in the drift velocity, the friction force will decrease as 1/Vd
r
2 [48]. From figure 2, it can be seen that at E/N = 10 kTd the ratio  reaches 2 for acetylene and 3 for carbon dioxide, respectively. Since we determined the electron drift velocities for E/N < 10 kTd, no runaway electrons should have been observed under the conditions of our experiments. Therefore, the hydrodynamic description used by us is justified.
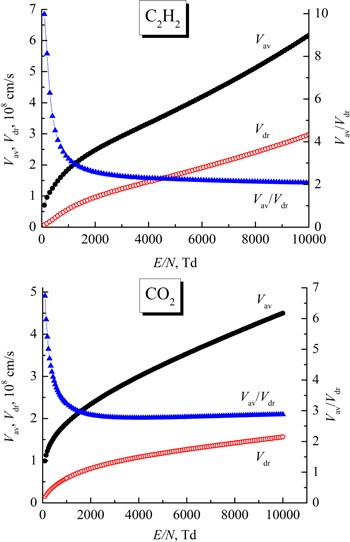
Figure 2. Dependences of the average thermal velocity Vav and drift velocity Vdr of electrons, as well as their ratios Vav/Vdr on reduced electric field E/N. The values of the velocities in C2H2 and CO2 are based on a BOLSIG + calculation.
Download figure:
Standard image High-resolution imageAcetylene and carbon dioxide are both electronegative gases. Free electrons may be trapped by molecules of these gases to form negative ions. Electron attachment to gas molecules excludes them from the opportunity taking part in the ionization process what must be taken into account. Above we have already said that in the breakdown criterion (6) the ionization rate νi has to be replaced with the difference between the ionization rate and the attachment on νi —νa . However under conditions of our experiment one may neglect the electron attachment. We have calculated the ionization and attachment rates with Bolsig + code, and their dependencies on E/N for acetylene are presented in figure 3. One sees in this figure that the attachment rate exceeds the ionization one at E/N ≤ 120 Td, but in strong electric fields the ionization rate increases fast whereas the attachment rate experiences weak changes. Already at the beginning of the range we studied E/N ≥ 319 Td we have νi ≈ 300 νa , and at E/N = 1000 Td the ionization rate is four orders of magnitude higher than the attachment rate. We also got similar results for carbon dioxide. Therefore we may ignore the contribution of electron attachment.

Figure 3. Ionization and attachment rates against the reduced electric field E/N for acetylene. The values of the rates are based on a BOLSIG + calculation.
Download figure:
Standard image High-resolution imageRF breakdown curves for acetylene
The breakdown curves of RF capacitive discharge are more complex than the well-known U-shape DC breakdown (Paschen's) curves. In the range of gas pressures, distances between the electrodes, and applied RF voltages studied by us, the breakdown curves in acetylene (as in other gases) have two main branches: diffusion-drift and Paschen ones.
The Paschen branch is clearly observed only for small electrode distance values. Electrons are created by electron impact ionization and secondary emission from the electrodes induced by electrons. Ionization ability of electrons at the Paschen branch minimum is maximal. In the Paschen branch the electron transit time across the gap (for the peak voltage) is short compared to the RF period. Therefore the frequency does not matter, and the curve is similar to the DC one.
In the diffusion-drift branch the amplitude of electron displacement is smaller, the electron losses are therefore smaller than they would be for a DC field, and breakdown can occur at lower fields. The diffusion-drift branch therefore only occurs in alternating fields. Under diffusion-drift conditions, positive ions practically do not react to the oscillating RF electric field (since the gas pressure is high and RF voltage is relatively low). In contrast, under Paschen branch conditions (lower pressure, high RF voltage) the amplitude of ion oscillations may cover a significant portion of the gap between the electrodes. Therefore, at the Paschen branch, ion-induced electron emission from the instantaneous cathode acts as an additional source of electrons, not only due to the diffusion motion of ions born after ionization [49, 50], but also due to collisions of ions with the cathode during their oscillations in RF electric field.
To measure the RF breakdown curves, we used the technique proposed by Levitskii [51]. In earlier studies [52–57], a jump was observed in the experimental breakdown curves during the transition from one branch to another (to the left of the minimum of the diffusion-drift branch). Levitskii [51] studied this phenomenon in more detail and discovered the presence of a region of ambiguous dependence of the RF breakdown voltage on the gas pressure. Typically, to measure the right-hand side branch (near to and to the right of the minimum), first you need to fix the gas pressure, then slowly increase the RF voltage until a breakdown occurs. After the RF discharge ignition, the voltage across the electrodes decreases sharply, therefore, the maximum RF voltage before the ignition was taken as the RF breakdown voltage. According to the Levitskii method [51], to the left of the minimum of the diffusion-drift branch, the gas pressure first decreases, and then the required RF voltage is set (the gas breakdown still does not occur), and then the pressure slowly rises until the gas breaks down.
Thus, it was suggested to distinguish the following sections on the RF discharge breakdown curves: Paschen and diffusion-drift branches [37, 58]. Figure 4 shows the RF discharge breakdown curves for narrow gaps between the electrodes of 4.5 and 5 mm, and figure 5 is for longer distance values (up to 30 mm). From the figures, we see that for small electrode spacing the drift-diffusion branch occurs to the high-pressure side of the breakdown minimum, but it moves toward lower pressure and voltage values as the gap is enlarged (eventually overlapping and dominating the Paschen branch). The amplitude of electron displacement in the RF field is less than the half-width of the gap. Under the conditions of a diffusion-drift branch, the generation of charged particles by electron impact ionization is balanced by diffusion and drift in the RF field. Electron induced secondary electron emission makes discharge ignition easier. Under many conditions the drift-diffusion branch turns back towards higher pressures, leading to a multi-valued region in which the discharge may be ignited at 2 or 3 different RF voltage values for the same gas pressure one. When the amplitude of the electron displacement exceeds half the gap between the electrodes, the loss of electrons becomes large, making breakdown impossible. This determines the smallest gas pressure pt at which breakdown can occur for the diffusion-drift branch at a sufficiently large spacing between the electrodes.
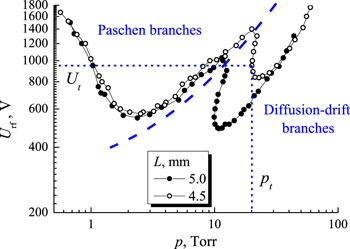
Figure 4. RF breakdown curves for acetylene (f = 13.56 MHz) for inter-electrode gaps 4.5 and 5 mm. Dash curve represents a nominal boundary between Paschen and diffusion-drift branches. Short dash lines show the coordinates of the turning point of the RF breakdown curve for the gap of 4.5 mm.
Download figure:
Standard image High-resolution image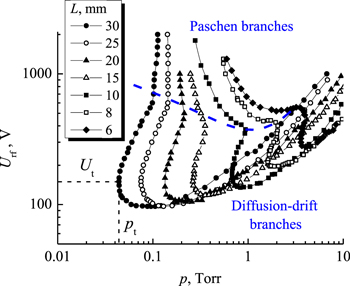
Figure 5. RF breakdown curves for acetylene (f = 13.56 MHz) for electrode spacing from 6 to 30 mm. Dash curve represents a nominal boundary between Paschen and diffusion-drift branches. Short dash lines show the coordinates of the turning point on the RF breakdown curve for the gap of 30 mm.
Download figure:
Standard image High-resolution imageIf we set the gas pressure pt , but apply the RF voltage Urf > Ut , then the discharge will not be able to ignite. Under these conditions, the amplitude of the electron displacement will be greater than half the gap between the electrodes. The electrons will be intensively lost on the instantaneous anode, not having time to complete the number of ionizing collisions necessary for maintaining the discharge. To achieve breakdown, one must either increase the RF voltage at the gas pressure pt to the value corresponding to the Paschen branch, or at the fixed RF voltage, increase the number of collisions of electrons with gas molecules, i.e. increase the gas pressure. That is why a multi-valued region is observed on the RF breakdown curve.
Let us estimate the displacement amplitude of positive ions in RF electric field under Paschen branch conditions by the formula Ai = e·Erf /(M·νin ·ω) = e·Urf /(M·νin ·ω·L) [59]. Here Erf is the RF electric field strength, M is the ion mass (we set it equal to the mass of the acetylene molecule), νin is the ion collision frequency with gas molecules (it can be estimated as 107 p s–1 if the pressure p is expressed in Torr [60]). Then for the Paschen branch minimum at L = 5 mm (Urf = 545 V, p = 2.4 Torr) we have Ai = 0.2 mm, and at lower pressure (Urf = 1500 V, p = 0.68 Torr) Ai = 1.9 mm, which is almost equal to half the gap L. Therefore, under Paschen branch conditions, a significant part of positive ions can reach the surface of the electrodes during the oscillations in the RF field and can lead to ion-induced electron emission.
Results for electron drift velocity in acetylene
As indicated above, to determine the electron drift velocity, it is necessary to measure the coordinates of the turning point on the diffusion-drift branch of the RF breakdown curve. The magnitude of the electron drift velocity is determined by the formula (12) and it depends only on the frequency of the RF electric field and the distance between the electrodes. Using the coordinates of the turning point (RF voltage Ut and gas pressure pt ), we can find out for which value of the reduced electric field E/p = Ut /(pt ·L) the electron drift velocity was determined. Consider one RF breakdown curve from figure 4 and one from figure 5. The RF breakdown curve for the smallest gap used by us, L = 4.5 mm, has a turning point at pt = 20.03 Torr and Ut = 950 V. Then for this gap and RF frequency f = 13.56 MHz, we have the electron drift velocity Vdr = 0.45·π·13.56 · 106 = 1.92 · 107 cm s−1. The value of the reduced electric field corresponding to this value of the drift velocity is E/p = Ut /(L·pt ) = 950/(0.45 · 20.03) = 105.4 V/(cm Torr). Similarly, for the largest gap L = 30 mm, we have pt = 0.044 Torr and Ut = 150 V, Vdr = 3·π·13.56 · 106 = 1.28 · 108 cm s−1, E/p = Ut /(L·pt ) = 1136.4 V/(cm Torr).
The electron drift velocity values in acetylene determined by us are presented in figure 6. Note that this figure shows 14 experimental points. In figures 4 and 5 we have shown only 9 of the 14 measured RF breakdown curves in order not to clutter them with unnecessary information.
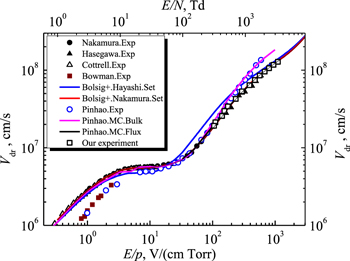
Figure 6. Dependence of the electron drift velocity in acetylene on the reduced electric field E/N (E/p values are given for gas temperature 298 K).
Download figure:
Standard image High-resolution imageIt can be seen from the figure that our experimental results are in good agreement with the measured data of Hasegawa and Date [22], as well as with Monte Carlo simulation ('flux' solution) by Pinhão et al [23]. In addition, using Bolsig + code [44] and sets of cross sections for electron collisions with acetylene molecules [21, 45, 61], we calculated the electron drift velocities in a wide range of the reduced electric field values E/N = 1–10 000 Td.
The BOLSIG + code allows one to determine the transport coefficients for electrons in a gas with an applied electric field, numerically solving the Boltzmann equation. The input parameters for this code are the cross sections of elastic and inelastic collisions of electrons with gas molecules. Figure 5 shows that when using the set of cross sections proposed by Nakamura [21], the electron drift velocity calculated using the Bolsig + code is in good agreement with both our experimental data and the Hasegawa and Date measurements [22], and with the Monte Carlo simulation of Pinhão et al [23]. Note that Nakamura presented in [21] the cross sections for electron collisions with acetylene molecules only in the electron energy range up to 100 eV.
Note that White et al [62] questioned the two-term Boltzmann equation analysis, which may provide insufficiently high accuracy in determining the electron transport coefficients (about 10% with the required 0.1%), and pointed out that only multi-term analysis can provide the required accuracy. But although Nakamura used the two-term Boltzmann equation analysis to determine a set of electron collision cross sections for the acetylene molecule, his results are reliable. This is confirmed by the fact that the electron transport parameters in acetylene calculated using the Monte Carlo code using Nakamura's cross-sections set are in good agreement with the experimental data over a wide range of reduced electric field E/N [21].
Song et al [45] presented a set of cross sections for a wider range of electron energies. However, the results of calculating the electron drift velocity using Bolsig + code and the set of cross sections from [45] are practically superimposed on the data obtained using the Nakamura's set [21], so we do not present them in figure 5. The use of Hayashi's cross section set [61] leads to overestimated values of the electron drift velocity in the range E/N > 60 Td, compared with the above results. The measured values of Pinhão et al [23] bulk drift velocity, as well as the results of Monte Carlo simulation ('bulk' solution) [23] are in good agreement with the data of other authors in the range E/N = 20–300 Td, but in a stronger reduced electric field they deviate towards the higher values of electron drift velocity.
Results for carbon dioxide
Сonsider the results we have got for igniting the rf capacitive discharge and electron drift velocity in carbon dioxide.
Figures 7 and 8 present the rf breakdown curves for the interelectrode distance L from 5 to 40 mm. The diffusion-drift branch of the breakdown curve for L = 5 mm is expressed weakly, therefore we cannot employ this curve for electron drift velocity determination. However already with the gap of L = 6 mm the diffusion-drift branch becomes well expressed, therefore we were able to measure for carbon dioxide the electron drift velocity starting from E/N = 272 Td (E/p = 90 V/(cm Torr)). With increasing the gap L further the diffusion-drift branch of breakdown curve is displaced to the range of lower pressure and rf breakdown voltage values, it becomes expressed more clearly easing one its application for determining electron velocity. The number of registered rf breakdown curves as well as the number of experimental points on every curve were much larger than shown in figures 7 and 8. Note also that it is difficult visually to determine the location of the turning point on the rf breakdown curve in figure 8 for the maximum gap of L = 40 mm we have studied, but the construction of this curve to a semi-logarithmic scale (with linear scale along the ordinate axis) or the consideration of a small portion of the curve near the turning point itself (to enlarged scale) permits one to solve this problem.
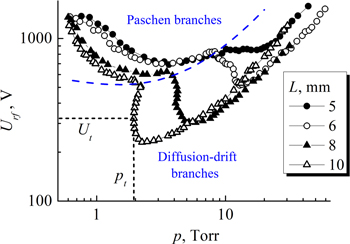
Figure 7. RF breakdown curves in CO2 for electrode spacing from 5 to 10 mm, f = 13.56 MHz. Dash curve represents a nominal boundary between Paschen and diffusion-drift branches. Short dash lines show the coordinates of the turning point on the RF breakdown curve for the gap of 40 mm.
Download figure:
Standard image High-resolution image
Figure 8. RF breakdown curves in CO2 for electrode spacing from 10 to 40 mm, f = 13.56 MHz. Dash curve represents a nominal boundary between Paschen and diffusion-drift branches. Short dash lines show the coordinates of the turning point on the RF breakdown curve for the gap of 40 mm.
Download figure:
Standard image High-resolution imageThus we determined the electron drift velocity in carbon dioxide in the range of the reduced electric field 272 Td ≤ E/N ≤ 6240 Td (90 ≤ E/p ≤ 2060 V/(cm Torr)) for interelectrode distance values L from 6 to 40 mm. The results we have obtained are presented in figure 9 together with the data of other authors. Let us perform their comparison.
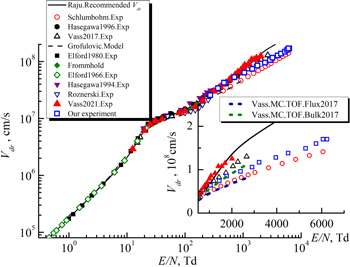
Figure 9. Dependence of the electron drift velocity in carbon dioxide on the reduced electric field E/N.
Download figure:
Standard image High-resolution image
Schlümbohm [33] measured the electron drift velocity values Vdr in the range 450 Td ≤ E/N ≤ 6000 Td (150 ≤ E/p ≤ 2000 V/(cm Torr)). Our results are approximately 1.15–1.2 times higher than the data of paper [33], but they are in better agreement with the data of other authors at low E/N values. Grofulović et al [32] calculated Vdr at E/N ≤ 1000 Td, the curve they obtained in figure 7 actually fits the experimental data of paper [33]. Our experimental Vdr values at E/N ≤ 1000 Td are in good agreement with measured data of Hasegawa et al [28] and Vass et al [34]. The registered Vdr values by Vass et al [35] are close to our and the data of papers [28, 34] only at E/N ≤ 500 Td, but with the subsequent E/N increase they grow faster. The strongest discrepancies in the Vdr values determined by different authors are observed in the range E/N > 1000 Td. This we observe in the insertion into figure 9. For example, let us consider the Vdr values at E/N = 2000 Td. Our data are 1.2 higher than the data of paper [33], but they are 1.13 and 1.3 times less than the Vdr values registered in papers [34] and [35], respectively. Note that with the parameter E/N growing this discrepancy increases, the Vdr values [34] and [35] grow faster, than our data and those of paper [33].
The solid line in figure 9 demonstrated the 'recommended' Vdr
(E/N) dependence suggested in the handbook by Raju [36]. One sees that it matched practically the enhanced data by Vass et al [35]. But in paper [36] it seemed to be drawn through the experimental points of paper [33]. Schlümbohm [33] presented his experimental results for carbon dioxide not as a table or points in a figure but as a formula  [cm/sec], where k = 1.58·106, m = 0.591. For a 'recommended' curve [36] at E/N > 2000 Td these constants are k = 2.85·106, m = 0.6, i.e. it runs about 2 times higher than the data of paper [33] and clearly needs refinement.
The insertion into figure 7 depicts also the calculation results by Vass et al [34], obtained with Monte-Carlo technique. One sees that the MC TOF curve for 'flux' electron drift velocity they obtained runs near the experimental data by Schlümbohm [33], and the MC TOF curve for 'bulk' electron drift velocity is close to the data we obtained.
For acetylene (Pinhão et al [23]) as well as for carbon dioxide (Vass et al [34], Vass et al [35]) the authors of respective papers have employed for measuring the electron transport parameters if not identical but still similar experimental devices. In all three papers they obtained remarkably higher values of the electron drift velocity in the range of strong electric field range (E/N > 1000 Td) than the data of other authors. All these three papers are based on treating the motion of electron swarm freed out of the cathode surface due to photoemission resulting from irradiating it with. e.g. a laser pulse. In an ideal case the distribution of electron number n(x,y,z,t) in a swarm is described by the formula [63]

where n0 is the initial number of electrons (left the cathode),  DL
is the coefficient of longitudinal diffusion of electrons, t is the time the electron swarm moves in the electric field, W is the drift velocity of the swarm center of mass. Formula (17) does not take into account the ionization generation of charged particles, and for its inclusion one has to add into the square brackets the term
DL
is the coefficient of longitudinal diffusion of electrons, t is the time the electron swarm moves in the electric field, W is the drift velocity of the swarm center of mass. Formula (17) does not take into account the ionization generation of charged particles, and for its inclusion one has to add into the square brackets the term  where
where  is the effective ionization rate. However the actual distribution n(x, y, z, t) in the swarm differs from the ideal one (17) because of the presence of cathode and anode (electron collector). A portion of electrons may leave due to the inverse longitudinal diffusion to the cathode. Similarly, due to direct longitudinal diffusion a portion of electrons is shifted to the electrode limiting the drift space. This results not only in the variation of the electron distribution function over velocity n(x, y, z, t) but also the distribution function of electrons over energy near electrodes. A detailed treatment of this phenomenon is presented in chapter of the book by Huxley and Crompton [63]. As a result this book furnishes for the electron drift velocity the formula

where  h is the length of electron drift space (cathode-collector spacing), tm
is time moment when the maximum current hits the collector. With this formula and the data presented by Vass et al [34] for E/N = 1376 Td (h = 65·10–3 m, tm
= 80 ns, DL
N = 4.3·1024 m–1s–1, N = 3.08·1021 m−3) we find the actual electron velocity W = 6.85·107 cm s−1 (taking into account the longitudinal electron diffusion onto electrodes). For the case considered Vass et al [34] got W = 8.04·107 cm s−1, i.e. 1.17 times higher value. Note that the corrected W value coincides practically with the data we have got.
h is the length of electron drift space (cathode-collector spacing), tm
is time moment when the maximum current hits the collector. With this formula and the data presented by Vass et al [34] for E/N = 1376 Td (h = 65·10–3 m, tm
= 80 ns, DL
N = 4.3·1024 m–1s–1, N = 3.08·1021 m−3) we find the actual electron velocity W = 6.85·107 cm s−1 (taking into account the longitudinal electron diffusion onto electrodes). For the case considered Vass et al [34] got W = 8.04·107 cm s−1, i.e. 1.17 times higher value. Note that the corrected W value coincides practically with the data we have got.
Conclusions
In this work, we investigated the ignition of radio-frequency capacitive discharge in acetylene and in carbon dioxide. RF breakdown curves were measured in the range of distances between the flat electrodes from 4.5 mm to 30 mm in acetylene and from 5 mm to 40 mm in carbon dioxide at the frequency of 13.56 MHz. In the RF voltage range up to 2000 V, the diffusion-drift and Paschen's branches are present in the breakdown curves. Diffusion-drift branches have a region of ambiguous dependence of the RF breakdown voltage on the gas pressure and, accordingly, the turning point. From the measured coordinates of the turning points on the diffusion-drift branches of the RF breakdown curves, the electron drift velocity was determined in the reduced electric field range of 319 Td ≤ E/N ≤ 3409 Td (105 ≤ E/p ≤ 1136 V/(cm Torr)) in acetylene and 272 Td ≤ E/N ≤ 6240 Td (90 ≤ E/p ≤ 2060 V/(cm Torr)) in carbon dioxide.
Treating the breakdown criterion in the rf electric field and the electron motion equations demonstrated that the technique of electron drift velocity determination from the turning point on the diffusion-drift branch of the rf breakdown curves is universal for any gases. At the same time the dependence of the electron mobility μe and diffusion coefficient De on the reduced electric field E/N does not play any effect on the velocity values obtained with this technique. Besides, in the range of reduced electric field E/N we studied the ionization rate dominates the attachment rate of free electrons to gas molecules that permits one to ignore the effect the attachment plays on the electron drift velocity.
We compared the electron drift velocity values we had obtained with the results of other authors and explained the reasons why data by Pinhão et al [23] (for acetylene and Vass et al [34], Vass et al [35] (for carbon dioxide). Perhaps the data of these papers need to be corrected as they did not include the deformation of the electron cloud profile because of inverse longitudinal electron diffusion to the cathode and their direct longitudinal diffusion to the anode/collector. Taking this effect into account leads to substantial improvement of the agreement between not only with the registered values, e.g. Vass et al [34] and our data but also with the calculation with Monte Carlo technique made by the same authors.
Acknowledgments
This work was supported by the National Research Foundation of Ukraine in the framework of the project 2020.02/0234.
Data availability statement
The data that support the findings of this study are available upon reasonable request from the authors.