

Abstract
During H-mode plasma in ITER, type-I Edge Localized Modes can occur naturally leading to transient heat load (<10 GW m−2) on the tungsten divertor. Such high heat fluxes might therefore induce annealing effects, such as recovery and recrystallization, or even lead to surface melting and deterioration (e.g. cracks) of the plasma-facing components. To ensure sufficient lifetime of tungsten monoblocks is thus mandatory to understand how W will evolve when exposed to such transient heat loads. We present here results on the study of grain growth and damage threshold of tungsten induced by transient heat loads (from 1 to 15 ms, <3 GW m−2). Using a high-power laser facility, we simulate ELMs and we submitted samples to various heating durations up to melting temperature. Laser heating is combined to several imaging techniques, like SEM and optical microscopy, to study grain growth and damages on W. We observed that the growth kinetics strongly depends on the repetition rate with a rapid grain growth for 100 Hz heat loads. We eventually built a finite element methods simulations, benchmarked against our experimental results, to evaluate temperature gradients and recrystallized fraction of the material when exposed to unmitigated ELMs.
Export citation and abstract BibTeX RIS
1. Introduction
During H-mode plasma in ITER, type I Edge Localized Modes (ELMs) can occur naturally leading to transient heat loads on the tungsten divertor with power density between 1 and 10 GW m−2 on time scale of around 500 μs [1–3]. Unmitigated ELMs might therefore induce annealing effects, such as recovery, recrystallization (REX), and grain growth, or even lead to surface melting and deterioration (e.g., cracks) of the plasma-facing components (PFCs) [4], decreasing their lifetime and leading to plasma contamination. Different methods were experimentally employed to simulate the effect of ELMs on PFCs: electron beams [5], plasma guns [6], or laser [7]. Nevertheless, the role of some key parameters (e.g., ELMs frequency and duration) on annealing phenomena still needs deeper investigation. In this letter, we simulate transient reactor conditions using a high-power laser and we focus on the role of frequency, number, and duration of pulses on the grain growth rate and on the thermal shock fatigue resistance. We eventually used finite element methods (FEM) simulations, benchmarked against our experimental results, to investigate microstructure evolution in W during unmitigated ELMs.
2. Methods
2.1. Experimental
Thermal annealing tests were performed using the ChauCoLase (Chauffage Contrôlé par Laser, laser-controlled heating in English) setup, a high power laser facility developed to submit materials to extreme heat loads as described extensively in [8]. For this study we used a CW Ytterbium fiber laser (SPI laser Qube 2000) which can deliver 2000 W of maximum power with typical rising time of few μs. The main beam is sent through laser windows in a dedicated vacuum chamber with a base pressure of 5 × 10⁻³ mbar. The sample of interest (28×28×12 mm3 , purity 99.95 wt%) is placed at the center of the vacuum chamber on an insulating graphite sample holder that is in contact with only one side of the sample to minimize thermal losses. More details about the sample properties can be found in Durif A. [9]. Laser beam diameter on the sample surface is 900 μm in the present study. As shown in figure 1(a) the laser intensity distribution is quasi flat-top with a maximum incoming heat flux of 3 GW m−2. We stress that only 40% of incoming flux is absorbed by the sample [10]. Hereafter, we will refer only to the incoming flux. We were able to measure and to resolve temporally both the temperature evolution on the heated zone and on the entire W block thanks to two dedicated pyrometers only for pulses of 10 ms or longer. The spot size of the pyrometers is around 0.7 × 0.7 μm2.
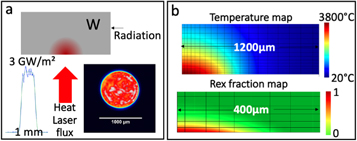
Figure 1. Numerical simulations of laser heating on 28 × 28 × 12 mm3 W samples. a. Incoming heat flux on W sample. The laser intensity distribution is quasi flat-top. b. Temperature and recrystallization maps obtained at the end of a 4 ms pulse, 3 GW m−2.
Download figure:
Standard image High-resolution image2.2. Simulations
FEM simulations using COMSOL Multiphysics were performed to estimate the temperature and the REX fraction of the heated zone varying different parameters, such as power densities (from 1 to 3 GW m−2), number, duration, and frequency of pulses. The simulations were conducted with a 2D axisymmetric model. For temperature calculations, laser heating was modelled as an incoming heat flux on the boundary. The materials' properties (specific heat capacity, thermal conductivity, and emissivity) were extracted from the ITER material properties handbook with the recommended values for pure W. Thermal radiation was considered on the boundaries of the W domain. We used the configuration shown in figure 1(a). The REX fraction (X) was estimated using the JMAK model based on the following equation:

where the Avrami exponent was set to 1.098, while for the parameter B and the incubation time, tinc , we used the temperature dependence determined in a previous study on the same material [9]. In order to predict realistic impact on a heat transfer analysis, the solid-liquid phase change was included in FEM analysis. We present in figure 1(b) typical results (temperature and REX maps) obtained after a 4 ms pulse with 3GW m−2.
FEM simulations were benchmarked against experimental temperature measurements during 10 ms pulses at 1 GW m−2. We stress that we did not measure the temperature in the heated zone for pulses shorter than 10 ms since the pyrometer resolution (1 ms) was not sufficient to resolve the entire temperature evolution. We considered in the FEM simulation the average temperature in the same area of the pyrometer measurement (0.7 × 0.7 μm2).
3. Results and discussion
3.1. Grain growth
We present in this section the grain growth rate of W investigated as a function of frequency and number of repetitive transient heat loads below the melting threshold (1 ms, 3 GW m−2). Figure 2(a) shows a typical SEM image obtained after a burst of pulses (i.e. 100 pulses, 100 Hz). We measured the size of grains in a 400x400 μm2 zone at the center of the image by considering averaging 200 lengths measurements, 100 grains per images and two lengths per grain as show in the inset of figure 2(a). We are aware that within this area there is a distribution along the diameter of sizes of grains. Such preliminary approach presents thus some limitations that must be overcome in future works. We stress that this choice represents only a compromise to measure the size of enough grains and thus compare the various experimental conditions. We present the results of this analysis in figure 2(b). We plot here the maximum of size distribution of grains as a function of pulse frequency for 20, 50, and 100 pulses. We observed an evident dependence of grain size both on frequency and number of pulses. The grain size increases of around 30%–40% going from 20 to 100 Hz, for a fixed number of pulses. It indicates that for the same incoming heat flux, the higher pulse frequency reduces the cooling time, increasing the base temperature and thus promotes recrystallization and grain growth. SEM images in backscattering mode point out that recrystallization is almost complete after 20 pulses, but for the 20 Hz pulse frequency. These qualitative observations are not completely in agreement with FEM results where we never observe a fully REX fraction after repetitive heat loads. We report in table 1 the REX fractions calculated with FEM analysis for the various cases. It increases of a factor 3.5 going from 20 to 100 Hz. The reason of the mismatch between experimental results and simulations could be an indication of JMAK model limitations in the case of transient heat loads. We stress that JMAK parameters have been obtained for isothermal annealing experiments as described in Richou et al [11]. More advanced recrystallization models can allow to describe more precisely the recrystallization kinetics in the case of transient loads and the following grain growth regime.

Figure 2. a SEM image of the irradiated zone after 100 pulses at 100 Hz. In red the zone where the grains size was measured. b Maximum of grain size distribution after 20, 50, and 100 pulses of 1 ms at 3 GW m−2 as a function of pulse frequency. c Percentile grain growth increase as a function of pulse number. The gray zone in figure 2(c) represents the grain growth for the cold rolled W (bottom limit) and the severely deformed W (the upper limit) from Suslova et al [12].
Download figure:
Standard image High-resolution imageTable 1. FEM results at the end of different heating loads: maximum temperature (in bold temperature higher than melting temperature), REX fraction calculated using JMAK model. For all simulations we set the incoming heat flux to 3 GW m−2.
| No of | Duration/Frequency | Tmax/Tbase | REX |
|---|---|---|---|
| pulses | ms/Hz | °C | (%) |
| 1/− | 2339/− | 0 | |
| 2/− | 3096/− | 47 | |
| 3/− | 3482/− | 100 | |
| 4/− | 3889/− | — | |
| 5/− | 3966/− | — | |
| 20 | 1/20 | 2349/27 | 0.2 |
| 50 | 2350/28 | 4.0 | |
| 100 | 2359/30 | 11.0 | |
| 20 | 1/50 | 2385/48 | 1.1 |
| 50 | 2416/50 | 11.1 | |
| 100 | 2417/52 | 27.0 | |
| 20 | 1/100 | 2448/115 | 4.0 |
| 50 | 2453/115 | 15.0 | |
| 100 | 2456/120 | 36.0 |
Grain growth was observed experimentally by increasing the number of pulses as expected due to the greater total incoming flux. Nevertheless, one can note that the grain growth rate strongly depends on the frequency. In figure 2(c) we show the grain growth increase with respect to the 20 pulses case and we compared our findings to results obtained at 1 Hz by Suslova et al [12]. The gray zone in figure 2(c) represents the grain growth for the cold rolled W (bottom limit) and the severely deformed W (the upper limit).
We observe that the lower the frequency, the higher the percentile increase. Such observation is consistent with a rapid grain growth kinetics when increasing the repetition rate due to heat accumulation effect.
3.2. Damages and melting
The melting threshold for 1.2 GW m−2 of absorbed power density was studied by varying the duration of pulses from 1 to 15 ms and by varying the number of pulses for a fixed duration. The presence of a melting zone was determined using optical microscopy. We observed W melting for a pulse duration ≥4.5 ms in good agreement with the results of FEM simulations presented in first section of table 1. We stress that W melting was observed also for pulses shorter than 4.5 ms when increasing their number as shown figure 3(a). This SEM image was obtained after 104 pulses of 1 ms at 20 Hz. The molten pool presents a typical grain structure induced by laser surface melting with small grains near the molten pool boarder [13] (figure 3(b1)) and grain size up to 60 μm at the center of molten zone (figure 3(b2)).

Figure 3. SEM images of cracked and melted zones after 3 GW m−2 heat loads on W: (a) 104 pulses of 1 ms at 20 Hz; (b) zoom of a panel; (c) and (d) 1 pulses of 13 and 14 ms, respectively.
Download figure:
Standard image High-resolution image
Moreover, from single pulse heat loads (1.2 GW m−2 absorbed power density) we estimated a cracking threshold of 70 ± 10 MW m−2 s0.5, much higher than the 14 MW m−2 s0.5 calculated by Li et al [14]. The reason of this overestimation could be due to instrumental limitations of our SEM. Moreover, we stress that the estimation of Li et al is based on a 1D geometry, while we are in a 2D axisymmetric heat transfer case (because of the millimetric beam). This implies that this formula is probably not the most suitable to estimation the cracking threshold since the threshold depends on the size of the beam. We present some examples of observed cracks in figures 3(c)–(d) obtained after 1 pulse of 13 and 14 ms, respectively. Intense surface cracks propagate on sub-mm range scale with typical width of 3–4 nm between grain boundaries. The presence of such fractures could alter the scenarios concerning plasma-surface interaction, for example by strongly increasing the fuel retention. We stress that we observed small cracks even for transient heat cycles experiments.
4. Conclusions
We presented here results on the study of grain growth and damage threshold of tungsten induced by transient heat loads (from 1 to 15 ms, <3 GW m−2) that simulate the effect of unmitigated ELMs on W divertor of ITER.
We discussed how the grain growth rate depends both on the number and the frequency of heat loads. We observed that the growth kinetics strongly depends on the repetition rate with a rapid grain growth for 100 Hz heat loads. Moreover, we show using FEM analysis that the isothermal JMAK model, commonly used to describe recrystallization kinetics, does not seem to be the most suitable tool to estimate the REX fraction and the grain growth regime in the case of transient heat loads. The use of more advanced recrystallization model, such as nonisothermal JMAK models [4, 15], is one of the perspectives of this work. Eventually, we determined a cracking threshold of 70 ± 10 MW m−2 s0.5 for base temperature of W lower than 300 K. As claimed by Li et al [7] plasma-material interactions and related phenomena (e.g., fuel retention and W sputtering) can be strongly perturbed by surface cracks and annealing phenomena. In spite of the increasing number of works dealing with the effect of ELM-like transient heat events on W divertor [16], the understanding of W behavior requires further studies under fusion relevant conditions, in particular to study synergical impact of the simultaneous presence of heat loads and H/He plasmas.
Acknowledgments
This work was carried out within the framework of the French Federation for Magnetic Fusion Studies (FR-FCM) and received some funding from FR-FCM.
Data availability statement
All data that support the findings of this study are included within the article (and any supplementary files).