

Abstract
Polyvinyl chloride (PVC) films loaded by different concentration of Carbon Nano Tubes (CNT) are prepared through a solution casting method. CNT are characterized using transmission electron microscope (TEM) and x-ray diffractometer (XRD). The analysis of the PVC-CNT films is carried out by using XRD, scanning electron microscope (SEM), and Fourier transform infrared (FTIR) to study the change in the polymer structure. UV–vis spectrophotometer is used to determine the optical parameters depending on the optical absorption data. It is found that, the direct and indirect optical band gap decrease with an increase in CNT nanoparticle content in the PVC matrix. The refractive index, optical dielectric parameters, and optical conductivity of the polymer films are investigated using the optical absorption data. These parameters are enhanced with the increase in the CNT concentration in the PVC matrix. The Wemple-DiDomenico model is used to calculate the optical dispersion parameters (like; oscillator energy, dispersion energy, static refractive index, dipole strength, and static optical dielectric constant). In addition, nonlinear refractive index, linear optical susceptibility, and third-order nonlinear optical susceptibility are investigated.
Export citation and abstract BibTeX RIS
1. Introduction
Due to the specific physical features of polyvinyl chloride (PVC), which include high-performance production, high stiffness, high chemical resistance and low cost of production, major applications in various fields have also emerged. For instance, cable electrical insulation, vehicles, medical, and packaging. Furthermore, the optical properties of PVC can be modified by addition of small amount of nanoparticles into the polymer matrix and can be used in optical fibers and other different optical applications. Several researches have been carried out to enhance the properties of the PVC films through doping process with nanoparticles such as SiO2 [1], TiO2 [2], Al2O3 [3], NiO [4], CdO [5], ZnO [6, 7], SnO2 [8], graphite oxide [9], tungsten oxide [10], CaCo3 [11], CuO [12], CdS [13], and carbon nanotubes [14]. It was shown that the addition of nanoparticles into the PVC matrix enhances its properties and extends its industrial and academic applications.
Recently, the big attention is paid to carbon nanotubes (CNT) due to their remarkable properties. CNT (single wall or multi wall nanotubes) exhibit significant electrical transport features, high tensile strength, excellent thermal stability, high Van der Waals binding energy, and high strength of covalent bonds between carbon atoms [15, 16]. They are widely used in various applications as individual material or as a filler in nanocomposite material [17]. Polymer nanocomposites based on CNT are of great interest in several applications, such as energy storage, chemical sensors, electromagnetic interference shielding and electronics [15–24].
Sterzyński et al [14] reported the increase in the glass temperature of the PVC films with the addition of very low content of carbon nanotubes into the PVC matrix. Molla-Abbasi [23] reported the shift in the glass transition to higher temperatures by increasing the CNT content in the PVC matrix. In addition, Al Naim et al [17] studied the effect of solvent mixtures (chloroform as a solvent for MWCNT and tetrahydrofuran as a solvent for PVC) and investigated its impact on the dispersion, thermal and electrical properties. Recently, Aziz et al [25] studied the effect of carbon nano-dots on the structure and optical properties of the PMMA matrix. It was found that the addition of carbon nano-dots enhance the absorbance and the optical parameters of PMMA film.
The goal of this work is to study the impact of small amounts of CNT (0.15%, 0.2, 0.35, 0.5, and 0.7 wt.%) on the structure and optical properties of the PVC matrix. The change in polymer structure is investigated using XRD and FTIR analysis, while the optical properties are studied using UV-visible spectrophotometer.
2. Experimental
The polymer polyvinyl chloride (PVC) and the solvent tetrahydrofuran (THF) were supplied by Chemical Reagent Company. The RAS Institute of Electrophysics has produced carbon nanotubes (CNT) at the Pulse Process Laboratory. Polymer solution was prepared by dissolving of PVC powder (6 gm) in THF (120 ml) at room temperature with continuous stirring for two hours. After that, CNTs were dispersed in the PVC solution using sonication, processor-Cole Parmer-CPX 750, at room temperature for 5 min. Ultrasonication technique is the most common method used for nanoparticle dispersion. The concentration (C) was calculated using the following equation,

where mn and mp are the masses of CNT and the polymer, respectively. The solutions were cast directly on glass dishes and evaporated at room temperature. The CNT concentrations in the prepared films were equal to 0.15, 0.20, 0.35, 0.5, and 0.7 wt.%. The same conditions were applied for all films during preparation in order to achieve a uniform polymer film thickness for optical absorption measurements (film thickness ∼100 μm).
CNT sample was prepared for transmission electron microscope (TEM) analysis as follows; a pinch of nanotubes was diluted in 2 ml of deionized water and an ultrasonic bath was used to disperse it for 5 min (at room temperature), then nanotubes were deposited on a carbon-coated copper mesh for TEM analysis. Measurements were carried out at 5 kV.
The CNT sample and polymer films were characterized via x-ray diffractometer (XRD) model Shimadzu XRD 6000, λ = 1.5418 Å with accuracy ±0.001°. Double Beam Spectrometer model-Cary 5000 UV–vis -NIR, Agilent Technologies-U.S., was used to investigate the optical properties (wavelength range 200 to 800 nm). Scanning electron microscope (SEM) was used to study the distribution of the CNT in the PVC matrix (JSM‐6510A, Jeol, Japan). Fourier transform infrared (FTIR) analysis of polymer films was investigated using SMART-OMNI-TRANSMISSION Nicolet iS10 FTIR spectrometer, with accuracy ±4 cm−1.
3. Results and discussion
3.1. TEM and XRD analysis
Firstly, TEM and XRD techniques are used to identify CNT. Figure 1 indicates the TEM image for CNT sample at two different magnifications.

Figure 1. TEM image for CNT sample at two different magnifications.
Download figure:
Standard image High-resolution imageTEM image shows the existence of CNT in the form of walls with outer diameter range 20–30 nm and an inner diameter range 7–10 nm. As shown, long fine tubes are tangled with each other due to the Van der Waals forces between nanotubes.
Figure 2(a) shows the XRD pattern for pure CNT sample. Sharpe and broad characteristic peaks for CNT are observed at 26.1° indexed to (002) plane of graphite carbon, and two other less intense peaks at 42.87° and 44.71° indexed to (100) and (101) planes respectively [26–28]. These peaks are related to an interplanar d-spacing of 3.41 Å, 2.1 Å and 2.025 Å, respectively. The broad of these peaks testifies the little size of the CNT. The CNT crystallite size (D) was calculated using Scherrer's equation [13],

where k is a constant (with a value of 0.9),  is the full-width at half maximum (FWHM), λ is the x-ray wavelength, and θ is the diffraction angle. The average crystallite size of CNT is about 5 nm, which is compatible with the result obtained by TEM analysis.

Figure 2. XRD patterns of pure CNT (a), and PVC-CNT films (b).
Download figure:
Standard image High-resolution imageFigure 2(b) shows the XRD patterns for the pure PVC film and PVC films doped with different content of CNT. The PVC film shows a broad halo in between 15°–30°, indicating the amorphous nature of the PVC film [7, 12]. This halo broadens with the addition of small amounts of CNT into the PVC matrix, and becomes pronounced at higher content of CNT (0.5 wt.%). It may be caused by the orientation of PVC macromolecules relative to nanotubes, as a result of dipole - dipole interaction between the carboxylic groups (-COOH) on the surface of the CNT and C-Cl bonds of the polymer (see FTIR spectra). In addition, hydrogen bonding between COOH groups and Cl atoms in PVC is possible.
3.2. SEM analysis
Figure 3 shows the SEM images for PVC-CNT films. It is observed that the sonication process destroyed the CNT in the PVC matrix, and the CNT seems like particles with spherical shape. Sonication with high power causes the CNT to be fragmented into smaller pieces, and also causes the formation of carboxylic groups (-COOH) on the surface of the CNT as proved in FTIR analysis (discussed below) [29]. It leads to the orientation of PVC macromolecules relative to nanotubes, as a result of dipole - dipole interaction between these carboxylic groups and polar C-Cl bonds of the polymer. At that, CNTs are distributed uniformly in PVC with little agglomeration, as the CNT can form clusters due to Van der Waals attraction between nanotubes [29].

Figure 3. SEM images for PVC–CNT nanocomposite films. 0.15 (a), 0.20 (b), 0.35 (c), 0.50 (d), and 0.70 (e).
Download figure:
Standard image High-resolution image3.3. FTIR analysis
Figure 4 depicts the FTIR of absorption bands spectra for the pure PVC and PVC-CNT nanocomposite thin films with different concentrations of CNT (i.e., 0.15, 0.20 0.35, 0.50, and 0.70 wt.%). The FTIR spectrum of pure PVC film shown in figure 2 exhibits the number of pronounced bands at 2972 cm–1 and 1434 cm−1 corresponding to C−H stretching and the wagging of methylene groups, respectively [6, 30]. In addition, single bands at 1332 cm−1, 1254 cm−1, 1064 cm−1, and 959 cm−1 represent the CH2 bending, C–H rocking and C–C backbone of PVC chain structure, and trans C–H wagging group of PVC [9, 31]. Moreover, pure PVC FTIR spectrum shows numerous C–Cl stretching modes at 833 cm−1 and 693 cm−1 [9, 31]. In addition, the band at 3660 cm−1 is attributed to the stretching vibration of OH group. The FTIR spectra of PVC–CNT nanocomposite films exhibit the same bands found in the pure PVC film, but with recognizable decrease in their band intensities significantly. This decrease in the band intensities of PVC–CNTs nanocomposites is caused by the high absorption coefficient due doping with CNTs and the reduced content of PVC polymer in the films. Further, the decrease in the bands intensity of C–Cl bands in the PVC–CNTs nanocomposite films may be due to a partially remove of the chlorine and formation of polyene groups (−HC = CH−)n in the composite film [32]. The obtained results indicate to the complexity of the interaction process resulting from the doping of oxygen-functionalized CNT. This was confirmed by the degradation extent of pure PVC films due to the doping with oxygen-functionalized CNT, which detected by investigating the band intensity at 1772 cm−1 corresponding to carbonyl group.

Figure 4. FTIR absorption spectra of PVC–CNT nanocomposite films.
Download figure:
Standard image High-resolution image3.4. Optical spectra and optical parameters
The absorption and transmission spectra for PVC films doped with various content of CNT are illustrated in figure 5. Figure 5(a) indicates that polymer films have enhanced their optical absorption by the increase in CNT content in the PVC matrix. The observed band at about 280 nm in the absorption spectra is related to π–π* electronic transition [3–5]. Furthermore, it is observed that the absorption edge ranged from 200 to 250 nm is redshifted by the increasing of CNT content in the PVC matrix, and this edge is specified with C–Cl bond [3, 5]. The inset of figure 5(b) shows the transmittance (T) of the PVC film without any additive. The PVC film transmittance is very high ∼90% in the visible region. The transmittance becomes lower with the addition of CNT in the PVC matrix, T ∼ 30% at 0.15 wt.% CNT and T ∼ 1% at 0.5 wt.% CNT (see figure 5(b)). This is related to the high absorption nature of the CNT. Along with this some CNT aggregates are formed at higher concentration, and the absorption edge is shifted toward higher wavelength region. Such result is in good accordance with the data obtained previously as for PVC embedded with NiO [4], CdO [5], SiO2 [33], graphene oxide [9], and Al2O3 [3]. The low transmittance and high absorption films make it suitable for using as thermoplastic solar collector [34].

Figure 5. Optical absorption (a) and the transmittance spectra (b) for PVC-CNT nanocomposite films.
Download figure:
Standard image High-resolution imageThe optical absorption spectra of the polymer films have been studied to determine the optical parameter: band gap (Eg ), absorption coefficient (α), Urbach energy (EU), and to identify the type of electronic transitions in the material. The absorption coefficient of the polymer films can be calculated using the following equation;

where A is the film absorbance and d is the film thickness. The optical band gap can be determined using Tauc's equation [35–37]:

where B is constant, hυ is the energy of the incident photon, Eg is the optical band gap for both possible transition direct and indirect depending on the value of the variable parameter m (m = 1/2 and 2 for allowed direct and allowed indirect transitions, respectively). The direct (Egd ) and indirect (Egi ) optical band gap are determined at hυ-axis from the intercept of the extrapolation of the straight portion of the curves to zero absorption [(αhυ)2 or (αhυ)1/2 = 0] as shown in figure 6 (direct state) and figure 7 (indirect state). The determined values are summarized in table 1. It is observed that the direct and indirect band gap decreases from 5.8 to 4.8 eV and from 4.8 to 4.05 eV, respectively, as the CNT content increases in the PVC matrix. This can be attributed to the rise of localized states formed within the band gap as a result of CNT loading into the PVC matrix. This result was confirmed by investigation of the band tail width using Urbach equation [3]. The obtained result of Urbach energy (EU ) are determined and summarized in table 1. Increasing of EU with an increase in CNT concentration confirms the increase of the amorphous state in the material and creation of defects in the band structure. Hence, optical band gap decreases as well.

Figure 6. The dependences of (αhυ)2 on hυ for PVC-CNT nanocomposite films.
Download figure:
Standard image High-resolution image
Figure 7. The dependences of (αhυ)1∕2 on hυ for PVC-CNT nanocomposite films.
Download figure:
Standard image High-resolution imageTable 1. Optical parameters (Egd , Egi , EU , and refractive index (n)) values for the PVC–CNT nanocomposite films.
| C, wt.% | Egd , eV | Egi , eV | EU , eV | n (λ = 600 nm) |
|---|---|---|---|---|
| pure PVC | 5.8 | 4.8 | 0.62 | 1.402 |
| 0.15 | 5.25 | 4.5 | 1.06 | 3.292 |
| 0.20 | 5.15 | 4.4 | 0.96 | 4.089 |
| 0.35 | 5.05 | 4.3 | 1.51 | 6.259 |
| 0.50 | 4.9 | 4.15 | 1.93 | 13.218 |
| 0.70 | 4.8 | 4.05 | 1.63 | 15.944 |
Figure 8 shows the refractive index (n) and the extinction coefficient (k) as the functions of wavelength for PVC-CNT nanocomposite films. It is obvious that both parameters (n and k) increase with the increase in CNT concentration in PVC matrix. The high refractive index of polymer materials became important parameter for the fields of highly reflective and polymer-optoelectronics applications [38]. The incident photons interact with the electrons of the host material and slow down their velocity, the film reflectivity increases as well due to the density of packing increasing with the increase in CNT concentration in the PVC matrix. Consequently, the refractive index increases as well. Furthermore, the change in the polymer structure contributes strongly in the change of the physical properties of the polymer films. In addition, the increase in the extinction coefficient is related to the increase in the absorption coefficient [39, 40].

Figure 8. Refractive index (a) and the extinction coefficient (b) versus the wavelength for PVC–CNT nanocomposite films.
Download figure:
Standard image High-resolution imageOptical dielectric parameters (dielectric constant ε' and dielectric loss ε'') depend on n and k values according to the following equations,


Figure 9 shows the dependences of (ε') and (ε'') on photon energy (hυ) for PVA–CNT films. It is observed that the real and imaginary parts increase by increasing of CNT concentration in PVC films. The same behavior like obtained in the absorption spectra, where the higher values are observed at the UV-region where high photon energy exist. Moreover, both ε' and ε'' are found to be increased with the increase of the CNT concentration. This can be related to the change in the band structure of the polymer films, as more states are created in the forbidden gap with increasing CNT concentration. In addition, the higher value of ε'' (in the UV region) is associated with the polarization effect which decreases gradually with increasing the incident photon energy [41].

Figure 9. Optical dielectric constant ε' (a) and optical dielectric loss ε'' (b) versus photon energy for the PVC–CNT nanocomposite films.
Download figure:
Standard image High-resolution imageOptical conductivity (σopt ) depends on the absorption coefficient and refractive index. It is calculated using the following equation,

where C is light speed in vacum. Figure 10 shows the variation of the optical conductivity with the incident photon energy for the PVA–CNT nanocomposite films. As shown, the optical conductivity increases as the CNT increases in the PVC matrix. This is caused by the creation of the new states in the forbidden gap, which contributes to the transfer of electrons from one state to another [9]. Hence, the optical band gap decreases and the optical conductivity increase as well.

Figure 10. The optical conductivity versus photon energy for PVC–CNT nanocomposite films.
Download figure:
Standard image High-resolution imageOptical dispersion parameters can be determined using single-oscillator fit (Wemple -DiDomenico model), which expressed in the following form [42],

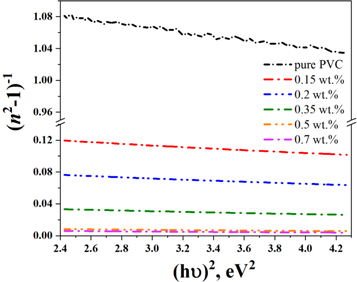
where E0 and Ed are the oscillator energy and the dispersion energy, respectively. The relation between (n2–1)−1 and (hυ)2, taken for the normal dispersion region below the absorption edge region at (hυ < Eg), is represented in figure 11. As shown, the lines intercept the (n2–1)−1 axis at points equal to (E0/Ed ) and the slope of these lines is equal to (1/E0 Ed ). The extracted values E0 and Ed are summarized in table 2.
Figure 11. The dependence of (n2–1)−1 on (hυ)2 for the PVC–CNT nanocomposite films.
Download figure:
Standard image High-resolution image
Table 2. Optical dispersion constants for pure PVC and PVC-CNT nanocomposite films.
| Sample (wt. %) | E0 (eV) | Ed (eV) | f (eV)2 | n0 | χ(1) | χ(3) | n2 (e.s.u) | εs |
|---|---|---|---|---|---|---|---|---|
| pure PVC | 6.81 | 5.97 | 40.65 | 1.370 | 0.0699 | 4⊡04×10−15 | 1⊡1×10⁻¹³ | 1.88 |
| 0.15 | 3.82 | 26.73 | 102.04 | 2.829 | 0.5575 | 1.64 × 10⁻¹¹ | 2.2 × 10⁻¹⁰ | 8.00 |
| 0.20 | 3.67 | 39.52 | 144.93 | 3.432 | 0.8579 | 9.19 × 10⁻¹¹ | 1 × 10⁻⁹ | 11.78 |
| 0.35 | 3.31 | 77.58 | 256.41 | 4.947 | 1.8689 | 2.07 × 10⁻⁹ | 1.6 × 10⁻⁸ | 24.47 |
| 0.50 | 2.89 | 247.08 | 714.29 | 9.299 | 6.8049 | 3.64 × 10⁻⁷ | 1.5 × 10⁻⁶ | 86.47 |
| 0.70 | 2.76 | 328.98 | 909.09 | 10.957 | 9.4783 | 1.37 × 10⁻⁶ | 4.7 × 10⁻⁶ | 120.05 |
The static refractive index (n0) is the refractive index at hυ = 0. So, equation (7) at this condition can be written as [10],

The extracted values of energies, Ed and E0, were used to calculate n0 values. Table 2 shows that n0 increases with an increase in CNT content in the PVC matrix.
Other important parameters like dipole strength for optical transitions (f) and static optical dielectric constant (εs) are calculated using the following equations [9],


The obtained values of εs and f are summarized in table 2. It is obvious that the increase in CNT content in the PVC matrix enhances these parameters.
The linear optical susceptibility χ(1), the third-order nonlinear optical susceptibility χ(3), and the nonlinear refractive index (n2) can be calculated in accordance to the obtained E0, Ed and n0 values using the following equations [3, 43],


It is obvious that the calculated values of χ(1), χ(3) and n2, summarized in table 2, increase with the increase in CNT content in the PVC matrix. WDD model have been used previously to evaluate the χ(1), χ(3) and n2 parameters for PVC system doped with different oxides like: graphite oxide [9], Al2O3 [3], NiO [4], CdO [5], and tungsten oxide [10]. As our results show, the PVC-CNT films are more promising in the production of nonlinear optical devices.
4. Conclusion
In conclusion, this work focus on the induced modifications of structural and optical properties of the PVC matrix doped by different concentrations of CNT (0.15, 0.2, 0.35, 0.5, and 0.7 wt.%). The formation and dispersion of CNTs in the PVC matrix were obtained and confirmed by TEM and SEM techniques. It is found that the inner diameter of CNTs have a diameter range of 7−10 nm. Sonication with high power causes the CNTs to be fragmented into smaller pieces in the PVC matrix. Therefore, CNTs are distributed uniformly in PVC with little agglomeration due to Van der Waals attraction between nanotubes. The crystallinity of the PVC-CNTs films was evaluated by the XRD technique. The XRD profile of the PVC film shows a broad halos, which reveals that the PVC film are partially crystalline with the dominant amorphous phase. After doping with different CNTs concentrations, the halos of PVC-CNTs nanocomposite films are broadened. This means that the CNTs alter the orderly arranged chunks into non-arranged ones with the formation of new bonds between CNTs and the PVC matrix. The FTIR spectra exhibit the PVC polymeric films have chemical bond stability after doping CNTs. However, the band intensities of the main functional groups are decreased with the increase in the CNTs concentrations, which attributed to a partially remove of the chlorine and formation of polyene groups in the composite films. The absorption edge is red-shifted and the polymer film transmittance becomes lower by the increasing of CNTs content in the PVC matrix. The direct and indirect band gap decreases from 5.8 to 4.8 eV and from 4.8 to 4.05 eV, respectively, as the CNTs content increases in the PVC matrix. The refractive index, the extinction coefficient, optical dielectric parameters, and optical conductivity are increased with the increase in CNTs concentration in PVC matrix. High refractive index materials extend the usability in different fields like antireflection coating. The linear optical susceptibility χ(1), the third-order nonlinear optical susceptibility χ(3), and the nonlinear refractive index (n2) are enhanced with the addition of CNTs. Therefore, the current study emphasizes that the use of CNTs modifies the optical properties of PVC-CNTs nanocomposite to be suitable in optical devices for high technological applications.
Acknowledgments
The authors would like to thank Prof. R. R. Sheha, Hot Lab. Center, Egyptian Atomic Energy Authority, for the facility in his laboratory during this research. As well as the authors would like to thank Dr. D. K. Kuznetsov, Ural Federal University, for his help with the TEM analysis.
Data availability statement
All data that support the findings of this study are included within the article (and any supplementary files).
Conflict of interest
The authors declare no conflict of interest.