

Abstract
The reduction in resistivity and modification of the thermoelectric power of perovskite oxides is in continuous demand because of its large scale industrial applications. Currently, electron or ion beam irradiations are the most preferred methods employed to improve its properties. The quantum of improvement achieved with these methods is appreciable, however, it involves intriguing technicalities in the production of the beams. Plasma is a natural medium with the presence of both electrons and ions that can be easily produced using the glow discharge technique. In this work, the effect of oxygen plasma exposure on the structural properties, electrical resistivity, and thermopower of Nd0.5Sr0.5MnO3 manganites is investigated. Powdered Nd0.5Sr0.5MnO3 manganites samples are prepared using the solid-state reaction method. It is found that plasma exposure has changed the lattice parameters thereby varying the cell volume, which are not normally seen in the case of electron beam exposure. Further, the electrical resistivity is observed to decrease significantly after plasma exposure that changed the transport properties. It is also observed that plasma exposure decreases the absolute value of thermopower at low temperatures but increases it at high temperatures.
Export citation and abstract BibTeX RIS
1. Introduction
Extensive research in the ABO3 type perovskite oxides has unfurled manifold phenomena such as colossal magnetoresistance (CMR) [1, 2], high Curie temperature (TC ) [3], colossal thermoelectric power (TEP) [4], piezoelectricity [5], magnetocaloric effect [6] and superconductivity [7]. Furthermore, weakening of the double exchange (DE) mechanism, changes in charge carrier concentration, and lattice distortion has been observed in mixed-valence manganites attained by doping at the A- or B-site with suitable dopants [8, 9]. The manganites, thus formed are represented by the chemical formula A1−x Bx MnO3, where A = rare earth element, B = alkaline earth element, and x = mole fraction of the dopant. As a result of the diverse studies, these oxides have emerged as potential candidates for memory devices, magnetic refrigeration, solid oxide fuel cells, and solar cells [10–13].
Several scientific reports have illustrated that properties of manganites are sensitive to external perturbations like pressure, irradiation with energetic particles like ions, electrons, neutron, x-ray, and lasers [14–18]. Ion and electron beam irradiations are observed to be instrumental in producing defects such as vacancies, dislocations, and defect clusters, which in turn induce significant deviation in the microstructure as well as the distribution of oxygen vacancies in the material [19–22].
Consequently, the transport properties of the material are modified. There are several isolated studies available on the influence of ion beam (IB) and electron beam (EB) irradiation on the structural and transport properties of doped manganites. Transition metal oxides (TMO) has been widely used in optoelectronic devices like solar cells [23, 24]. Modification of properties of these oxides due to plasma treatment is reported in a few studies [25, 26]. Therefore, plasma exposure of perovskite manganites may be an alternative to improvise their properties. This possibility is authenticated by one such study, where it has been reported that oxygen plasma exposure led to the increase in oxygen content in La0.7Ca0.3MnO3−δ [27].
Further, the formation of structural defects accompanied by a broadening of the resistive transition, a decrease in the metal-insulator transition temperature, and the Curie temperature were also reported. Enhancement of conductivity was also reported for oxygen plasma-treated La0.7Ca0.3MnO3−δ thin film [28]. Again in, another study it is clearly shown that low-pressure air plasma exposure on EuxSr1−xMnO3 can successfully modify the electrical resistivity of doped manganites [29]. In this study, it was shown that the variation of resistivity depends on the doping concentration. The plasma treatment enhanced the resistivity for x = 0.2, 0.3 & 0.4, while it decreases for x = 0.5. An earlier study on Nd0.5Sr0.5MnO3 manganite, which involved a systematic investigation of EB dosage on the structural and electrical properties revealed that the resistivity decreases with EB irradiation [22]. The modifications as a result of plasma exposure, may, however, be quite distinct from those due to EB or IB radiation. Although there is substantial work on the plasma irradiation on the properties of thin-film, there is scanty research on the effect of plasma exposure on the properties of perovskites in macro forms.
This has motivated us to undertake the effect of oxygen-plasma exposure on bulk Nd0.5Sr0.5MnO3 (NSMO) manganite and correlate the structural and transport properties of the investigated sample. The focus of this study is on the elucidation of the structural and transport properties through x-ray diffraction (XRD), temperature-dependent electrical resistivity as well as Seebeck coefficient measurements. Further, x-ray photoelectron spectroscopy (XPS) has been performed on the unexposed as well as exposed samples to validate the influence of plasma exposure on the manganite. This study gives unique information about plasma exposure on the perovskite materials in its macroscopic size and stands out differently and adds an advantage in terms of applications.
2. Experimental details
2.1. Sample preparation
Powder samples of polycrystalline Nd0.5Sr0.5MnO3 were synthesized using a conventional solid-state reaction method. High purity (>99.99%) powder of Nd2O3, MnO2, SrCO3 were preheated at around 800 °C for 5 h. These powder were then taken in the stoichiometric proportion and subjected to rigorous grinding for 5–6 h. The grounded mixture was then subsequently calcined at 1100 °C for 24 h. The calcination was repeated thrice with intermittent grindings. After the final calcination, the calcined product was re-grounded and pressurized to form pellets. Sintering of the pellets was done at 1250 °C for around 36 h.
2.2. Plasma irradiation
The pellets were then exposed to oxygen plasma for a duration of 60 s. The conventional glow discharge method was used to produce oxygen plasma. The plasma chamber had a height of 50 cm and a diameter of 40 cm wherein the working pressure was maintained at 1.7 × 10⁻¹ mbar by introducing the oxygen gas and the discharge condition was achieved using a proper power source. The typical plasma density and temperature as measured by plane Langmuir probe were 108–109 cm−3 and 1–3 eV respectively. Then the samples were kept on a target holder and placed inside the plasma system, where there is almost uniform plasma density. The sample was treated with oxygen plasma at room temperature for 60s under a uniform discharge condition.
2.3. Structural characterization XRD
Characterization is an essential technique to evaluate the crystallinity, phase, and structural parameters of the samples. XRD data of unexposed and plasma exposed samples were recorded in the range of 20°–80° with a step size of about 0.02° using Rigaku Miniflex diffractometer with the x-ray source as Cu Kα radiation (λ = 1.54 Å). EDS study augmented our result by confirming the stoichiometric proportion of the sample. EDS measurement was carried out with EVO MA18 with Oxford EDS(X-act) at room temperature. For x-ray photoelectron spectroscopy (XPS) measurement PHI 5000 VERSAPROBE II was employed, which validated the surface composition of the samples and determined the oxidation states of the Mn species in the unexposed and plasma exposed sample under investigation.
2.4. Electrical resistivity and thermopower measurement
The four probe method was employed for the measurement of the dc electrical resistivity within the temperature range 10–300 K in a closed cycle refrigerator (CCR). A constant current of 1 mA was provided through the current terminals using Keithley Current Source (Model 6221), while the voltage across the voltage terminals was measured by Keithley Nanovoltmeter (Model 2182A). In addition, another significant transport property i.e. the Seebeck coefficient (S) was recorded in the temperature range 5–300 K, using differential DC method.
3. Results and discussions
The pristine and plasma exposed samples studied using different characterization techniques reveal very interesting properties about polycrystalline Nd0.5Sr0.5MnO3.
3.1. Structural properties
Rietveld refinement using FullProf program was employed to analyze the XRD data. The fitting is shown in figure 1. From the analysis, the lattice parameters of the unexposed and plasma exposed samples were derived. The analysis also validates the purity and phase of the sample within experimental measurements. Both unexposed and plasma exposed NSMO samples have orthorhombic structure and Pbnm symmetry. Hence, we can conclude that the symmetry of the system is unaltered by plasma exposure. Table 1 enlists the values of structural parameters of the samples as derived from XRD analysis. The lattice parameter, a decreases while b and c increases as a result of plasma exposure.
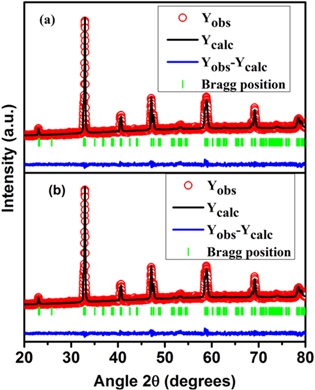
Figure 1. Rietveld refinement plots of XRD data for (a) pristine and (b) plasma exposed sample of Nd0.5Sr0.5MnO3 manganite.
Download figure:
Standard image High-resolution imageTable 1. Structural parameters of pristine and plasma exposed NSMO manganites derived from Rietveld refinement of XRD pattern.
| Dosage | Pristine | Plasma exposed |
|---|---|---|
| System | Orthorhombic | Orthorhombic |
| Space Group | Pbnm | Pbnm |
| a (Å) | 5.4737 (0.0004) | 5.4673 (0.0007) |
| b (Å) | 5.4338 (0.0004) | 5.4426 (0.0006) |
| c (Å) | 7.6438 (0.0006) | 7.6823 (0.0007) |
| α = β = γ (degrees) | 90 | 90 |
| Cell volume | 227.35 (0.03) | 228.60 (0.05) |
| Mn–O1 (Å) | 1.945 | 1.928 |
| Mn–O2 (Å) | 1.960 | 1.940 |
| Mn–O1–Mn (degrees) | 158.58 | 170.23 |
| Mn–O2–Mn (degrees) | 159.20 | 164.5 |
| χ2 | 1.27 | 1.26 |
| Crystallite size (nm) [Debye–Scherrer formula] | 38.05 | 32.38 |
| Crystallite size (nm) [Williamson-Hall method] | 37.38 | 31.22 |
| Strain ×10−4 [Williamson-Hall method] | 2.83 | 3.56 |
From table 1 it is evident that there is a reduction in the particle size post plasma exposure. This in turn increases the surface area, which leads to an increase in cell volume [30]. Plasma induces a surface modification in the range of 20∼200 nm depending upon the energy of plasma as observed in most of the cases. The oxygen plasma used comprises of charged species along with oxygen radicals and energetic photons, which is responsible for a reduction in the particle size. Plasma is an established technique used in the synthesis of nanoparticles which can easily reduce the particle size depending upon the time of exposure [31].
Bond angle and bond length were also generated from the FullProf program, which has been tabulated in table 1, which shows that the apical bond length Mn–O1 as well as the basal bond length Mn–O2 diminishes due to plasma treatment. As a result, the tilt angle {180-(Mn–O–Mn)}/2 between two adjacent MnO6 octahedra decreases.
Hence, the Jahn-Teller distortion of the octahedra weakens [32]. On the contrary, enhancement of the apical bond angle Mn–O1–Mn and basal bond angle Mn–O2–Mn is observed due to plasma treatment. The crystallite size has been measured for both the pristine and plasma exposed (PE) samples using the well-known Debye–Scherrer (DS) formula and Williamson-Hall (WH) plot method. Debye–Scherrer formula is written as

where D is crystallite size, K (=0.94) is the shape factor, λ (=1.54 Å) is the wavelength of x-ray radiation, and  is the full-width half maxima of the most intense diffraction peak corresponding to the Bragg angle 2θ. DS method accounts for the XRD peak broadening only due to crystallite size. So, we also adopt the WH plot method to determine the crystallite size. In this method, the XRD peak broadening is attributed to the crystallite size as well as the lattice strain. WH formula is represented as

where k = 0.75 (for spherical particles) and  is the strain [33]. Figure 2 shows the WH plot for both pristine and plasma exposed samples. It is observed from both methods (DS &WH) that plasma exposure leads to a decrease in the crystallite size. The strain is computed from the slope of the WH plot, and it is observed to increase as a result of plasma exposure.
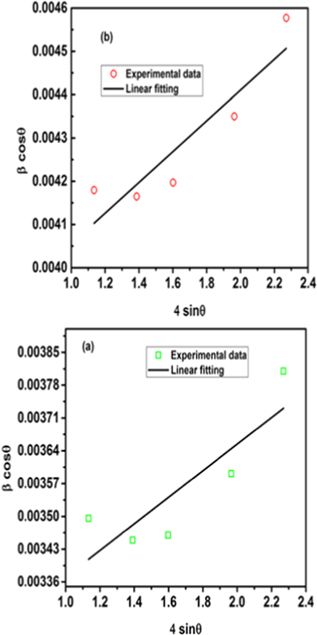
Figure 2. Williamson-Hall plot for (a) pristine and (b) plasma exposed of Nd0.5Sr0.5MnO3 manganite.
Download figure:
Standard image High-resolution imageEDX measurement was carried out to ascertain the compositional purity of the pristine sample. The measured compositions of the elements were computed as given in table 2, which is found to be close to its nominal value. The analysis supports the accomplishment of the synthesis of the sample with no significant stoichiometric loss of elements within experimental limits.
Table 2. Elemental compositional analysis of NSMO manganite using EDS.
| x | Element | Nominal composition | Experimental composition |
|---|---|---|---|
| 0.5 | Nd | 0.5 | 0.50 |
| Sr | 0.5 | 0.49 | |
| Mn | 1 | 1.00 |
3.2. XPS analysis
The wide survey scan of both the unexposed and plasma exposed NSMO samples, depicted in figure 3, validate the chemical composition of NSMO sample with the peaks of Nd3d, Sr3d, Mn2p, O1s, and the adventitious C1s peaks at binding energy values, which are in close agreement with previous reports [34]. The C1s peak appears owing to the unavoidable contaminant carbon on the specimen's surface. A detailed study has been done on the core energy level XPS data for Mn2p, Nd3d, Sr3d, and O1s. The doublet Mn2p spectrum as shown in figure 4 for the UE sample is attributed to the spin-orbit splitting into Mn2p3/2 and Mn2p1/2 peaks approximately at 641.8 eV and 653.25 eV, respectively. The separation between these peaks is about 11.45 eV, which is in good agreement with earlier reports [35]. Analysis of the doublet Mn2p spectrum confirms the occurrence of mixed valence states (Mn3+ and Mn4+) of Mn ions. Mn3+ and Mn4+ peaks are observed to be located at 641.4 eV and 642.8 eV respectively. The atomic concentration of Mn3+ and Mn4+ is found to be 51.4% and 48.6% thereby rendering the ratio Mn4+/Mn3+ as 0.945, which is very close to the nominal value of 1 in the case of half-doped manganites [4, 36]. Plasma exposure does not seem to affect the peak position of Mn4+ and Mn3+ peaks significantly. However, Mn3+ and Mn4+ concentrations are found to be 44.1% and 55.9% respectively making the Mn4+/Mn3+ ratio as 1.26 which hints toward an oxygen rich sample [37, 38].
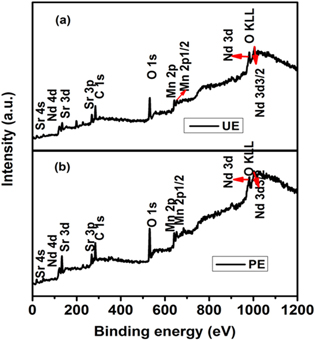
Figure 3. XPS wide spectrum for (a) pristine and (b) plasma exposed sample of Nd0.5Sr0.5MnO3 manganite.
Download figure:
Standard image High-resolution image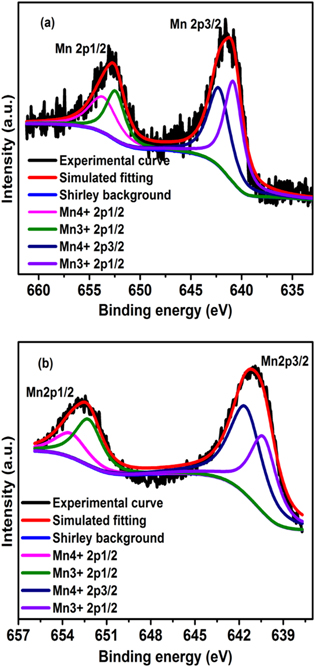
Figure 4. Core level fitting of Mn2p spectra for (a) pristine and (b) plasma exposed sample of Nd0.5Sr0.5MnO3 manganite.
Download figure:
Standard image High-resolution imageThree peaks are required to properly fit the O1s core spectrum, as seen in figure 5(a), for the UE NSMO sample at 529.1 eV, 530.6 eV, and 531.8 eV corresponding to Mn–O, Nd–O, and Sr–O bonds respectively based on Barr's classification of oxides [39]. Similar fitting of the O1s core spectrum shown in figure 5(b) for the PE NSMO sample depicts that plasma exposure does not vary the peak positions much as Nd–O, Mn–O, and Sr–O bonds are fitted at 530.22 eV, 528.6 eV, and 531.66 eV respectively. However, it is observed from the fitting, that Mn–O content is largest for the unexposed sample while Nd–O and Sr–O content increases for the plasma exposed samples. The increase in the Mn4+/Mn3+ ratio, as well as the increase in Nd–O and Sr–O content, as a consequence of plasma exposure, is a clear indication of oxygen non-stoichiometry, which is mainly due to the incorporation of oxygen due to plasma exposure. Curve fitting of the core spectra of Sr shown in figures 6(a) and (b) predicts the existence of SrO and SrCO3 while that of Nd given in figures 6(c) and (d) predicts the existence of Nd2O3, which may be from the lattice of the sample itself. In the case of Nd 3d spectrum, plasma exposure does not affect the peak position of Nd2O3 much but the O KLL peak corresponding to an Auger transition becomes prominent [34]. Post plasma exposure, the peak positions of all components of Sr 3d spectrum are not affected much, while the peaks become sharper.

Figure 5. Core level fitting of O 1s spectra for(a) pristine and (b) plasma exposed sample of Nd0.5Sr0.5MnO3 manganite.
Download figure:
Standard image High-resolution image
Figure 6. Core level fitting for Sr 3d spectra (a) pristine and (b) plasma exposed sample and core level fitting for Nd 3d spectra (c) pristine and (d) plasma exposed sample of Nd0.5Sr0.5MnO3 manganite.
Download figure:
Standard image High-resolution image3.3. Electrical resistivity
Temperature dependent electrical resistivity ρ(T) for the untreated and plasma treated samples of NSMO is shown in figure 7. Insulating behavior is depicted for the untreated sample, which is consistent with other reports [22, 40]. Through the entire range of temperatures, there is no indication of the metal-insulator transition. From the inset of figure 7, it is interesting to note that post plasma exposure, the behavior remains unchanged, though there is a drastic reduction of resistivity at all temperatures for the plasma treated sample. This sharp reduction in the resistivity may plausibly be attributed to the elongation of the Mn–O–Mn bond angle (as depicted in table 1) due to plasma treatment.
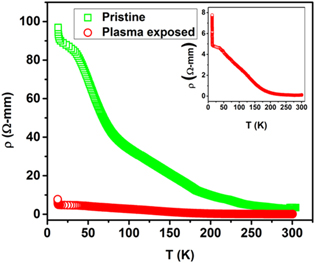
Figure 7. Temperature dependent resistivity curves and fitting of resistivity for pristine and plasma exposed Nd0.5Sr0.5MnO3 samples.
Download figure:
Standard image High-resolution imageDue to the stretching of the bonds, the prospect of charge carrier hopping between the Mn3+ and Mn4+ ions enhances, thereby boosting the conductivity. Further, as a result of oxygen plasma treatment, oxygen perhaps diffuses into the sample, which also contributes to the reduction in resistivity, which is corroborated by the XPS analysis. In order to reveal the conduction mechanism involved in our investigated samples, we have considered the two well-known models (i) small polaron hopping (SPH) model [41] for high temperatures and (ii) variable range polaron hopping (VRH) model [42] for low temperatures. The isolation of the two temperature zones has been done in terms of Debye temperature θD, which has been derived from the deviation of the straight line fit of the SPH model [43] as seen in figure 8. SPH model is valid in the temperature zone  and mathematically represented as

where EA
signifies the activation energy, T the absolute temperature, and ρ0 the residual resistivity. Figure 8 exhibits that the variation of ln (ρ/T) w.r.t 1/T, which is a straight line thereby confirming that small polarons are involved in the conduction process for the sample when  We extract the value of the activation energy from the slope of the straight line fit. It is seen that the activation energy increases with plasma treatment. For
  we use the VRH model which is expressed as

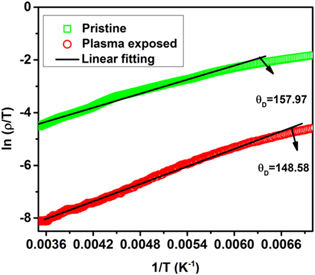
Figure 8. Fitting of resistivity with small polaron hopping model for the temperature zone  for pristine and plasma exposed Nd0.5Sr0.5MnO3 samples.
Download figure:
Standard image High-resolution imageFigure 9 shows that this model is applicable in the temperature zone  The slope of this curve gives the value of T0 and the density of states at the Fermi level N(EF
). These two parameters are related through the equation
The slope of this curve gives the value of T0 and the density of states at the Fermi level N(EF
). These two parameters are related through the equation

Here, α is the electron wave function decay constant, which quantifies the confinement of charge and kB is the Boltzmann constant [44]. N(EF) is observed to increase as a result of plasma treatment.

Figure 9. Fitting of resistivity with variable polaron hopping model for the temperature zone  for pristine and plasma exposed Nd0.5Sr0.5MnO3 samples.
Download figure:
Standard image High-resolution image3.4. Thermoelectric power
The behavior of thermoelectric power (TEP) S for the pristine and PE NSMO samples is shown in figure 10. In the entire temperature range of investigations S, for the pristine as well as plasma treated sample, is negative implying the existence of electrons as the predominant charge carriers. It is observed that the absolute value of S increases with an increase in temperature in the case of an unexposed sample. Further, the plasma exposed sample also exhibits a similar variation of S with temperature. However, plasma treatment decreases the absolute value of TEP for high temperature (>225 K) while it is increased for low temperature.
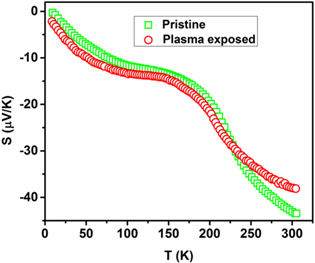
Figure 10. Temperature dependent thermopower curves for pristine and plasma exposed Nd0.5Sr0.5MnO3 samples.
Download figure:
Standard image High-resolution imageAnalysis of the thermoelectric data complements the information regarding the conduction mechanism provided by the resistivity data. Therefore, similar to resistivity, thermoelectric data is analyzed using SPH and VRH models in two different temperature regimes. SPH analysis (figure 11) is done at the high temperatures, which is governed by the following equation

where kB is the Boltzmann constant, Δ is the activation energy and α is a constant, which is related to the entropy of the charge carriers [41]. The computed values of Δ and α is given in table 3. Small polarons are responsible for the transport properties in both the pristine and plasma treated samples as α < 1.
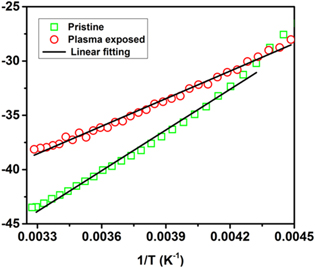
Figure 11. Fitting of thermopower with small polaron hopping model for pristine and plasma exposed Nd0.5Sr0.5MnO3 samples.
Download figure:
Standard image High-resolution imageTable 3. Fitting parameters obtained from resistivity and thermoelectric power data for NSMO samples.
| SPH Model fitting for resistivity | VRH Model fitting for resistivity | SPH Model fitting for thermopower | VRH Model fitting for thermopower | ||||||
|---|---|---|---|---|---|---|---|---|---|
| Dosage | EA (meV) |
 (Ω-mm) (Ω-mm) | T0 ×  (K) (K) |
 (Ω-mm) (Ω-mm) | N(EF) ×  (eV−1 m−3) (eV−1 m−3) | Δ (meV) | α | S0 (μV/K) | K (μV/K1/2) |
| Pristine | 76.5 | 53.4 | 3.54 | 0.44 | 6.45 | 12.49 | −0.98 | 5.18 | 1.73 |
| Plasma exposed | 95.4 | 0.60 | 1.27 | 0.93 | 1.70 | 8.46 | −0.77 | 2.67 | 1.73 |
Further, it can be seen from Table 3 that the activation energies obtained by analysing the resistivity data (EA ) are much larger than that from thermopower data (Δ). This large difference suggests SPH conduction in the investigated samples [45]. The difference in the results is because part of the activation energy EA is designated for the creation of the carriers and the rest (Δ) is utilized to set off it's hopping [45]. The activation energy, Δ is observed to diminish due to plasma treatment, which boosts the conductivity in the PE sample. For low temperatures akin to the resistivity analysis we use the VRH model, which defines the thermoelectric power as


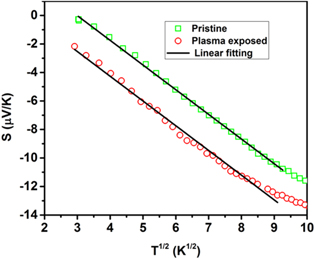
where ξ is a constant that determines the energy width of the conducting states [46]. Figure 12 conforms to the VRH model of thermopower at low temperatures and the fitting parameters are depicted in table 3.
Figure 12. Fitting of thermopower with variable range hopping model for pristine and plasma exposed Nd0.5Sr0.5MnO3 samples.
Download figure:
Standard image High-resolution image
4. Conclusions
Systematic studies of structural and transport properties for NSMO manganites have been undertaken. Further, these samples have been exposed to plasma and similar studies on structural and transport studies were conducted.
XRD was conducted for the evaluation of the structural parameters and analyzed using Rietveld refinement. The refinement reveals the existence of a single phase for the unexposed as well as plasma exposed samples. Interestingly, though plasma exposure produces changes in the cell parameters it does not induce any change in the cell structure. XPS analysis confirms the existence of two different oxidation states of Mn viz. Mn3+ and Mn4+ in their nominal ratio ∼1 for unexposed samples while plasma exposure enhances Mn4+ content thus indicating an oxygen rich sample.
The behaviour of the electrical resistivity of the pristine and plasma exposed samples are found to be the same. However, the resistivity is observed to decrease drastically due to plasma exposure, which is attributed to the incorporation of oxygen into the sample. It is also observed that plasma exposure does affect the insulating behavior of the sample. The conduction mechanism at high temperature could be elucidated by the SPH model, which indicated the predominance of small polarons for the conduction. At low temperatures, the conduction is carried out by variable range polarons are responsible.
The thermoelectric power of both the pristine and the plasma exposed samples exhibits negative character implying that electrons are the majority charge carriers. The nature of different types of conduction at the different temperature zones is augmented by the TEP data. TEP studies also reveal n-type conductivity for the investigated samples. A decrease in the absolute value of S is observed at low temperatures while it increases for high temperatures due to plasma exposure.
The activation energy is observed to be more than the thermoelectric power, which is more due to the creation of the carriers and the rest is used in the utilization of hopping. It is worthy to mention that plasma treatment reduces the activation energy, Δ which enhances the conductivity in the PE sample.
Acknowledgments
One of the authors (Ashok Rao) acknowledges the Department of Atomic Energy, Board of Research in Nuclear Sciences (DAE-BRNS), Government of India for financially supporting this work (2011/34/22/BRNS). One of the authors (Pronita Chettri) acknowledges Sikkim Manipal University, for financially supporting this work under SEED GRANT: Endowment Fund (1094/SMIT/OO/319/2018).