

Abstract
Understanding of fuel retention and release processes from materials for ITER (International Thermonuclear Experimental Reactor) is important from fundamental and technological aspects. Detailed information regarding fuel retention and release characteristics will allow global fuel inventories to be estimated in fusion devices as well as indicate the requirements for development detritiation methods and the re-use of tritium. Selected beryllium (Be) tiles were extracted from the JET vacuum vessel after each experimental campaign period with the ITER-like wall (ILW); so called ILW1 (2011–2012), ILW2 (2013–2014) and ILW3 (2015–2016). Desorption of hydrogen isotopes of samples taken from the inner wall guard limiter (IWGL), outer poloidal limiter (OPL) and dump plate (DP) tiles were analysed by means of thermal desorption spectrometry (TDS). The results presented compare data across ILW1, ILW2 and ILW3 and show the long term trends of fuel retention in Be limiter tiles. For all three campaigns the level of retention correlates with erosion and deposition that takes place during plasma operations Deuterium retention varies from 0.01–1 × 10¹⁸ atoms cm–2. Deuterium release takes place in several stages, related to different types of traps which can be within the co-deposit layer and/or below the surface in the Be bulk, with the main release stages around 700–760, 850–900 and 1020 K. The level of tritium in Be was found to be 104 times lower than deuterium for ILW campaigns 1–3.
Export citation and abstract BibTeX RIS
1. Introduction
The Joint European Torus (JET) tests materials for the International Thermonuclear Experimental Reactor (ITER). Accordingly, the ITER-like wall (ILW) project provides the same plasma facing materials that will be used in ITER. Before the start of the experimental campaign of 2011–2012, the wall and the divertor of JET were changed and the ILW was installed. Bulk beryllium on Inconel carriers were used for the inner and outer limiters, the divertor surfaces were faced with tungsten (W) [1]. For erosion-deposition studies marker coatings have been developed [2].
Performance of the materials is limited by surface erosion [3] and fusion fuel retention [4]. Accumulation of hydrogen isotopes in the plasma facing materials can occur as result of implantation in plasma facing materials as well as due to deposition with eroded particles. The erosion-deposition studies have shown dark deposition patterns on the left and right ends of the inner wall guard limiter (IWGL) tiles, but not on the central part of the tile [5].
Temperature programmed desorption studies are applied for determination of release of the tritium [6] and deuterium [7] from the plasma facing components.
This article aims to estimate the release of hydrogen isotopes from IWGL tiles from ILW1 (2010–2012), ILW2 (2012–2014) and ILW3 (2015–2016) campaigns in order to estimate fuel retention in different zones of the limiter tiles.
2. Experimental
Selected beryllium (Be) tiles were extracted from the JET vacuum vessel after each ILW experimental campaign period. Both ILW1 and ILW2 lasted for about 19.5 h of plasma discharges including approximately 13 h of the limiter and 6.5 h of X-point operation [8]. ILW3 had a longer plasma operation time 23.33 h [9]. There were also differences in the total input energy (ohmic, neutral beams, ion cyclotron, lower hybrid): 150.6 GJ in ILW1, 200.5 GJ in ILW2 [8] and 245 GJ in ILW3 [9].
In post-mortem studies, 1.2 cm * 1.2 cm samples were cut from castellated Be tiles [10]. Desorption of hydrogen isotopes of samples taken from IWGL tiles were analyzed by means of thermal desorption spectrometry (TDS).
Annealing was performed in vacuum with a heating rate 10 K min−1 up to 1050 K with a dwell time of 2 hours at the maximum temperature. In TDS experiments, it was found that Be evaporation already takes place at ∼1070 K, so the annealing was limited to 1050 K [7]. The release of hydrogen isotopes during annealing was measured with a quadrupole mass spectrometer, Hiden Analytical Ltd (model 640100). A sample preparation method described previously [7] was slightly modified and applied.
For calibration of deuterium release, D2 and H2 bottles with a calibrated leak valve were used. Calibration factors for D2, HD and H2 were calculated assuming that the leak rate is proportional to the desorption rate and ionization properties of D2, DH and H2 molecules are similar [7, 11]. Therefore the measured calibration factors for H2 is 4.1 * 108 and for D2 is 6.8 * 108 molecules/count and the calibration factor for HD is 5.4 * 108 molecules/count.
For characterization of tritium release several 'standard' Inconel samples were cut from MkIIA divertor component that was present in JET during the deuterium-tritium experiment DTE1 performed in JET in 1997 [12], 13 years before installation of ILW tiles. The size of samples was 1.2 cm * 1.2 cm, weight 2 g. Tritium activity was estimated with a pyrolysis method followed by liquid scintillation. Tritium concentration values were applied as 'references' for TDS measurements. Knowing both the mass and size of the sample it is possible to convert tritium activity from Bq g–1 to atoms cm–2 using the tritium decay constant λ = 1.787 * 10−9 s−1 [13].
3. Results and discussion
The results presented compare data across ILW1, ILW2 and ILW3 and show the long term trends of fuel retention in Be limiter tiles. For all three campaigns the level of retention is correlated with the erosion and deposition that takes place during plasma operations.
This is most noticeable for the midplane IWGL tile, which has two main zones—an erosion zone in the central part of tile and deposition zones at each end of the tile where minimal plasma interaction occurs, figure 1. Deuterium and tritium levels are higher in the deposition areas than in the erosion area, and similarly for the tritium content, indicating co-deposition with plasma impurities [14]. For ILW2 a tendency for both deuterium and tritium concentrations to be higher on the sides of the tile than in middle part is less noticeable. Following ILW3 the single measurement point in the erosion zone appears anomalous (triangle in figure 1), but further measurements are in hand.
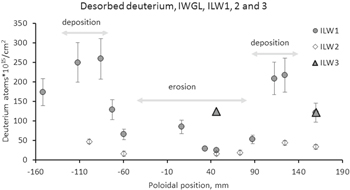
Figure 1. Thermally released deuterium atoms from IWGL tile samples, ILW1, 2 and 3.
Download figure:
Standard image High-resolution imageThe amount of thermally released deuterium is also found to be lower at the inner midplane limiter and dump plate compared with the outer midplane limiter which experiences lower heat flux during operations. Deuterium concentrations vary from 0.01–1 * 1018 atoms cm–2 for the limiter tiles.
3.1. Deuterium release profiles
Deuterium release takes place in the form of HD molecules (mass 3) and D2 molecules (mass 4). The source of hydrogen for the formation of HD may be due to the presence of hydrogen in the TDS analysis chamber or the presence of hydrogen in the sample originating from plasma operations and exposure in air [7]. During one thermal annealing, up to 99% deuterium is released. ∼1% D2 remains bonded and can be released during repeated heating of the Be sample, around 970 K. Deuterium release profile for an IWGL tile 1st and 2nd heating is in figure 2.
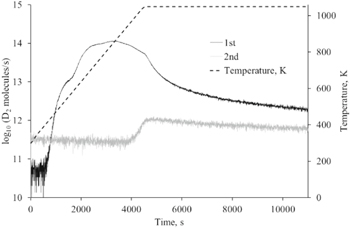
Figure 2. Deuterium release from IWGL ILW3 tile deposition zone.
Download figure:
Standard image High-resolution imageNoticeable D2 release starts mainly above 500 K. Thermal release takes place in several stages, related with different types of traps within the co-deposit layer with binding energy up to 1.3 eV [15]. The main release stages start around 700–760 K which could be related to the time needed for the fuel to diffuse through the deposited layer, as well as being related with the thickness of the deposited layer [16]. There may be repeated de-trapping, mobile diffusion through Be bulk lattice and re-trapping at other trap sites in bulk Be [17] before recombination forming D2 can take place [8]. At higher temperatures, above 850 K, changes in the Be crystal structure and deuterium release from Be grain boundaries can take place [18].
Above 1020 K, increase of mass 9 (Be) occurs. It is possible, that in the vacuum conditions, in temperature range 1020–1070 K changes in beryllium structure together with evaporation of beryllium allows trace deuterium to be released from deeper layers.
Maximal deuterium release rate is reached around 840 K. The D2 release profile from an IWGL tile is in figure 3. Comparing deuterium release from limiter and divertor materials under the same conditions, deuterium release reaches its maximum at higher temperatures for the Be than from carbon based, W coated divertor tiles [19, 20].

Figure 3. Deuterium release from IWGL ILW1 deposition zone.
Download figure:
Standard image High-resolution imageSummarizing results of tiles IWGL and DP, there are differences in the D release between ILW2 and the other two (ILW1 and ILW3) campaigns. Firstly, maximal release rate for IWGL and DP tiles is at higher temperatures in ILW2 in comparison with ILW1 and ILW3: With heating rate 10 K min−1, the maximal D2 release rate is reached at 835 ± 26 K (ILW1), 904 ± 23 K (ILW2) and 810 ± 99 K (ILW3). Comparing maximal release temperatures from erosion and deposition parts of IWGL tile—at deposited zones, maximal release temperature is reached at 10–50 K higher temperatures than in eroded zones. Furthermore, although the HD release follows the shape of the D2 release for all three ILW campaigns, the ratio of the integrated intensities (released molecules, peak area) are different. The intensity ratio for HD and D2 signals for ILW samples from same poloidal positions but different campaigns are summarized in table 1. The ratios show an increase in HD concentration for ILW2 samples in comparison with D2 concentration for ILW1 and ILW3 samples. It can also be seen in figure 4.
Table 1. HD/D2 intensity ratios for similar poloidal positions, ILW1, ILW2 and ILW3.
| Be tile | ILW1 | ILW2 | ILW3 |
|---|---|---|---|
| IWGL deposition area | 0.67 | 2.20 | 0.50 |
| IWGL erosion area | 0.67 | 1.24 | 0.64 |
| DP | 0.70 | 1.68 | 0.43 |
| DP | 0.71 | 1.63 | 0.48 |

Figure 4. D2 and HD release from IWGL deposition zone samples extracted from tile after ILW1, ILW2 and ILW3 campaigns.
Download figure:
Standard image High-resolution image
The difference in D2 release behavior for ILW2 could be related to the use of H2 fuelled pulses at the end of the ILW2 campaign, when the last 300 pulses in the campaign were in hydrogen [21]. During the H2 fuelled phase D would be replaced by H by isotope exchange, especially from the lowest binding energy states or simply by co-deposition or implantation of hydrogen, resulting in both the change in HD/DD ratio and also the net shift to higher release temperatures. Comparing the H2 release patterns above the background, the H2 release for ILW2 samples is higher than from ILW1 and ILW3. All differences could be related to surface temperature, but further investigations are needed.
3.2. Tritium release quantification
Low levels of tritium are released from all JET plasma facing components removed after ILW campaigns.
For tritium release quantification a reference material and another method for tritium quantification was selected. As a reference material for tritium release characterization, Inconel samples from a MkIIA divertor component (present in the JET vacuum vessel during DTE1, 1997) were selected. The total tritium amount was determined by pyrolysis, followed by the liquid scintillation method, and was estimated as 82 ± 16 kBq g−1 (4.6 * 1013 ± 0.9 * 1012 T atoms cm–2). Inconel samples cut from the same parts of the carrier were analysed by TDS and tritium release in DT (mass 5) and T2 (mass 6) was registered. A fraction of tritium is released in the form of DT, whilst the T2 signal is low. Tritium release can also take place in the form of HT (mass 4) or tritium ions T+; however, these signals cannot be separate from the larger signals of D2 and HD at the same masses. The amount of tritium released from the reference Inconel samples is calculated using release of DT molecules. Formation of tritiated water molecules is possible as well. A mass 20 release (HTO) is observed in the TDS spectrum; however, in the case of JET samples, mass 20 could also be from D2O. Concentrations estimated by TDS are lower than pyrolysis results. The TDS results for tritium content in Inconel samples after heating to 1270 K, using the HD calibration factor the DT release is around 17 kBq g−1 (10 * 1012 T atoms cm–2). Therefore not all T is removed at 1270 K after 1 h of annealing. After TDS analysis, samples were pyrolysed and a further 8 kBq g−1 (3 * 1012 T atoms cm–2) were detected. Due to tritium release in different chemical forms, the fraction of T released in the forms DT and T2 can be detected by TDS, but atomic T (mass 3), and tritium released in the form of HTO, DTO, OT and others will have been missed. Judging by the pyrolysis after TDS, heating up to 1270 K releases 90% of the tritium.
TDS can be used for semi-quantitative estimation of tritium content in JET samples. However, for the analysis of tritium release profiles, desorption characteristics of tritium from particular types of samples and possible release together with D, H and O (in form of ions and molecules) need to be taken into account.
The results of analyzing Be samples from ILW campaigns indicate a level ∼104 times lower than that of deuterium. Tritium can be from DD reactions and also due to off-gassing from previous DT operations in JET.
4. Conclusions
For all three campaigns the level of retention correlates spatially with erosion and deposition that takes place during plasma operations. The majority of deuterium is released during heating of beryllium up to 1050 K. ∼1% of deuterium remains bonded. Deuterium release takes place over several stages, with the highest release rate in the temperature range 800–900 K. The typical deuterium retention is 0.01–1 * 1018 atoms cm–2.
With the existing TDS setup the detection of tritium in fusion materials is possible and it is possible to estimate the DT release. The level of tritium in Be (released in form of T and T2) is 104 times lower than deuterium. However, significant fractions of the tritium are missed in the presence of the deuterium. For precise estimation of tritium content in the plasma exposed Be plasma facing components, inter-comparison of results obtained by different techniques is necessary and modelling is planned.
Acknowledgments
The research used UKAEA's Materials Research Facility, which has been funded by and is part of the UK's National Nuclear User Facility and Henry Royce Institute for Advanced Materials.
This work has been carried out within the framework of the EUROfusion Consortium and has received funding from the Euratom research and training programme 2014–2018 and 2019–2020 under grant agreement No 633053. The views and opinions expressed herein do not necessarily reflect those of the European Commission.