


Abstract
The mechanisms by which individuals visually perceive and select others within a group to interact with are of fundamental importance to various collective motion behaviors. However, they remain poorly understood theoretically, partially due to the challenges of modeling neurological perception systems. Here, the classic zoom-lens visual attention model is introduced into collective perception, leading to an attention-based model with only a single parameter. Numerical experiments reveal that the proposed model offers a unified mechanism for collective perception, as reflected in three aspects. First, this model describes both conspecific (e.g. flocking) and heterospecific (e.g. predator-prey) collective behaviors. Second, this model unifies the well-known topological and visibility models in the context of neighbor selection in conspecific groups. Third, in the context of prey selection in heterospecific groups, the model can simultaneously replicate the well-known confusion and oddity effects. These findings demonstrate the fundamental role of visual attention underlying a diverse array of collective motion behaviors.
Export citation and abstract BibTeX RIS

Original content from this work may be used under the terms of the Creative Commons Attribution 4.0 license. Any further distribution of this work must maintain attribution to the author(s) and the title of the work, journal citation and DOI.
1. Introduction
The collective motion of animal groups, such as flocks of birds and schools of fish, arises spontaneously from local interactions among individuals. While a large number of local interaction rules have been proposed [1, 2], a more fundamental problem, how each individual in a group selects neighbors to interact with, still remains largely unsolved. There are three primary models for neighbor selection in the literature [3, 4]. The most classic one is the metric model, in which two individuals interact with each other if their distance is less than a threshold [5]. In recent years, the topological model [6–8] and the visibility model [3, 9–12] have received increasing research attention, especially for animal groups that use vision as the primary sensing modality.
The topological model suggests that each individual pays attention only to a fixed number of nearest neighbors [6]. The value of this fixed number is independent of group size or sparsity, which is a locally scale-free behavior. Although such behavior is supported by many empirical studies [7, 13], the topological model, defined based on the ranking of inter-individual distances, does not take into acount the sensory constraints of vision. Another relevant model is the Voronoi one, which not only generates a similar locally scale-free neighbor selection behavior as the topological model but also approximates more closely data from empirical studies [3]. By contrast, the visibility model suggests that each individual selects neighbors from those that are visible. The effective visual range is bounded by a visual angle threshold that corresponds to the minimal area subtended on the retina [3]. Empirical studies reveal that the visibility model is also locally scale-free [7] in the sense that an individual is inhibited from responding to a visible neighbor that has a relatively low rank in terms of visual angle. Although the visibility model fully incorporates the constraints of visual sensing, the fundamental perception mechanisms leading to scale-free behaviors are still poorly understood.
In addition to neighbor selection in flocking groups, selecting individuals of interest is also an important problem among competitive groups of predators and prey. In particular, social animals tend to form groups to defend against predators [14, 15]. A significant benefit of such groups is the confusion effect: multiple individuals with similar appearances grouping together can confuse the perception of predators, thereby reducing predation risk [14, 16]. On the other hand, if an individual is different from others in a group in terms of either appearance or location, the probability of such an 'odd' individual being preyed upon will greatly increase [14, 16]. This phenomenon is known as the oddity effect. Both confusion and oddity effects, the two sides of the same coin, have been observed in many empirical studies across taxa [16–18]. The confusion and oddity effects have been replicated by models realized by artificial neural networks [19, 20], which provides computational evidence in support of these effects.
The process of selecting individuals of interest in groups, either neighbors to interact with or prey to pursue, is fundamentally constrained by the limited visual perception resources of organisms [19, 21]. Visual perception is a complex process that enables an individual to perceive their visual stimuli to understand their surroundings [22, 23]. This process involves many factors, including learning, memory, expectation, and attention [24]. Among these factors, visual attention is a key process that selectively concentrates on some visual information while discarding the rest [25, 26]. The attention mechanism filters out many signals received by sensory organs to select a small amount of relevant information for further processing, an evolutionary result of the limited information processing capabilities of organisms [27].
It is interesting to note that the nature of visual attention is analogous to the nature of individual selection in groups: that is, a focal individual selectively concentrates on some individuals of interest within a group while ignoring the rest. Therefore, visual attention may provide a useful framework to study collective perception. However, it is nontrivial to incorporate visual attention into collective perception models because neurological perception is challenging to model theoretically [16–18, 25]. There are two classic and simple theoretical models describing the spatial distribution of visual attention: the spotlight model and the zoom-lens model [28]. In both models, the focus of attention is likened to the beam of a spotlight with variable sizes, wherein the visual information inside the beam is processed and the information outside is discarded.
Here, we propose a novel attention-based model of collective perception to address the problem of selecting individuals of interest given limited visual attention. This model is obtained by incorporating the classic zoom-lens model into the visibility model of collective perception. The resulting model is simple, with only a single parameter. It is interesting that, although the zoom-lens attention model is not specifically designed for collective visual perception like [19, 20], the resulting attention-based model can replicate many key collective behaviors. First, this model captures the locally scale-free property observed in flocking groups that each individual selects only a bounded number of neighbors regardless of group size or sparsity. This scale-free behavior is spontaneously generated from the low-level visual attention mechanisms we propose, without being explicitly encoded in the model. Second, the attention-based model can be seamlessly applied to prey selection in the predator-prey context, in which we show that the model can simultaneously reproduce both the confusion and oddity effects.
2. Results
2.1. An attention-based model for collective perception
The zoom-lens model describes visual attention as a combination of a focus and a fringe [28]. In a group of individuals represented by unit spheres, the focus of a focal individual directed towards another one corresponds to the visually sensed angular area, whereas the fringe corresponds to an obscure area surrounding the focus. See figure 1(a) and supplementary figure 1 for two-dimensional (2D) and three-dimensional (3D) illustrations. While the zoom-lens model is valid in both 2D and 3D, the present work considers the simple 2D case, where the focus and fringe correspond to the sensed and perceived angles, respectively (figure 1(a)). Each individual is supposed to have an omnidirectional field of view.

Figure 1. The zoom-lens model of visual attention in the context of collective perception. (a) The zoom-lens model describes visual attention as a focus and a fringe: The focus on the orange individual corresponds to the visually sensed angle of its body size; The fringe is an obscured area surrounding the focus. The angle that corresponds to the fringe is the perceived angle. Since AR = 3 in this example, the perceived angle is three times the sensed angle. (b) The iterative procedure for selecting neighbors in the case of AR = 3: (i) Select the nearest visible individual as the first neighbor. (ii) From among those not obscured by the fringe of the first neighbor, select the next nearest visible individual as the second neighbor. (iii)–(viii) Repeat this process until no more neighbors can be selected. (c) Neighbor selection in the case of AR = 1. In this case, the focal individual selects all individuals that are fully visible.
Download figure:
Standard image High-resolution imageVisual information inside the focus is extracted with high resolution, whereas information inside the fringe is given much less weight [28]. For instance, if individual B is obscured by the fringe of individual A, then individual B would be ignored by the focal one. Thus, when facing multiple visible individuals, the focal one selects neighbors in the following way. First, the focal individual selects the nearest visible one as its first neighbor (that is, the individual with the largest visually sensed angular area). The second neighbor is selected as the nearest visible individual from among those that are not (fully or partially) obscured by the fringe of the existing neighbor. This procedure is executed iteratively until no more neighbors can be selected, as illustrated in figure 1(b). Although an individual may only be able to focus on one single neighbor at a moment, it can track multiple ones by storing them in working memory and serial processing within a short duration [13, 26].
The above procedure leads to a new attention-based model for collective perception. This model has only a single parameter: attention ratio (AR), which is defined as the ratio between the perceived angle and the sensed angle (figure 1(a)). When AR = 1, the perceived angle of an individual is the same as its sensed angle. In this case, the attention-based model degenerates to the classic visibility model. In this work, we are interested in the general case of AR  1. In the following, the attention-based model is applied to the problems of neighbor selection in flocking groups and prey selection in predator-prey tasks.
2.2. Neighbor selection in flocking groups
When applied in neighbor selection in flocking groups, the attention-based model can exhibit two types of behaviors, scale-dependent and scale-free. Here, the term scale refers to the group sparsity (SP) and group size (GS), which are defined as the average of the nearest neighbor distances of all individuals and the total number of individuals in the group, respectively.
2.2.1. Scale-dependent behavior
The scale-dependent behavior emerges when all individuals adopt the same fixed value of AR to perceive their neighbors. In this case, the average number of neighbors (NN) increases as SP or GS increases, as shown in figure 2(a) and supplementary figure 2. Such a behavior is not surprising because an individual can visually see and hence select more neighbors when the group is sparser or the group size is larger.
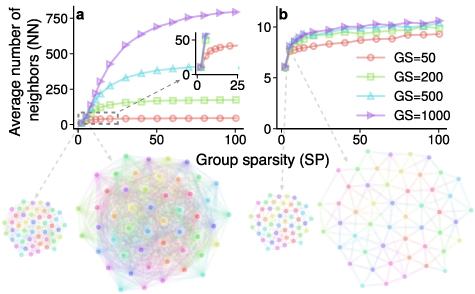
Figure 2. Scale-dependent vs scale-free behaviors in neighbor selection. (a) When all individuals adopt AR = 1 to perceive their neighbors, the number of neighbors (NN) increases as group sparsity (SP) and group size (GS) increase. The reason that NN gets saturated as SP increases is due to bounded group sizes. At sufficiently large group sizes, this saturation disappears and NN is proportional to the squared SP. In particular, it can be quantified that  , where
  (see supplementary figure 5 for details). (b) When each individual adopts adaptive ARs, the number of neighbors always remains in the narrow interval between 6 and 12 as group sparsity or group size varies. More results are given in supplementary figure 6.
Download figure:
Standard image High-resolution image2.2.2. Scale-free behavior
The attention-based model can generate another interesting scale-free behavior, which is the primary interest of our work. Such a behavior emerges spontaneously when the attention ratio of an individual given to each neighbor is adaptive to the sparsity, rather than fixed. More specifically, let SPi
denote the distance from an individual to its ith neighbor, and ARi
the attention ratio dedicated to that neighbor. Then, the attention ratio being adaptive to the sparsity refers to the condition of  .
.
In this case, we find that the number of neighbors becomes independent of group sparsity and group size, which we refer to as the scale-free behavior. In particular, as shown in figure 2(b) and supplementary figure 4, although NN increases slowly as SP or GS increases, it always remains in the narrow interval between six and twelve. As a result, the dependence of NN on SP or GS is much weaker than in the scale-dependent case (figure 2(a)). The scale-free behavior is also consistent with the cognitive ability of biological systems: Although a large amount of visual information (e.g. visible members) can be seen, only a small amount (e.g. selected neighbors) can be processed by biological cognitive systems.
This scale-free behavior is valid not only in static geometric analysis but also in dynamic flocking processes as shown in figure 3. The flocking dynamic model is given in Methods. Starting from a configuration with high sparsity, the group would eventually flock with a lower density because the flocking model would maintain a small inter-individual distance. Starting from the same initial group configuration, the scale-dependent and scale-free perception models lead to very different behaviors of neighbor selection. Specifically, in the scale-dependent case, NN decreases significantly as SP decreases. However, in the scale-free case, NN remains almost unchanged even though SP decreases significantly.
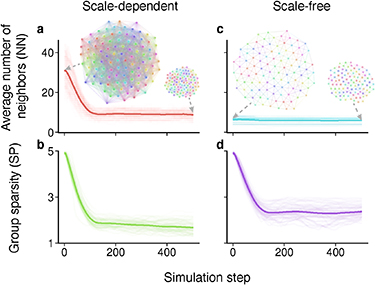
Figure 3. Scale-dependent vs scale-free behaviors in dynamic flocking processes. In the two examples, the simulated flock of 100 individuals starts from the same initial configuration (i.e. the two networks with high sparsity) and converges to flocks with lower sparsity (i.e. the two networks with low sparsity). (a), (b) In the scale-dependent case, the average number of neighbors decreases significantly as the group sparsity decreases. (c), (d) In the scale-free case, the average number of neighbors remains almost unchanged even though the group sparsity decreases. Details of the dynamic flocking model are given in Methods.
Download figure:
Standard image High-resolution imageThe scale-free behavior generated by the attention-based model is consistent with the classic topological model and may offer insights into the question of why starlings appear to select the mysterious number of seven neighbors on average [6]. Specifically, although the level of group sparsity considered in our numerical analyses may be as high as 100, it is usually not so high in natural animal groups such as flocks of birds or schools of fish maintaining collective cohesion. For instance, the sparsity of the sparsest flock reported in [6] is 1.51 m, which is merely four times the wingspan of starlings (about 0.4 m) [29]. Thus, if we consider the group sparsity less than 10 times body size, the average number of nearest neighbors is around six to eight (figure 2(b)), which is surprisingly consistent with the number of seven identified in [6].
Fundamentally, the scale-free behavior results from the fact that the perceived angle of each neighbor is always fixed, regardless of sparsity. In particular, since each individual is of unit size, the visually sensed angle of the ith neighbor is approximately  rad and consequently the perceived angle is
  rad. When
  , the perceived angle is constant and equal to 1 rad or approximately 60 deg. The perceived angle can be interpreted as the amount of attention dedicated to a neighbor. Therefore, an individual treats their selected neighbors equally by assigning equal attention to each selected neighbor in the scale-free case. As a comparison, in the scale-dependent case, each individual treats their selected neighbors differently by giving more attention to near selected neighbors and less to farther ones.
Why does NN vary only within the narrow interval between six and twelve, as shown in figure 2(b)? The theoretical explanation is as follows. Note that we assume the field of view for each individual is 360 deg. Since each neighbor is given a perceived angle of 60 deg, each individual can have at least  neighbors whose perceived angles do not overlap. Moreover, the perceived angles of different neighbors can overlap up to 50% without blocking each other, resulting in up to
  neighbors.
2.3. Prey selection in predator-prey tasks
In addition to neighbor selection in flocking groups, the scale-free attention-based model can be seamlessly applied to the problem of prey selection. In this context, the predator could select targets from the prey group following exactly the same procedure as in neighbor selection.
To study prey selection, we introduce two useful notions. The first notion, handling time, refers to the period of time for a predator to observe the prey group before attacking a specific target prey [30]. The second notion, lock-on rate, is defined as the ratio between the longest time a predator continuously locks on to a prey target and the handling time (Methods). A higher lock-on rate indicates that the predator can continuously lock on to some prey targets for a larger portion of the handling time.
When there is no perception noise, a predator can accurately sense the angle of each prey individual, resulting in a lock-on rate always equal to one (supplementary figure 6). It suggests that the predator can continuously lock on to at least one individual during the entire handling time. However, with perception noise (Methods), the lock-on rate drops, and consequently the confusion and oddity effects emerge, as described in the following.
2.3.1. Confusion effect
The scale-free attention-based model can replicate the confusion effect. In particular, the lock-on rate decreases as group size increases or sparsity decreases (figure 4(a)), suggesting that larger and denser groups would lead to lower predation risk. This result is consistent with biological evidence that animals such as fish and birds tend to form large, tight groups for predator defense [14].
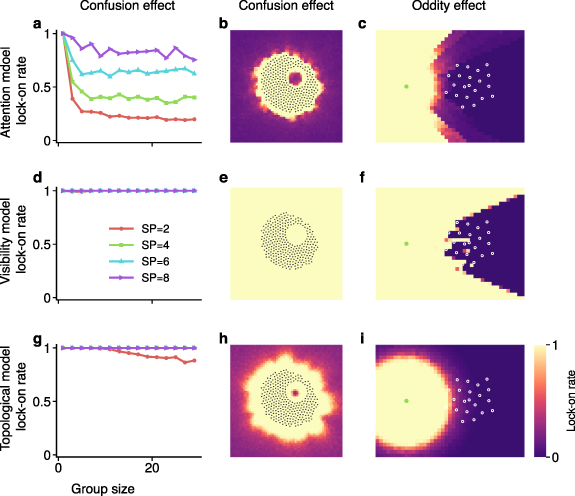
Figure 4. Confusion and oddity effects generated by the three models. (a) With the scale-free attention-based model, the lock-on rate decreases as the group size increases or sparsity decreases. Here, the group is generated randomly inside a circle with desired sparsity. Every data point is an average of over 10 samples. The distance to the group boundary is set to be 10. (b) Confusion effect generated by the scale-free attention-based model. The color of each pixel represents the lock-on rate of the predator located at that specific pixel. As can be seen, the lock-on rate decreases as the predator moves farther away from the group, and a strong confusion effect emerges when the predator is surrounded on all sides by prey. The color value at each pixel is averaged over 10 random samples. (c) Oddity effect generated by the scale-free attention-based model. The color of each pixel represents the lock-on rate of an odd individual located at that specific pixel. The green dot represents the location of the predator. As can be seen, when the odd individual moves away from the group in terms of either view angle or distance, the lock-on rate increases. The color value of each pixel is averaged over 10 random samples. (d)–(f) The visibility model is not able to generate the confusion effect but can replicate the oddity effect to some extent. (g)–(i) The topological model can reproduce the confusion effect to an extent but is not able to generate the oddity effect. The perception noise level is 20% in the results above. The impact of different levels of perception noise can be found in supplementary figure 6.
Download figure:
Standard image High-resolution imageBy comparison, the classic visibility model is not able to generate the confusion effect. Specifically, the lock-on rate is always equal to one (figure 4(d)), indicating that the predator could always continuously lock on to at least one prey individual regardless of group size or sparsity. Interestingly, the topological model is able to replicate the confusion effect to a certain extent (figure 4(g)), a property of this model that has not been reported.
In addition to group size and sparsity, the confusion effect is also affected by other parameters such as predator-prey distance and group shape. For instance, the lock-on rate drops quickly as the predator moves farther from the group (figure 4(b) and supplementary figure 7). Regarding the group shape, it is interesting to note that animal groups such as schools of fish or herds of sheep tend to surround predators in the center [31]. Our results suggest that such surrounding shapes can provide the benefit of increasing confusion effects. Specifically, as shown in figure 4(b), when a predator is surrounded on all sides by the prey group, the lock-on rate is lower than at other locations with the same predator-prey distance. This occurs because the prey individuals surrounding the predator are all nearly the same distance away. In this case, the perception noise, even at small magnitudes, can cause frequent switching among prey targets, hence lowering the lock-on rate. Finally, the confusion effect is likely to be affected by the values of parameters such as the noise level or handling time (which may vary depending on species and habitat). However, in our model, adjusting these parameters leads to the same qualitative results (supplementary figure 7).
2.3.2. Oddity effect
Along with the confusion effect, the scale-free attention-based model can also successfully replicate the oddity effect. Specifically, if an odd individual is located far away from the group or its viewing angle from the predator diverges from the group, the lock-on rate of that odd individual increases significantly (figure 4(c)).
Interestingly, although the visibility model could not replicate the confusion effect, it is able to generate the oddity effect (figure 4(f)), which however is almost binary with no smooth transition because this result is purely based on direction information. By contrast, the topological model, which could generate the confusion effect, is not able to replicate the oddity effect. As shown in figure 4(i), the area of high lock-on rate for the odd individual is a sphere centered on the predator. This area is omnidirectional because the topological model relies purely on distance information, without incorporating visual sensing.
These results on the confusion and oddity effects further suggest that the classic visibility and topological models are complementary, and that the scale-free attention-based model combines well the merits of both models while avoiding their shortcomings.
2.3.3. Group perception from a distant location
In addition to individual selection, we found that the scale-free attention-based model may also provide insights into group perception. In particular, when an individual approaches a group of prey or conspecifics from a distance, how many members within the group would the individual focus on? This question is important for understanding both shoal/school choice and predator-prey behaviors [32].
The scale-free attention-based model suggests an interesting and biologically plausible means of group perception: When an individual is located sufficiently far away, it would not distinguish the individuals within the group, simply treating the group as a whole by focusing on a single representative (figure 5(b)); as the individual moves closer to the group, more and more group members would be focused on (figure 5(b)). We predict that the threshold of the distance to the group center beyond which the group is perceived as a whole is 2r, where r is the radius of the circle enclosing the group (figure 5(b), supplementary figure 8). It is notable that this distance threshold is valid when the group has a circular shape. Many groups such as fish schools and bird flocks may have non-circular shapes such as elongated shapes. For these cases, the distance threshold would be variant to the observation angle as demonstrated in supplementary figure 8c. It is worth mentioning that the number of focused individuals in the group increases discretely as the focal one approaches the group. Such a discrete increase may cause abrupt decision-making of the focal individual. For example, bifurcation decision-making phenomenons are observed when an individual approaches spatially distributed options [33]. The attention-based model presented here may shed light on the explanation of the phenomena.

Figure 5. Group perception from a distance. A group of individuals is located around the center, while a focal individual perceives the group from different locations. The color of each pixel represents the number of group members perceived by a focal individual at that location. (a) With the classic visibility-based model, when the focal individual is located far from the group, many individuals are visible and hence focused on. (b) With the scale-free attention-based model, when an individual is sufficiently distant from a group, it only selects a single individual in the group and thus treats the entire group as a whole. As the focal individual moves closer, more individuals in the group will be selected. The dashed circle's radius is twice that of the circle tightly enclosing the group. As can be seen, the dashed circle fits the area with NN  1 well, suggesting that it predicts well the distance threshold beyond which the group is perceived as a whole.
Download figure:
Standard image High-resolution image
As a comparison, the classic visibility model [3] suggests that the individual would focus on all visible members in the group, regardless of the distance to the group. As shown in figure 5(a), the farther the distant individual is from the group, the more members can be visually seen and hence focused on. This is, however, biologically implausible because the distant individual may select too many members in the group, such as hundreds or thousands, to focus on given limited biological perception resources.
3. Discussion
The attention-based model proposed in this work can successfully replicate many collective behaviors observed in empirical studies across different domains that may seem unrelated at first glance, ranging from neighbor selection to prey selection, and from the confusion effect to the oddity effect. Our model incorporates insights from both the topological model and the visibility model, while reconciling differences between the two that have remained controversial. For example, although the topological and visibility models have both been supported by empirical studies, they differ in terms of sensory mechanisms: the topological model relies on metric distance ranking, whereas the visibility model relies on visual sensing. The attention-based model we propose successfully resolves these controversies, revealing that visual attention is a hidden common foundation of these problems. We believe this model offers a simple yet powerful framework to predict or explain more complex behaviors related to collective perception.
The proposed attention-based model is simple in the sense that it has only one parameter, the attention ratio, or AR in short. In the adaptive case, we consider the simplest case of  , so that the perceived angle dedicated to each neighbor is fixed as approximately 60 deg. More complicated cases such as
  , where
  is a linear or nonlinear function, can be considered in order to generate more sophisticated collective behaviors. Nevertheless, we believe the simplest case of
  already generates the most important qualitative features.
In the context of neighbor selection in flocking groups, the attention-based model replicates the important scale-free property that each individual spontaneously selects a limited number of neighbors. It is intriguing that the number of neighbors suggested by this model is consistent with the value suggested by empirical studies [6]. Interestingly, we notice that determining NN in the scale-free case is related to the sphere packing theory [34, 35]. In particular, if the perceived angles of different neighbors do not overlap, the maximum value of NN is equal to the kissing number, which is the maximum number of unit spheres that can touch a common unit sphere. The kissing number is equal to six in two dimensions, which is consistent with our analysis [34, 35].
The specific values for the average number of neighbors generated by the model are also affected by many other factors, such as the dimension of the space, the field of view of each individual, and the spatial configuration of group members. In particular, the numerical results in this work are for the 2D case where each individual is modeled as a unit circle. The attention-based model could also be applied to the 3D case, with each individual modeled as a unit sphere. While the field of view considered in our work was omnidirectional, the number of neighbors would be smaller when each individual has a limited field of view. Moreover, if the attention ratio in the adaptive case is generalized as a more complicated function  rather than
  , the perceived angle of each neighbor may be greater or less than 60 deg. All of these could be treated as control factors to tune the resulting average number of neighbors.
When applied to the prey selection problem in predator-prey interactions, the scale-free attention-based model reveals the advantages and disadvantages of the classic topological and visibility models. As a natural unification of these two models, the attention-based model is able to simultaneously replicate both the confusion and oddity effects. It is worth mentioning that the confusion and oddity effects are quantified in the current work using a metric we define as the lock-on ratio. This ratio is mainly determined by the static spatial configuration of the entire group. It is notable that the confusion effect and neighbor selection may also be influenced by the relative velocity of group members [3, 36, 37]. Our model, which relies merely on the relative position of group members, reveals the critical role of spatial geometry in the perception of collective behaviors.
4. Methods
4.1. Numerical data generation
The method used to identify the dependence of NN on SP and GS in the scale-dependent and scale-free cases is described as follows. Consider a group of individuals, each of which is a unit circle, evenly distributed as a triangular tiling in the plane (see supplementary figures 2-3 for illustration). The distance between each pair of nearest individuals is set as the desired value of group sparsity. The position of each individual is perturbed by noise sampled from a 2D normal distribution with different sigma values. Here, sigma is equal to the product of SP and different noise levels, of 0.02, 0.05, and 0.1. We recorded the value of NN for the focal individual located at the center of the group (see supplementary figures 2-3 for illustration).
4.2. Flocking dynamic model
The flocking model used to generate figure 3 is described as follows. Let  be the position and velocity of the ith individual, respectively. Suppose
  is the set of neighbors of agent i at each moment and
  be the cardinality of
  . The dynamics of each individual are governed by

where  represent the Euclidean norm of a vector. The first term on the right-hand side,
  , is a Newtonian-type repulsion force. The second term
  , where
  , is an attraction force. The third term
  is for velocity alignment. The angle of the velocity given by (1) is further perturbed by a noise drawn from a normal distribution with zero mean and 3 deg standard deviation in our simulation. This model is adapted from [31] by adding the velocity alignment term. In addition to the above model, we also examined other flocking models such as Couzin's model [38], and verified that the resulting behaviors were consistent under different flocking models.
4.3. Lock-on rate and perception noise
The definition of the lock-on rate is as follows. Let T denote the handling time, which is set to be 20 timesteps in our numerical simulation such that the predator perceives the group 20 times. Different values of T were also tested (supplementary figure 7) and found to have little impact on the final results. Suppose ST
is the set of indices of all the individuals that the predator selects at least once during T, and  is the maximum value of the durations of continuous selection for these individuals during T. The lock-on rate is defined as
  .
.
Perception noise was implemented in the three models as follows. The three models rely on different measurements: the topological model relies on relative distances, whereas the visibility and attention models rely on sensed angles. The angle and distance measurements are equivalent because  where a and d denote the sensed angle and sensed distance of a neighbor. In order to handle the three models in a unified way, let m represent the measurement which could be either a or d. The noisy perception of m is
 ![$\hat{m} = m[1+2\times NL\times (s-0.5)]$](https://content.cld.iop.org/journals/1367-2630/26/1/012001/revision2/njpad1b81ieqn29.gif) where
where  is the noise level and s is a random sample drawn from a uniform distribution in
 ![$[0,1]$](https://content.cld.iop.org/journals/1367-2630/26/1/012001/revision2/njpad1b81ieqn31.gif) . Hence,
. Hence,  distributes uniformly between
  and
and  . This procedure for adding noise is inspired by Weber's law and ensures that the noise magnitude is proportional to the true value of the sensed quantity.
Acknowledgments
This work was supported in part by the Hangzhou Key Technology Research and Development Program (Grant No. 20212013B09) and the STI 2030-Major Projects (Grant No. 2022ZD0208804). L L acknowledges funding support from the Max Planck Society, the Deutsche Forschungsgemeinschaft (DFG, German Research Foundation) under Germany's Excellence Strategy-EXC 2117C422037984, the Sino-German Centre in Beijing for generous funding of the Sino-German mobility Grant M-0541, and Messmer Foundation Research Award. The authors would also like to thank the anonymous reviewers for their valuable insights and feedback.
Data availability statement
All data that support the findings of this study are included within the article (and any supplementary files).