


Abstract
Second harmonic generation efficiency (SHGE) strongly depends on the length of the interaction material along the beam propagation axis. Since a nanoscale interaction length is considered too short even in the optical wavelength scale, the attained SHGE through nanomaterials is usually too low to be of practical use. In this study, it will be shown that by properly adjusting the conduction-band electron density in a semiconductor nanomaterial under a certain optical pumping rate (active tuning), the SHGE can be effectively tuned from being super-low to being ultra-high. Such sharp tunability is only valid for small-scale materials as their density of conduction-band electrons can be rapidly switched between high and low under moderate optical pumping. Using an experimentally verified computational model, we have observed that at a given frequency, for a certain range of conduction-band electron densities, the SHGE can reach up to 1080% for Ga-As and 230% for silicon nanomaterials under active tuning, with respect to the intensity of the first harmonic of the input signal. Such SHGEs are unprecedented, which is very promising for generating higher harmonics via cascaded second harmonic generation performed via adaptive tuning of the conduction band electron density at each stage.
Export citation and abstract BibTeX RIS

Original content from this work may be used under the terms of the Creative Commons Attribution 4.0 licence. Any further distribution of this work must maintain attribution to the author(s) and the title of the work, journal citation and DOI.
1. Introduction
Second harmonic generation (SHG) is one of the most fundamental phenomena in nonlinear optics. It is commonly used to generate visible light from a near-infrared light source, ultraviolet light from a visible light source, and to generate higher harmonics via cascaded operation. It is also important for its influence in other nonlinear optical processes such as sum-frequency generation and optical parametric amplification. Often, the achieved conversion efficiency is low (less than 10%) due several reasons including the limited intensity of the optical beam, limited interaction medium length, or because of the weak electrical nonlinearity of the interaction material [1–17]. The second harmonic generation efficiency (SHGE) heavily depends on the nonlinearity coefficient of the material. Some materials exhibit a strong nonlinear response (with a nonlinearity coefficient that is greater than 10−21 C V−2) under optical excitation, but most materials display weak nonlinear behaviour (with a nonlinearity coefficient that is less than 10−22 C V−2). Hence, attaining a high SHGE is often difficult unless the electric field intensity is super-strong (greater than 1013 W m−2) and/or the interaction medium length is sufficiently high (at least a few millimeters long). To tackle this problem, designing highly nonlinear (with a nonlinearity coefficient that is greater than 10−20 C V−2) artificial materials has been a major subject of focus [14–28], which can enable the attainment of a high SHGE at relatively low optical intensities in the small-scale (micro and nanoscale). Huge improvements in SHGE have been attained via structural and intrinsic modification of certain materials (such as silicon, GaAs, and lithium-niobate) [3–8, 11–18, 20–22, 33–35]. Although in the nanoscale, SHGE remains quite weak (less than 1%), and its improvement has recently been a subject of great interest [1, 3–21]. Overwhelming majority of the existing research on small-scale SHGE improvement is based on passive improvement, which is without the involvement of any additional optical excitation (pumping) but rather based on material alteration and/or using artificial materials. In comparison, SHGE improvement via active tuning has been rarely investigated, and to our knowledge, has not been investigated for nano-semiconductors which could have offered unprecedented tunability. We believe active improvement of SHGE via optical pumping has two important advantages over passive improvement. The first is the elimination of the production and process requirement. The second and the most important advantage is the adaptability of active SHGE tuning. Passive tuning is achieved by sweeping the excitation frequency based on the spectral locations of the resonance frequencies, therefore its efficiency is restricted by the dispersion properties of the interaction material. On the other hand, active tuning allows for much more control on SHGE as it depends on the optical pumping rate which can be configured by the investigator. In this study, we are going to show that active tuning via optical pumping can have a much stronger effect on SHGE compared to passive tuning for semiconductor nanomaterials when the conduction band electron density takes on certain values. Therefore, rather than tuning the excitation frequency, we will focus on tuning the conduction band electron density in a nano-semiconductor for boosting the SHGE (figure 1).

Figure 1. SHG via a nonlinear crystal.
Download figure:
Standard image High-resolution imageThe SHGE strongly depends on the length of the interaction material. Therefore, in materials where the thickness along the wave propagation axis is in the nanoscale, the SHGE is extremely low, even when the incident electric field is strong or the nonlinearity of the crystal is extraordinarily high [1–35]. Hence, SHG via a material with a nanoscale longitudinal thickness is not so feasible, and high SHGE only starts to be observed in the millimeter scale under high optical intensities (figures 2 and 3). Equation (1) states the empirical SHGE in terms of the wave and material parameters [29]

ρ = nonlinearity coefficient of the medium (C V−2), η = material impedance, n= refractive index, A = wave amplitude (V m−1), L = material length, ω = angular frequency, c: speed of light in vacuum.

Figure 2. SHGE versus electric field amplitude under low (left) and high (right) crystal nonlinearities for an interaction medium length of 1 mm.
Download figure:
Standard image High-resolution image
Figure 3. SHGE versus electric field amplitude under low (left) and high (right) crystal nonlinearities for an interaction medium length of 300 nm.
Download figure:
Standard image High-resolution imageAs evident from equation (1), the SHGE depends on the nonlinearity of the interaction material, the frequency and amplitude of the optical wave, and the length of the interaction material. To compensate for the ultra-short interaction length, we will focus on tuning the SHGE by tuning the nonlinearity coefficient of the interaction material (ρ) via sweeping the free (conduction-band) electron density. The conduction-band electron density of a semiconductor can be swept via sweeping the optical pumping rate, through which we will investigate the variation of the SHGE within a wide range of conduction-band electron densities. This will be carried out via a numerical solution of the wave equation and the associated Lorentz dispersion equation for each resonance frequency of a material. We will then use Fourier transformation to observe the SHGE via computing the spectral intensities of the first and second harmonics.
2. Methods
2.1. Computational wave dynamics
We will initially investigate the problem for the most general case which deals with an interaction material with multiple resonance frequencies. The first part of the problem involves the modeling of the wave dynamics. Consider a high-amplitude electric field that is propagating through a material with M resonance frequencies ω = {ω1, ω2, ..., ωM }, and M corresponding polarization decay rates γ = {γ1, γ2, ..., γM }. The total polarization density that is induced by the electric field can be expressed as the sum of the individual polarization densities that are induced via each resonance, through the wave equation and the Lorentz dispersion equations


E: electric field, μ0: free space permeability, ε∞: background permittivity, t: time, σ: conductivity, P: polarization density, γ: polarization damping rate, ΔT: simulation duration, ω: angular resonance frequency, N: electron density, e: elementary charge, d: atom diameter, me: electron mass, ξm : oscillation strength for the mth resonance.
After solving for the electric field through equations (2)–(4), the SHGE can be evaluated from the intensity ratio of the second and the first harmonic

The value that is obtained by solving equation (5), can be compared with the empirical finding in equation (1) for verifying the accuracy of the computation.
Equations (2)–(4) can be solved through the use of the finite difference time domain method, based on which the discretization is given as follows


Here one should pay attention when choosing the spatial and temporal sampling rates (Δx−1, Δt−1), as they should be chosen according to the Courant stability condition to prevent numerical instabilities [31].
2.2. Computational electron dynamics
Since we are interested in the active tuning of the SHGE, the electron density for each transition (resonance) should be adjusted for SHGE maximization. The electron density for each transition can be set or swept to investigate the SHGE directly using equations (2)–(5). But in order to find the required optical pumping rate for each transition, the corresponding injection-rate equations must be solved. Considering an interaction medium with M resonances, and assuming that the electronic transition rates are much lower than the non-radiative decay rates, the mathematical description for the electron dynamics can be stated by the following coupled differential equations


N0: density of electrons at the ground level, NM : electron density for the Mth resonance, Γ: optical pumping rate for the Mth resonance, τM : electron lifetime for the Mth resonance.
Equation (9) describes the rate of change in the electron density of the ground state under optical pumping for M different transitions (each with a rate of Γi ), and the corresponding electron lifetimes τi for each transition which indicate the rate that the excited electrons are recombined to the ground state. In equations (9)–(12), electrons are pumped from the ground level to the upper levels at different rates (the first term in each equation indicates the pumping), from where they fall/recombine to lower levels/transitions, increasing the electron population in lower levels. As an example, the first term in equation (10) represents the rate of injection for the first transition, the second term indicates the rate of electron flow (recombination) to the first electronic-transition from all the upper transitions, and the last term signifies the rate of recombination from the first electronic-transition to the ground-level (hence the minus sign, which indicates the decrease of electron population in level 1). In this study, it is assumed that the electron excitation/recombination follows the same pattern for all the other transitions (i = 2, 3, ..., M − 2). It should be noted that the SHGE is computed at the steady state, that is when the electron density associated with each transition (resonance) stabilizes around a certain value in time.
2.3. Evaluating the SHGE for materials with a single resonance frequency and the active tuning process
For materials that have only a single resonance frequency, the previously described set of equations (equations (2)–(4) and (9)–(12)) simplify to the following set of coupled equations


τe: electron lifetime, Γ: optical pumping rate, A: non-radiative recombination constant, B: radiative recombination constant, C: Auger recombination constant.
In this case, the following discretized equations are implemented to solve for the required optical pumping rate that corresponds to the optimum transition electron density N, which maximizes the SHGE via equations (5) and (13)–(15)


Once the optimal transition electron density N that maximizes the magnitude of the electric field E is found, the corresponding optical pumping rate can be evaluated based on the discretization of equation (15) as

x: spatial coordinate, t: time,  .
.
The single-resonance modeling is a valid approximation in many cases, as many well-investigated materials have a single dominant resonance. In this case, it is much easier to control the sweeping of the associated electron density through the tuning of the pumping rate Γ. Such active tuning of the transition electron density leads to a huge variation in the ratio of the intensities of the first and the second harmonics. This variation will be investigated in the next section.
Figure 4 illustrates the practical mechanism for sweeping the transition electron density through the tuning of the optical pumping rate for the investigation of the variation of SHGE. The basic setup involves an optical pump source, which provides the pump beam that is used for tuning the transition electron density, a beam-splitter for combining the input beam with the pump beam, a lens for focusing the combined-beam onto the semiconductor surface, and an isolator for directing the combined-beam pathway towards the semiconductor surface with the help of a mirror. In this study, it is assumed that all the pump-light is absorbed by the semiconductor. Although the suggested setup is simple, one complicacy that might arise in practice is the overheating of the semiconductor due to the high pump intensity (∼1013 W m−2), which can lead to the generation of thermal-noise in the output signal, and also the modification of the electrical properties of the semiconductor that may lead to deviations from the expected SHGE. Such a high-intensity can also lead to thermal damage for relatively long optical pulses. However, since the pulse lengths are chosen to be on the order of a few picoseconds in our computations, and since most semiconductors incur thermal damage for optical intensities above ∼1015 W m−2, we believe that thermal damage is unlikely for the given parameters in this study.

Figure 4. Mechanism for tuning the transition electron density through the adjustment of the pump-intensity.
Download figure:
Standard image High-resolution image3. Results
3.1. Tuning the SHGE through an arbitrary multi-resonant media
Using numerical simulations, we have initially investigated the variation of the SHGE via tuning the electron density for a multi-resonant media of three resonances, with spectral locations f = {400 THz, 700 THz, 1200 THz}. The corresponding polarization damping rates for each resonance are given as γ = {109 Hz, 4 × 10⁹ Hz, 1.2 × 10¹⁰ Hz}. In this section, we will only deal with the sweeping of the total transition electron density N, and not the optical pumping rate. The wave and the material parameters of the simulation are set as follows


Based on the solution of Equations (2)–(4), the corresponding induced electric energy density is computed as

Using equations (2)–(4), the electron density is tuned from 5 × 1026 m−3 to 1029 m−3 in increments of 5 × 1026 m−3. The resulting variation of the SHGE is shown in figure 5. The SHGE reaches to a maximum value of 0.27 for an electron density of 4.2 × 1028 m−3, which is 107 times higher than for mediums with low nonlinearity, and 105 times higher than for mediums with high nonlinearity, considering a 300 nm-long interaction medium based on figures 2 and 3. This finding emphasizes the importance of active tuning for increasing the SHGE. At the optimal electron density where peak SHGE occurs, the material exhibits an ultra-nonlinear electrical response, such that the generated second harmonic intensity is comparable with that of the first harmonic. At the nanoscale, such a high SHGE cannot be attained using any well-known nonlinear optical crystal with passive tuning as illustrated by figures 2 and 3.
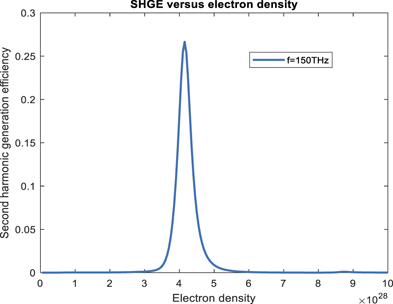
Figure 5. SHGE versus total transition electron density for the given multi-resonant medium with three resonances.
Download figure:
Standard image High-resolution imageThe reason behind the attainment of such high nanoscale SHGE can be uncovered by investigating the intra-material electric energy density and the polarization density. Figure 6 shows that, around an electron density of 4.2 × 1028 m−3, both the electric energy density and the polarization density reaches to a maximum value. This means that for this electron density, the material allows the generation and coupling of maximum energy density to the incident wave, such that even the second and the third order polarization terms become significantly high. Figure 7 shows the spectrum of the output signal with the newly generated harmonics. Notice that not only the second harmonic, but also the third harmonic is generated via the induced ultra-nonlinear response (though at a lower efficiency).
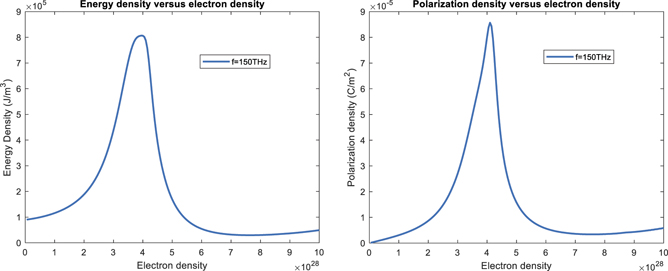
Figure 6. (a) Energy density versus total transition electron density for the given multi-resonant medium. (b) Polarization density versus total transition electron density for the given multi-resonant medium.
Download figure:
Standard image High-resolution image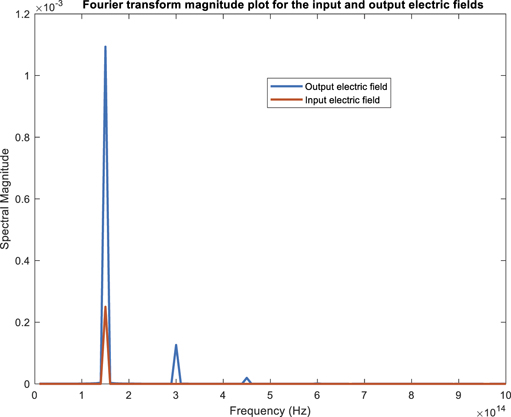
Figure 7. Fourier transform magnitude plots for the input and output electric fields under the given parameters.
Download figure:
Standard image High-resolution imageInterestingly, such high SHGE peak is not observed when the frequency of the first harmonic is set as 200 THz instead of 150 THz. Figure 8 shows the SHGE versus electron density for f = 200 THz. This time, the highest observed SHGE is on the order of 10−4, which still indicates a strong nonlinear response, but much less than the case for f = 150 THz. From this observation we understand that there is a complex mathematical relationship among the frequency of the first harmonic, the electron density, and the SHGE, which necessitates the use of elaborate fitting algorithms after making thousands of simulations. In this study we will not go into uncovering the exact relationship between these parameters but instead we will focus on how to tune the electron density for well-known semiconductors such as silicon or gallium-arsenide under commonly used frequencies of optical excitation for maximizing the SHGE.

Figure 8. SHGE versus total transition electron density for the given multi-resonant medium, for f = 200 THz.
Download figure:
Standard image High-resolution image3.2. Tuning the SHGE using silicon and gallium-arsenide
Silicon and gallium-arsenide are well-known semiconductors with relatively high nonlinearity. In the nanoscale, their SHGE is on the order of 10−4 in the near-infrared frequency range. Using equations (13)–(15), initially, the SHGE is actively tuned for silicon under excitation by an arbitrary near-IR laser source (220 THz). The corresponding wave and material parameters are given as [30–32]


The variation of the SHGE is shown in figure 9. For a transition electron density of N = 1.9 × 1028 m−3, the SHGE reaches 10.8, which is an extremely high value compared to the values observed in the nanoscale without active tuning. This means that the intensity of the generated second harmonic is 10.8 times greater than the intensity of the first harmonic of the input wave. Figure 10 shows the corresponding amplitude spectrum of the input and output waves. Notice that there is also a simultaneous generation of a strong third harmonic whose spectral amplitude is comparable to that of the first harmonic of the input wave.
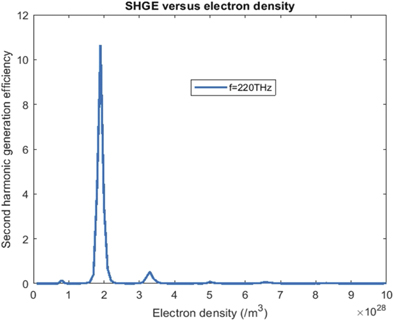
Figure 9. SHGE versus transition electron density for silicon computed at the frequency of f = 220 THz.
Download figure:
Standard image High-resolution image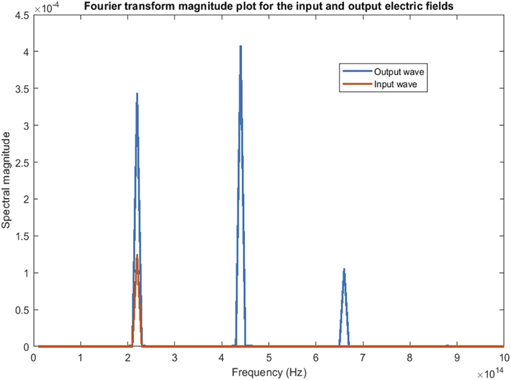
Figure 10. Fourier transform magnitude plots for the input and output electric fields.
Download figure:
Standard image High-resolution imageTo attain a transition electron density of N = 1.9 × 1028 m−3, one should first find the corresponding optical pumping rate Γ using equation (15). Doing so, a steady state optical pumping rate of 2.5 × 1038 m−3 s−1 is found using the given parameters. Such an optical pumping rate requires a beam intensity of 1013 W m−2, which corresponds to an electric field amplitude of 108 V m−1 (equation (20)). In the small-scale, this intensity level can be easily attained by a precise focusing of the pump beam through a lens, onto the interaction material cross-section. If we assume a typical small-scale material cross section of 100 μm2, this requires a pumping power of 1000 W.

h: Planck's constant, f: pump frequency, Δ: propogation distance, I: intensity, c: speed of light, Ep: pump wave electric field amplitude.
Using equations (13)–(15), the computations are repeated for gallium arsenide under an arbitrary near-IR laser excitation at 290 THz. This time the wave and the material parameters are taken as [30–32]


Although not as high as in the case for silicon, once again, a very high peak SHGE is observed for a transition electron density of N = 3.7 × 1028 m−3 (figure 11). Based on equation (15), this corresponds to the steady state optical pumping rate of 4.6 × 1038 m−3 s−1. The resulting spectrum for the input and output electric fields is shown in figure 12. Here the investigation is done in a single dimension, therefore this observation indicates the sensitivity of the SHGE in silicon (compared to GaAs) without regarding its crystal-structure. Hence, the investigation that is carried out in this section emphasizes the drastic enhancement/improvement of the SHGE via active tuning, regardless of the crystal-structure of a material. We believe this finding is of particular importance in the sense that weak SHGE in centrosymmetric media can be greatly enhanced via active tuning.
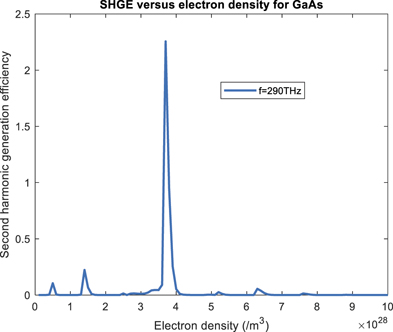
Figure 11. SHGE versus transition electron density for GaAs computed at f = 290 THz.
Download figure:
Standard image High-resolution image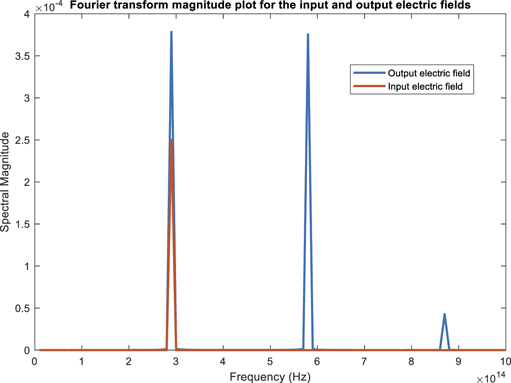
Figure 12. Fourier transform magnitude plots for the input and output electric fields.
Download figure:
Standard image High-resolution image3.3. Relationship between SHGE and the spectral location of the resonance
In this section we will investigate the variation of the SHGE with respect to the spectral distance between the excitation frequency and the resonance frequency. To examine this relation, we have investigated four different cases, in which the resonance frequency is gradually brought closer to the excitation frequency. The excitation and resonance frequency values for each case is provided below. Figures 13–16 illustrate the variation of the SHGE for each case. In the first case, the SHGE is quite weak and does not peak around a certain value of the transition electron density. For the second case, the SHGE is increased for all transition electron densities within the investigated range, although the SHGE still remains relatively weak compared to the values that are observed without any active tuning.


f: excitation frequency, f0: resonance frequency.

Figure 13. SHGE versus transition electron density, computed at f = 100 THz and f0 = 1500 THz.
Download figure:
Standard image High-resolution image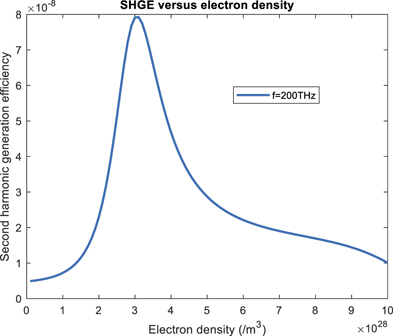
Figure 14. SHGE versus transition electron density computed at f = 200 THz and f0 = 1000 THz.
Download figure:
Standard image High-resolution image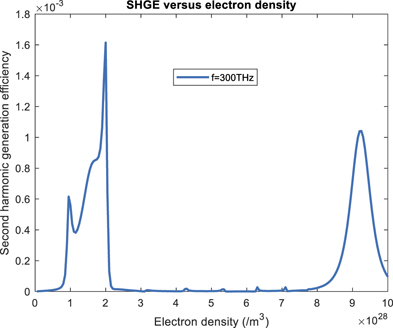
Figure 15. SHGE versus transition electron density computed at f = 300 THz and f0 = 700 THz.
Download figure:
Standard image High-resolution image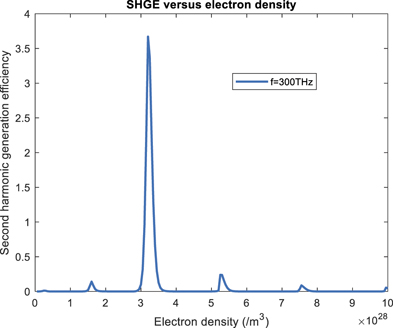
Figure 16. SHGE versus transition electron density computed at f = 300 THz and f0 = 400 THz.
Download figure:
Standard image High-resolution imageFor the third case, in which the resonance frequency is now only 400 THz beyond the excitation frequency, the SHGE peak attains a very high value for an electron density of N = 2 × 1028 m−3, which cannot be practically observed without the involvement of active tuning in the nanoscale. In the final case, the resonance frequency is just 100 THz away from the excitation frequency and the SHGE peak reaches to a super-high value of 3.7 for an electron density of N = 3.3 × 1028 m−3. From these four investigations we can see that the proximity of the resonance and the excitation frequencies has a very strong effect on the SHGE. However, regardless of their spectral distance, proper tuning of the transition electron density almost always leads to a sharp increase in the SHGE.
Based on our investigation, the SHGE does not change significantly with respect to the spectral-range of investigation, compared to the dramatic change that occurs when the excitation frequency is near the transition frequency, or the change that occurs when the transition electron density is optimally tuned. Hence, to attain a high SHGE at a particular range of the optical spectrum, one should choose an interaction material such that the resonance frequency of the material is in the close-proximity of the excitation frequency (or the first harmonic) and should make sure that the transition electron density is optimally tuned for SHGE maximization.
4. Comparison with experimental results
Our numerical results have been verified using the empirical formulation of SHGE that is derived from the experimental results [29, 30]. For an efficient verification, the equivalent nonlinearity coefficient ρ must be extracted from the numerical results for an arbitrary excitation amplitude, to be plugged into the experimental formulation. If the numerical results are precise, then they should match with the experimental ones for every excitation amplitude within the investigated range. Doing so we have chosen the sample amplitude as 109 V m−1 for the extraction of the equivalent nonlinearity coefficient, which is high enough to induce a strong nonlinear response in practice. Then, using equations (1), (13) and (14), we have compared the numerical and the experimental results for the following cases


For a sample amplitude of 109 V m−1, the nonlinearity coefficient for each case is evaluated respectively as  }.
}.
The resulting comparisons are shown in figures 17–18. Our results perfectly match with the experimental ones, unless the nonlinearity is extremely small as in case 1. This is expected, as the experimental formula is derived via measurements that are performed under significant nonlinearity. The matching of the computational and experimental results has been observed to improve with increasing nonlinearity.
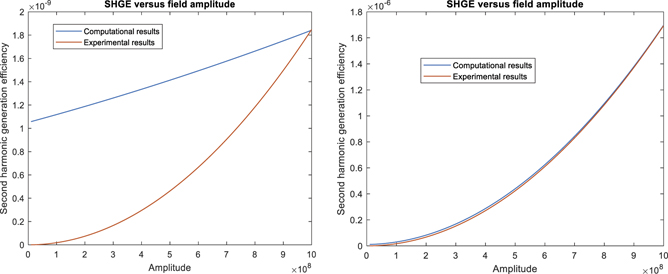
Figure 17. Comparison of the computational and experimental SHGE results for case 1 (left) and case 2 (right).
Download figure:
Standard image High-resolution image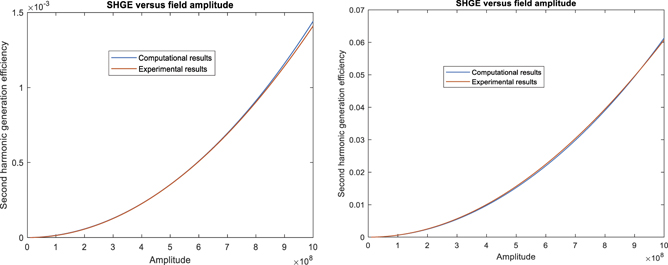
Figure 18. Comparison of the computational and experimental SHGE results for case 3 (left) and case 4 (right).
Download figure:
Standard image High-resolution image5. Practical impact of the study: high-harmonic generation via cascaded second harmonic generation
As explained previously, the active tuning of the SHGE is particularly important for high-harmonic generation (HHG). HHG has been a challenging problem in the field of integrated photonics, mainly due to the limitation of the SHGE in the small scale. As SHGE is usually quite weak in the nanoscale, HHG is accomplished through the generation of attosecond pulses, which is also quite challenging. Based on the results of this study, by adaptively tuning the transition electron density at each stage and thereby maximizing the SHGE, cascaded SHG can be employed for efficient HHG. At each stage, since the incoming wave frequency is doubled with respect to the previous stage, the optical pumping rate must be adaptively tuned such that the corresponding electron density is re-adjusted to yield the peak SHGE. Hence, high intensity is maintained at each stage, which results in efficient frequency-doubling. After continuous doubling of the frequency through the employment of many stages, spectral components of high practical use, such as extreme-UV and soft x-ray frequencies can be generated (see figure 19).
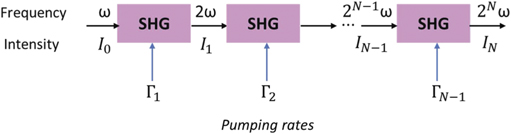
Figure 19. Tuning the optical pumping rate at each stage of the cascaded SHG process. The aim is to maximize the SHGE at each stage, such that effective HHG can be attained.
Download figure:
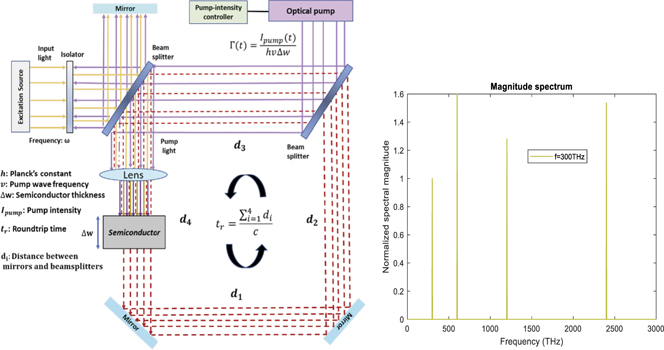
Standard image High-resolution imageFigure 20 illustrates the proposed optical setup for HHG via cascaded SHG. A cavity is formed via mirrors and beamsplitters, and the input wave is circulated within this cavity. At each roundtrip, frequency-doubling occurs via propagation of the input ray through the semiconductor material. The corresponding optical pump intensity is adaptively synchronized for attaining the optimal transition electron density that maximizes the SHGE per roundtrip. The distance between each mirror and/or beamsplitter is adjusted so that the total cavity length matches with the tuning period of the pump-intensity controller. If the tuning period of the controller is high, then the cavity length must be high, which would increase the size of the device.
Figure 20. Proposed optical setup for HHG via cascaded SHG (left) and the generation of an extreme-UV harmonic from an initial harmonic of 300 THz (right).
Download figure:
Standard image High-resolution image
6. Conclusion
For semiconductor nanomaterials, at certain electron densities in the conduction band, the SHGE can increase by a factor of 106 and sometimes even higher. For silicon and GaAs, the SHGE can become higher than 1 under active tuning, should the free electron density is carefully adjusted based on the excitation frequency. This is because for such electron densities, the energy density within the nanomaterial is concurrently maximized along with the polarization density. Aside from the electron density, the spectral distance between the excitation frequency and the resonance frequency is also a critical determinant of the nonlinear electrical response exhibited by semiconductors. If the spectral distance between the resonance and excitation frequencies is high, nonlinearity is diminished. However, by controlling the free electron density within a semiconductor nanomaterial, high level electrical nonlinearity can still be induced. The tuning of the free electron density for super-nonlinearity induction is especially critical for media with multiple resonance frequencies, as the polarization density can vary drastically within such media depending on the spectral position of the excitation frequency. Usually, selecting the excitation frequency to be within a 100 THz spectral proximity of at least one of the resonance frequencies results in a significantly higher nonlinearity to arise. Hence, the best strategy for the nanoscale induction of ultra-nonlinear electrical response is to firstly choose the excitation frequency to be around one of the resonance frequencies in accordance with the desired spectral range of the intended second harmonic, and then tune the free electron density via appropriate pumping such that the resulting polarization density gives rise to a sharply enhanced SHGE. This technique can also enhance the efficiency of other nonlinear processes such as optical parametric amplification and sum/difference harmonic generation, as the efficiency of these processes depends on the efficiency of the SHG process.
Data availability
The data are available within the article.
Code availability
Available from the author upon reasonable request.
Conflict of interest
On behalf of all authors, the corresponding author states that there is no conflict of interest.
Funding statement
This research received no external funding.