


Abstract
We report on experimental investigations of plasma wave structures in a plasma wakefield acceleration (PWFA) stage which is driven by electron beams from a preceding laser plasma accelerator. Femtosecond optical probing is utilized to allow for direct visualization of the plasma dynamics inside the target. We compare two regimes in which the driver propagates either through an initially neutral gas, or a preformed plasma. In the first case, plasma waves are observed that quickly damp after a few oscillations and are located within a narrow plasma channel ionized by the driver, having about the same transverse size as the plasma wakefield cavities. In contrast, for the latter robust cavities are recorded sustained over many periods. Furthermore, here an elongation of the first cavity is measured, which becomes stronger with increasing driver beam charge. Since the cavity length is linked to the maximum accelerating field strength, this elongation implies an increased field strength. This observation is supported by 3D particle-in-cell simulations performed with PIConGPU. This work can be extended for the investigation of driver depletion by probing at different propagation distances inside the plasma, which is essential for the development of high energy efficiency PWFAs.
Export citation and abstract BibTeX RIS

Original content from this work may be used under the terms of the Creative Commons Attribution 4.0 licence. Any further distribution of this work must maintain attribution to the author(s) and the title of the work, journal citation and DOI.
1. Introduction
Beam-driven plasma wakefield acceleration (PWFA) is among the most promising concepts to overcome the acceleration gradient limit of state-of-the-art radio-frequency (RF) accelerators. Driven by a relativistic charged particle beam [1, 2], a trailing plasma-density wave with strong accelerating fields is excited, which is suitable for the acceleration of a witness electron bunch to relativistic energies. In recent years, PWFA research has shown great progress culminating in the demonstration of energy doubling of a 42 GeV electron beam [2], an increased energy transfer efficiency from the wakefield to the witness bunch of up to 30% [3], high-energy positron acceleration [4] and the recent GeV electron acceleration by proton-driven plasma wakefields [5]. Furthermore, preservation [6] and minimization [7] of the energy spread of an externally injected witness bunch have been demonstrated. However, there are only a handful of conventional accelerators worldwide that have been used to produce driver electron beams for PWFA [7–11]. This is related to the challenge of the production of suitable electron beams with multi-kA currents, which are desirable to drive strong beam–plasma interaction and plasma wave amplitudes.
Studies of the short and long term plasma wave dynamics, driver beam evolution and depletion during propagation through such plasma accelerators still remain challenging. Here, we address these problems by utilizing an ultrafast optical probing for direct visualization of plasma dynamics in a PWFA stage, which is driven by high peak-current electron beams from a preceding laser-driven wakefield accelerator (LWFA). This allows us to study the differences in the morphology of the plasma waves excited when either ionized by the space-charge field of the electron driver (self-ionized regime) or pre-ionized by an auxiliary laser, as well as the influence of the driver beam charge on the shape of the first cavity. These were found to be elongated with respect to the nominal plasma wavelength, depending on the initial driver beam charge and the propagation distance through the target.
Recently, LWFAs have shown their capability to deliver electron beams suitable as an alternative driver of PWFA. After the first observation of plasma waves driven by LWFA accelerated beam in a PWFA [12], the first acceleration of witness bunches in this setup, the so-called LPWFA platform, has been achieved [13]. This was shortly followed by the demonstration of shock-front injection using gas-hydrodynamic shock [14], which represents an important step toward controlled injection inside PWFAs. Typical electron beams from LWFA have a duration in the femtosecond range [15] and a charge of a few hundred picocoulomb [16, 17], the correspondingly achieved peak currents surpass tens of kiloamperes and, thus, are far above those from existing RF accelerator machines. The transverse size of the beam σr
is in the range of a few micrometers [18] and thus, bunch densities nb in the range of 1018 cm−3 up to 1020 cm−3 can be achieved. This allows for accessing the strong-beam regime [19], where the condition of nb/ne > 1, with ne being the background plasma density respectively, needs to be fulfilled. In this regime, the electron driver beam is matched to the resonant condition for wakefield excitation, i.e. narrow-beam  and short-bunch σz
≈ λp/2, where kp = 2π/λp and λp denotes the plasma wavelength. During propagation, the space-charge field of the driver expels all plasma electrons from its vicinity, thereby creating a nearly spherical electron sheath surrounding a uniform ion cavity, the so-called blowout cavity [20]. As the driver peak-current increases, plasma electrons receive larger outward-directed transverse momentum, altering their trajectories. This leads to an increase of both, the cavity radius and length [21]. This results in an increase of the accelerating field strength at the cavity rear side. However, the strength of the decelerating field, where the driver is located, also increases, leading to a faster driver degradation, i.e. quicker loss of energy. As a result, some driver electrons lose so much energy that after a certain propagation distance they are left behind and thus no longer contribute to the wakefield excitation. Even though a higher accelerating field strength can be achieved this way, it may not be maintained for long distances because the driver depletes quickly. How fast this happens exactly in experiment is difficult to predict as it depends on many parameters such as driver length, plasma density, peak-current and potentially also on substructures or chirp of the driver beam.
and short-bunch σz
≈ λp/2, where kp = 2π/λp and λp denotes the plasma wavelength. During propagation, the space-charge field of the driver expels all plasma electrons from its vicinity, thereby creating a nearly spherical electron sheath surrounding a uniform ion cavity, the so-called blowout cavity [20]. As the driver peak-current increases, plasma electrons receive larger outward-directed transverse momentum, altering their trajectories. This leads to an increase of both, the cavity radius and length [21]. This results in an increase of the accelerating field strength at the cavity rear side. However, the strength of the decelerating field, where the driver is located, also increases, leading to a faster driver degradation, i.e. quicker loss of energy. As a result, some driver electrons lose so much energy that after a certain propagation distance they are left behind and thus no longer contribute to the wakefield excitation. Even though a higher accelerating field strength can be achieved this way, it may not be maintained for long distances because the driver depletes quickly. How fast this happens exactly in experiment is difficult to predict as it depends on many parameters such as driver length, plasma density, peak-current and potentially also on substructures or chirp of the driver beam.
For this reason, it is important to study the influence of the driver beam parameters on the shape of the excited wakefields, which affects the field strengths inside the cavity. One typical experimental challenge in a PWFA is the fact that the driver beam cannot be simultaneously characterized before and after the PWFA stage at each shot. Thus, initial driver beam parameters are taken from reference sets without the PWFA, providing average values and their shot to shot jitter. Of course it is possible to measure what remains from the driver after the PWFA module. However, these parameters are difficult to interpret as it is not known how strong the driver–plasma interaction has changed the initial parameters. Therefore optical probing techniques offer the possibility to directly look at the transient evolution of the plasma wave throughout its propagation [12, 22, 23]. Typically an ultrashort (≈10 fs) low intensity laser pulse is sent through the PWFA stage, perpendicular to the driver beam propagation axis. During the transit, the probe laser phase is modulated by the change of refractive index induced by the plasma density variations. This results to intensity modulations at the imaging plane, where the so-called shadowgrams are recorded.
This paper, reporting on the results of optical probing of the beam-driven plasma waves, is structured as follows: in section 2 we describe our setup. Section 3 presents the experimental results where we first provide typical parameters of the electron beams generated in the LWFA in section 3.1 and discuss the differences of the self- and the pre-ionized regime in section 3.2. It is followed by the observation of the correlation of the length of the first cavity and the driver beam charge in section 3.3. These findings are supported by 3D-simulations performed with PIConGPU which are shown in section 3.4. Finally, we provide an outlook how this correlation can be exploited to study the driver depletion further and conclude the paper in section 4.
2. Experimental setup
The experiments were performed with the DRACO Ti:Sa laser system operated at Helmholtz-Zentrum Dresden-Rossendorf [24]. As schematically shown in figure 1, the setup consists of two consecutive gas jets, with the first jet as the LWFA stage producing electron beams to drive plasma wakefields in the second gas jet. In order to generate high-peak current driver beams, as the key ingredient for this LPWFA approach, the LWFA stage is operated in the self-truncated ionization-induced injection scheme [16]. Here, laser pulses of 2.3 J energy and 30 fs full-width at half-maximum (FWHM) duration are focused by an F/20 off-axis parabolic mirror into a 3 mm-long helium gas jet doped with 3% nitrogen operating at a plasma density of 3.5 × 1018 cm−3.
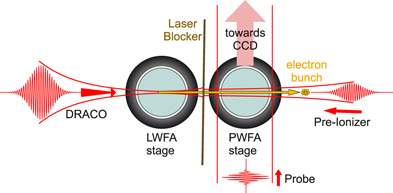
Figure 1. Schematic overview of the experimental setup. From left to right, a high intensity DRACO laser pulse drives an LWFA in the first stage, generating a high peak-current electron beam. While the spent laser is reflected by a thin foil, the electron beam passes through, entering the second stage to generate a beam-driven wakefield. In addition, a counter-propagating low-power laser pulse can be sent into the PWFA stage to produce a plasma environment prior to the arrival of the electron driver beam. The beam-driven plasma wave can be visualized by shadowgraphy using a synchronized ultrafast probe laser pulse propagating perpendicular to the driver propagation axis.
Download figure:
Standard image High-resolution imageThe PWFA stage, positioned 1 mm downstream of the first stage, is formed by a 3 mm-long hydrogen gas jet from an identical nozzle geometry as in the LWFA stage. This stage is operated at a plasma density within a range from 3.1 × 10¹⁸–6.6 × 1018 cm−3. A kapton foil of 25 μm thickness is located between the two gas jets, 500 μm before the PWFA stage. It reflects the spent LWFA driver laser pulse, while the LWFA electron beam transits through the foil. This leads to an increase of the electron beam divergence due to current filamentation instabilities created by high-intensity laser–foil interaction [25]. However, it does not degrade the driver beam ability to excite a wakefield in the subsequent PWFA stage [13, 14]. An inherently synchronized few-cycle laser pulse, generated from the main pulse, is applied perpendicular to the corresponding plasma wave and analyzed with an imaging system at high spatial resolution. It provides shadowgraphic images with a resolution of 0.31 μm per pixel on a 14 bit CCD camera. This probe pulse is generated from about 1.5 mJ of energy, spectrally broadened within a 1.0 m long hollow core fiber filled with 2.0 bar of neon [26] and temporally compressed by a set of chirped mirrors to a pulse length of 9.2 fs measured by a SPIDER-A.P.E [27]. In order to improve the visibility of plasma wave shadowgrams, the recorded raw images are post-processed following a protocol described in supplementary chapter 1 (https://stacks.iop.org/NJP/24/083034/mmedia). Finally, a continuous wavelet transformation (CWT) analysis using a Morlet-type function is applied to this profile to deduce the wavelength of the plasma wave along the propagation axis.
A dedicated nearly counter-propagating laser pulse (under an angle of 1.7°) can optionally pre-ionize the gas in the PWFA stage prior to the driver beam arrival. This pre-ionization laser pulse, also inherently synchronized with the main laser pulse, contains an energy of about 20 mJ and is focused by a spherical mirror with a focal length of 1 m to a spot size of about 100 μm, yielding a peak intensity of 4 × 10¹⁵ W cm−2 which is well above the ionization threshold for hydrogen gas. The arrival time of the pre-ionization laser pulse is adjusted by an optical delay line such that the plasma is created about 1 ps before the arrival of the driver beam.
3. Results and analysis
3.1. LWFA electron beams
Figure 2(a) illustrates typical electron spectra, sorted by peak energy, recorded with LWFA stage in operation and laser blocker foil in position, but the second gas jet turned off. These beams have a mean energy of 328 ± 29 MeV and an FWHM-energy bandwidth of 44 ± 18 MeV and the integrated charge within this bandwidth is 318 ± 71 pC. Here, the values of uncertainty are given as the standard deviation of the whole set of reference shots, i.e. these values represent the shot-to-shot jitter. The power spectrum of transition radiation, emitted as the beam passes through a thin metal foil, was measured by a multi-octave broadband spectrometer and allows for reconstruction of the temporal profile of the electron bunch [15, 28]. This results in a FWHM-bunch duration of about 14.8 ± 1.6 fs, corresponding to an estimated peak-current of about 22.6 kA. Furthermore, the electron beam size at the exit of LWFA stage is inferred from the betatron x-ray spectral-shape, yielding a root-means-square (rms) beam size of about 1 μm [18].

Figure 2. Characteristics of LWFA only shots. (a) Reference shots with the laser blocker foil in place, sorted by peak energy. The vertical axis has a total width of 27 mrad for every shot. (b) Correlation of the beam charge (FWHM) to the peak energy for these reference shots. The beam loading effect is clearly visible here, the result of the linear fit is used to calculate the estimated charge from the measured remaining peak energy (see section 3.3). The lightgreen area represents the standard deviation of the shots around the fit.
Download figure:
Standard image High-resolution imageSmall variations of the laser and plasma parameters lead to a shot-to-shot jitter of the electron beam properties. Especially the charge and the energy of LWFA accelerated beams are coupled due to the beam loading effect [16, 17, 29], i.e. electron beams of higher charge strongly flatten the accelerating field which results in a reduction of the beam energy. By plotting the beam charge as a function of the peak energy as depicted in figure 2(b), the charge–energy correlation can be extracted and is linearly fitted to Q(Epeak) ≈ (−2.02 ± 0.24) pC MeV−1 ⋅ Epeak + (981 ± 80) pC. As the energy and charge can also be influenced by other parameters, the data points are scattered around the fit. For the whole experimental run, the nominal parameters of the laser and plasma for the LWFA stage are kept fixed.
3.2. Structure of plasma waves in the self- and pre-ionized regime
The driver beam interaction and plasma dynamics within the PWFA stage differ depending on whether the electron beam enters a plasma environment, generated by the pre-ionization laser, or a neutral gas, which will be ionized by the space charge field of the driver beam itself (self-ionized regime). Both cases were investigated during the experiment and the resulting plasma waves, profiles along the axis of the waves and the CWT analysis, are shown in figures 3(a)–(c) for the self-ionized case and in (e)–(g) for the pre-ionized case. Both are recorded at the center of the PWFA stage (1.5 mm after the driver beam enters the PWFA stage), operated at a plasma density of np = 4.5 × 1018 cm−3.

Figure 3. Examples of measured plasma waves and their analysis, both at the same gas density providing a plasma density of 4.5 × 1018 cm−3: left column: self-ionized case, right column: pre-ionized gas. (a) and (e) Are showing the post processed picture of the plasma wave (angle of the wave due to alignment precision of the camera), (b) and (f) show the profile through the middle of the plasma wave and (c) and (g) show the wavelet analysis of this profile using a Morlet-typed test wavelet. The red line represents the maximum of the wavelet analysis at the corresponding longitudinal position, i.e. the best fitting wavelength. Results of simulations done with Osiris 3.0 are depicted in (d) and (h), where the gray scale represents the plasma density, the color scale shows the driver density. In the bottom graph the longitudinal field strength and a line-out through the center propagation axis is depicted. This simulation also shows a quick smearing out of the plasma wave in the self-ionized case compared to the pre-ionized one.
Download figure:
Standard image High-resolution imageHere, a distinct difference on the wakefield structure is observed between the two cases. In the self-ionized regime, a narrow plasma channel inside the neutral gas background along the driver beam propagation axis is seen, in which a few clear periods of plasma wave oscillation located at the channel front side are visible (see figure 3(a)). Such a plasma wave, however, quickly damps out and vanishes to below the detection limit, at the latest after the ninth cavity. In contrast, in the pre-ionized regime, the associated shadowgram exemplified in figure 3(e) exhibits a pronounced plasma wakefield structure that extends significantly further out and can have up to 25 subsequent, well-pronounced cavities. Additionally, a cone like feature trailing the plasma wave after 1 ps can be identified, which is attributed to the transverse ion motion induced by the wakefield, as also reported in [12]. Furthermore, the wavelet analysis, presented in figures 3(c) and (g), yields a plasma wavelength of about 15.8 μm, fairly constant along the wakefield and almost identical for both cases. This value agrees well with the nominal plasma wavelength,  m [30], for the plasma density of 4.5 × 1018 cm−3, independently measured using tomographic interferometry [31].
Assuming a Gaussian beam distribution, the space-charge field of the driver reaches a maximum value of  , where Ib is the driver peak current and E0 the non-relativistic wave-breaking field, at distance r ≃ 1.585 σr
from the propagation axis [21]. There is no direct way to extract the transverse size σr
of the driver beam while propagating inside the PWFA stage, as the beam refocusing dominates the dynamics. However, since the beam size [18] and the divergence at the exit from the LWFA stage are measured, the beam size at the entrance of the PWFA can be estimated. The divergence of the beam after the LWFA stage was measured at the electron spectrometer to be 1.81 ± 0.17 mrad. However, before entering the PWFA stage, the beam has to pass through the laser blocker foil. While fully reflecting the spent LWFA driver pulse, the high-intensity laser–foil interaction causes a current filamentation instability within the foil, leading to a significant divergence increase to the beam upon foil transition [25]. The divergence of the beam after the blocker foil increases to 4.2 ± 0.8 mrad. Accordingly the transverse beam size at the entrance of the PWFA stage is estimated to be σr
≈ 3.3 μm representing the upper limit of the size within the PWFA stage. Using this value, the space-charge field amounts to 186 GeV m−1 (considering Ib = 22.6 kA), far above the ionization threshold for hydrogen of about 33.8 GeV m−1 [21]. This implies that the peak current of the driver is sufficiently high to fully ionize the hydrogen gas target even in the self-ionized regime, which is confirmed by consistent measurement of plasma wavelengths between the two cases.
, where Ib is the driver peak current and E0 the non-relativistic wave-breaking field, at distance r ≃ 1.585 σr
from the propagation axis [21]. There is no direct way to extract the transverse size σr
of the driver beam while propagating inside the PWFA stage, as the beam refocusing dominates the dynamics. However, since the beam size [18] and the divergence at the exit from the LWFA stage are measured, the beam size at the entrance of the PWFA can be estimated. The divergence of the beam after the LWFA stage was measured at the electron spectrometer to be 1.81 ± 0.17 mrad. However, before entering the PWFA stage, the beam has to pass through the laser blocker foil. While fully reflecting the spent LWFA driver pulse, the high-intensity laser–foil interaction causes a current filamentation instability within the foil, leading to a significant divergence increase to the beam upon foil transition [25]. The divergence of the beam after the blocker foil increases to 4.2 ± 0.8 mrad. Accordingly the transverse beam size at the entrance of the PWFA stage is estimated to be σr
≈ 3.3 μm representing the upper limit of the size within the PWFA stage. Using this value, the space-charge field amounts to 186 GeV m−1 (considering Ib = 22.6 kA), far above the ionization threshold for hydrogen of about 33.8 GeV m−1 [21]. This implies that the peak current of the driver is sufficiently high to fully ionize the hydrogen gas target even in the self-ionized regime, which is confirmed by consistent measurement of plasma wavelengths between the two cases.
The structure of the observed plasma waves differ strongly between the self- and the pre-ionized regime, which can be explained as a consequence of the limited size of the generated plasma column. Without pre-ionization, a plasma channel with a narrow width of approximately the same order of magnitude as the transverse diameter of the electron driver beam is produced, i.e. a radius of ∼7 μm from figure 3(a), and sustained over ps time scale. Immediately after ionization, electrons are expelled from the beam propagation path to reach a maximum distance from the axis which is given by the blowout radius of  m [21]. Therefore, some electrons can escape into the neutral gas region, such that they no longer experience the attracting force from the ion channel and thus do not return to the axis [32, 33]. Electrons within the reach of the ionic attracting force move back and cross the propagation axis at various longitudinal positions, depending on their ionization location and thus with different oscillation phase and frequency, as can be seen in simulation figure 3(d). As a consequence, a less narrow electron sheath is formed which smears out after a few cavities. The strength of the accelerating field at the rear side of the first cavity is weaker and it has been observed that this results in lower witness bunch energies compared to the pre-ionized case [13]. That is because the pre-generated plasma channel is much wider as determined by the width of the pre-ionization laser. Hence, the expelled plasma electrons, independently of the initial location, oscillate collectively and, thus, return back to the beam propagation axis at a defined longitudinal position, which leads to a sustainable plasma wave generation, as shown in figure 3(h).
3.3. Correlation of the first cavity size with the driver properties
The variations of driver beam properties as described in section 3.1 can be utilized to explore the impact of the driver beam charge and energy on the generation of plasma wakefields. For this purpose, we compare the shadowgraphy images, taken in the pre-ionized regime, for different spectral-charge distributions of the remaining driver beam extracted from the electron spectrometer. Three sample shots are illustrated in figure 4(a) for the shadowgrams and (b) for the associated remaining driver. All shots are taken using the same nominal density of 3 × 1018 cm−3 for the PWFA stage which corresponds to a nominal plasma wavelength λp ≈ 19.3 μm. In all three images, the trailing plasma cavities have approximately the expected length while the first cavity is significantly elongated. This elongation gets stronger from top to bottom, whereas the most obvious change in the corresponding electron spectra is a decrease in energy.
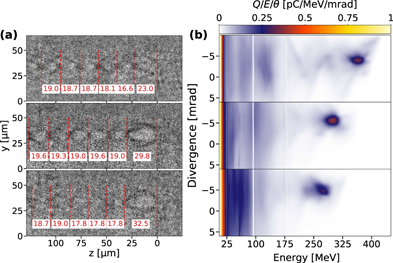
Figure 4. Shadowgrams (a) and corresponding electron spectrometer (b) data for three sample shots. Size of the first cavity increases from top to bottom, cavities behind match to the expected linear plasma wavelength of 19.3 μm, electron peak energy is decreasing from top to bottom, which is an indication of increasing charge. All shots are taken at a nominal plasma density of np = 3.0 × 1018 cm−3 and in a pre-ionized condition. The white lines at roughly 90 MeV and 180 MeV is a blind area between two screens and has no physical meaning.
Download figure:
Standard image High-resolution imageAccording to theoretical work [19], the elongation of the first cavity should mainly depend on the charge density of the driver at the observation point. However, in experiment, the initial driver charge cannot be directly measured as driver–plasma interaction in the PWFA stage leads to beam degradation. This becomes visible in the energy spectra (see figure 4(b)), where the decelerated electrons redistribute over a large energy range from the initial energy down to zero-MeV energy. As a result, the measured charge within FWHM of the high energy distribution drops on average to 21% of the reference shots. This implies that the initial charge reconstruction based on measured remaining charge is inaccurate. This is exacerbated by the fact that drivers containing initially more charge generate more strongly fields within the plasma cavity, causing them to decelerate stronger than less charged drivers.
Nevertheless, the initial charge of the driver beam is still encoded in the spent driver peak energy via the beam loading effect described earlier above in section 3.1. This correlation allows us to estimate the initial charge using the linear function presented in figure 2(b). Since the decelerating field in the PWFA is not constant along the length of the driver bunch, the deceleration occurs at different rate, depending on where the electrons are located with respect to the decelerating field. The front part of the beam can maintain its energy until the end of the plasma, as confirmed by simulations presented in section 3.4.
Figure 5 shows the length of the first cavity normalized to the nominal plasma wavelength versus the derived initial FWHM beam charge. Here, the elongation increases significantly with increasing driver charge. The error in the estimated bunch charge represents the uncertainty of the indirect determination method as illustrated by the light green band in figure 2(b). The uncertainty of the fit itself would lead to a slightly different horizontal axis, but would not effect the relative correlation between the data points and is therefore not shown. The vertical error is assumed to be two pixels for the measurement of the cavity sizes.
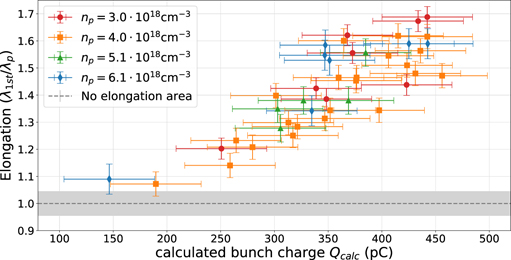
Figure 5. Here the elongation normalized to the nominal plasma wavelength for different plasma densities is plotted versus the calculated initial beam charge. This calculation is done using the linear correlation of energy and beam charge from the reference shots (as in figure 2(b)), representing the beam loading effect in LWFA. The error in the bunch charge is dominated by the error in the fit function in figure 2(b), the errors of the elongation are estimated to be two pixels for cavity length measurement.
Download figure:
Standard image High-resolution imageThe correlation of cavity elongation and charge is valid for the full range of densities where data was taken, so between 3.0 × 1018 cm−3 and 6.1 × 1018 cm−3, corresponding to linear plasma wavelengths of 19.3 μm down to 13.5 μm. As the duration, and thus longitudinal size (length) of a single bunch, is set from the LWFA stage, the change in density also changes the ratio of bunch length relative to the plasma wavelength. Because the values of elongation for a certain value of initial driver charge hardly differ at different densities, this means the influence of this longitudinal ratio in this setup is much smaller compared to that of charge. This clearly shows that  still holds for such high plasma densities. Assuming a cylindrical bunch, the average density of a bunch nb with the properties described in section 3.1 is estimated to be nb = 1.2 × 1019 cm−3 and thus larger than the plasma densities used in experiment, as required to enter the blowout regime.
3.4. Simulations
Experimental findings of a charge-dependent elongation are supported by three-dimensional particle-in-cell (PIC) simulations performed with PIConGPU [34], starting right after the laser blocker foil. While most of simulated driver and plasma parameters are deduced from the measured experimental quantities, the bunch charge is stepwise increased to numerically access the strong-beam interaction regime. All other input parameters such as transverse and longitudinal rms size, energy and energy spread are fixed and remain the same for all three simulations. It is assumed that the driver bunch features an uncorrelated phase-space when leaving the LWFA stage and enters the fully ionized second stage with a finite divergence, i.e. defocused phase-space distribution. As the plasma cavity starts to develop in the density up-ramp, the focusing field pinches most of the beam, resulting in a compact driver for the wakefield excitation (see supplemental material). Figure 6(a) presents the simulated plasma waves excited by different energy-FWHM-integrated driver bunch charges: 228 pC (top), 152 pC (middle) and 76 pC (bottom). One can clearly see that for the lowest driver charge the plasma wave exhibits a regular structure from the head to the trailing part with a wavelength matched to the linear theory, i.e.  with c denoting the speed of light,
  0 the vacuum permittivity, me the electron mass and e the elementary charge. When the driver charge increases, the first cavity elongates and simultaneously the accelerating field strength at the cavity rear-side becomes stronger, exceeding 500 GV m−1 for the 228 pC driver. Due to the stronger field induced by drivers of higher charge, the plasma electrons are pushed further out, resulting in a larger radial and longitudinal size of the cavity as they need longer time for returning back to the axis. This increased radius of the positively charged ion background of the cavity leads to a stronger electric field inside the plasma cavity. This observation is consistent with previous theoretical predictions [19, 21, 35], which all show an increase in field strength for increasing driver peak current. The simulations qualitatively resemble the experimental findings, demonstrating that such a dense bunch is capable of driving the full blowout and the first cavity length significantly increases for high charge driver beams.
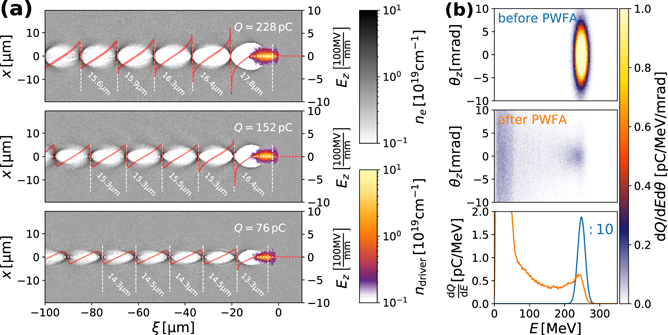
Figure 6. PIC simulation results: (a) snapshot of generated plasma waves at the center of the PWFA stage for different initial driver bunch charges at a plasma density of ne = 4.5 × 1018 cm−3. At the PWFA entrance, other parameters of the driver are 2.3 μm transverse beam size (rms), 4.17 mrad divergence (rms), 20 fs duration (FWHM). The white dashed line indicates the border of each plasma period while the red solid line represents the accelerating field on axis. The cavity elongation is clearly visible when the driver charge increases. The details of the simulation setup and the initialization procedure can be found in [36]. (b) Shows simulated electron spectrometer measurements before (top) and after (middle) interaction in the PWFA stage and the energy distribution summed along the divergence axis (bottom). For a better visibility, this is divided by ten for the before-PWFA-case. Note, that the peak position stays at approximately the same energy.
Download figure:
Standard image High-resolution imageFigure 6(b) shows the corresponding simulated electron spectrometer. Comparing the spectrum of the initial bunch (top) and after the interaction (middle) a strong deceleration and charge loss as in experiment was observed, which is consistent with the experimental observations discussed in section 3.3. Even though these two effects become stronger for higher charge driver (see supplementary chapter 4), the high-energy peak stays at approximately the same value, justifying our approach of reconstructing the initial charge via the peak energy.
4. Outlook and conclusion
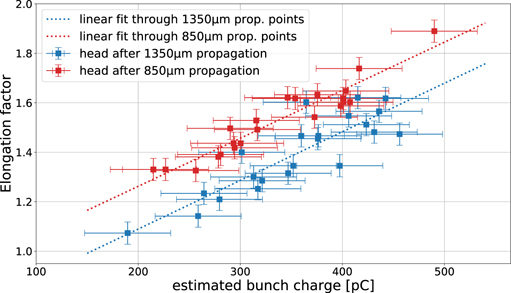
The elongation of the first plasma cavity turns out to be mainly caused by the charge of the driver. Therefore, in principle, this work can be extended to investigate driver depletion. This can be done by probing the scaling of the plasma waves at different positions along the driver propagation axis. An example of this is shown in figure 7, where the cavity elongation was measured after 850 μm and 1350 μm of propagation. The elongation achieved at the first position reaches higher values than for shots having about the same estimated initial charge but were captured 500 μm further downstream. For our experimental conditions, there is a clear difference in the measured elongations, which indicates ongoing charge loss between the two observation positions. Up to now there was no data taken at additional positions but as the changes are already visible here, this shows that the measurement of the elongation could be a powerful tool to further investigate the driver depletion and the evolution and stability of the excited wakefield during the propagation.
Figure 7. Elongation of the first cavity versus estimated initial bunch charge using the charge–energy correlation in the beam loading regime, for two different positions within the PWFA stage. Plasma density was at 4 × 1018 cm−3 in both cases. The dotted lines represent a linear fit through each data set, just to guide the eye.
Download figure:
Standard image High-resolution image
In conclusion, the driver–plasma-interaction in the blowout regime is explored for the first time in a PWFA module driven by intense laser-accelerated electron bunches. An ultrafast optical probing technique provides a new insight revealing subtle details of the generated plasma wave structure and its dynamics. Increases in the drive charge cause the first cavity to become longer than the trailing plasma waves, consistent with PIC simulations. Here it is also shown, that the wakefield structure changes during the propagation process, caused by driver deceleration leading to a decrease in the number of electrons, contributing to the wakefield excitation. Successful operation in this regime will allow the implementation of advanced electron injection schemes [37–39] directly inside the PWFA stage where electrons are injected and accelerated near the optimal phase of the plasma wakefield for the generation of ultra high-brightness beams. This hybrid LPWFA staging therefore can serve as a powerful platform to conduct fundamental studies of PWFA concepts at widely accessible high-power laser facilities, complementary to RF-based PWFA facilities.
Acknowledgments
This project was fully supported by the Helmholtz association under program Matter and Technology, topic Accelerator Research and Development. SC, OK and MG were supported by the European Research Council (ERC) under the European Union's Horizon 2020 research and innovation programme (Miniature beam-driven Plasma Accelerators project, ERC Grant Agreement No. 715807). FMF was funded by the Max Planck School of Photonics, FH is funded by the BMBF through the Verbundforschungsprojekt 'Ultrafast Imaging of Plasmas (ULFI)', ADö and SK are funded by the Centre for Advanced Laser Applications (CALA). BH, TH, and AN were supported by the European Research Council (ERC) under the European Union's Horizon 2020 research and innovation programme (NeXource, ERC Grant Agreement No. 865877) and by the Science and Technology Facilities Council (STFC) ST/S006214/1 PWFA-FEL.
Data availability statement
The data that support the findings of this study are available upon reasonable request from the authors.