


Abstract
We report on the realization of an extremely sensitive x-ray polarization microscope, allowing to detect tiniest polarization changes of 1 in 100 billion (10−11) with a μm-size focused beam. The extreme degree of polarization purity places the most stringent requirements on the orientation of the polarizer and analyzer crystals as well as the composition and the form fidelity of the lenses, which must not exhibit any birefringence. The results show that these requirements are currently only met by polymer lenses. Highly sensitive scanning x-ray polarization microscopy thus is established as a new method. It can provide new insights in a wide range of applications ranging from quantum electrodynamics and quantum optics to x-ray spectroscopy, materials research, and laser physics.
Export citation and abstract BibTeX RIS

Original content from this work may be used under the terms of the Creative Commons Attribution 4.0 licence. Any further distribution of this work must maintain attribution to the author(s) and the title of the work, journal citation and DOI.
1. Introduction
Polarization microscopy is a familiar method in visible optics that has many applications in, e.g., geoscience for the identification of minerals [1], in biology for the analysis of the organization of cells and tissues [2], and in material science for residual stress measurements [3]. It is used to reveal the connection between the structure of the material and its properties and mode of action. Polarization microscopy images the change of polarization induced by a material to make it accessible to investigation with high resolution. Changes of the polarization state are caused by birefringence or dichroism. The former is described by an anisotropy in the real part of the complex refractive index, the latter by anisotropy in the imaginary part [4]. In the optical case the sensitivity to anisotropy concerns the structure of the medium under investigation, while the local anisotropy at the atomic level can be probed in the x-ray regime, if the energies are chosen according to the absorption edges of the atom in the medium [5]. So far, the development of x-ray microscopy and x-ray polarimetry have progressed separately and the full power known from the optical methodology could not be exploited in the x-ray range although the x-ray polarimeters achieve a much higher extinction ratio than their visible counterparts, and offer the advantage of element specificity.
1.1. High-precision x-ray polarimetry
The development of x-ray polarimetry has considerably progressed during the last ten years [6–8]. Driven by the quest for the first observation of vacuum birefringence [9], x-ray quantum optics exploiting nuclear resonant scattering [10–12], and x-ray polarization-sensitive spectroscopy [4, 13], the degree of polarization purity has been improved to the level of 5.5 × 10⁻¹¹ [14]. High precision x-ray polarimeters are based on multiple reflections in channel-cut crystals at Bragg angles close to 45° [15]. For these angles, the polarization component parallel to the diffraction plane (π-component) is suppressed. The degree of suppression is determined by the divergence and energy bandwidth of the x-ray source as well as by presence of simultaneously excited Umweg reflections and the perfection of the crystal material [16, 17]. With present x-ray sources, polarization purities of 10−12 are possible in principle, where the degree of polarization purity δ0 is defined as the ratio of the transmission of the π-component Tπ to the transmission of the σ-component Tσ of the polarimeter [18].

The transmission is a function of the reflectivity in the channel-cut crystals and the brilliance of the x-ray source.
As the degree of polarization purity depends on the divergence of the x-ray source, an x-ray polarization microscope requires close to perfect recollimation after focusing the x-ray beam. Both, focusing and recollimation, must take place between polarizer and analyzer crystal. Therefore, it is paramount that the focusing optical elements do not impair polarization.
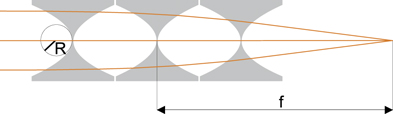
Figure 1. Scheme of a CRL consisting of three biconcave lens elements.
Download figure:
Standard image High-resolution image1.2. Focusing of x-rays
Several methods have been developed to focus x-rays. The most commonly used are based on grazing incidence reflection on curved surfaces (e.g. Kirkpatrick–Baez mirrors [19]), diffraction by Fresnel zone plates [20], and refraction by compound refractive lenses (CRLs) [21]. CRLs are based on the refraction of x-rays. The refractive index for x-rays in a material is less than one and is written as follows:

δ describes the refractive index decrement which is responsible for refraction and β is the absorption coefficient, describing the attenuation of x-rays. Due to the small and photon energy dependent refractive index decrement (δ ≈ 10−4...10−6), the deflection angles are small. To achieve a small focal length, x-ray lenses require small radii R of curvature and a large number N of single lens elements aligned in one row. Spherical aberration are avoided by a parabolic lens profile. Figure 1 shows a schematic sketch of a compound refractive lens.The focal length f for thin lenses is calculated as follows [22]:

The achievable focal spot size (FWHM) of CRLs for an undulator source in vertical (Bν ) and horizontal direction (Bh) is [22]:

It thus depends on the source size σν,h, the source-to-lens distance L1, the selected focal length, the wavenumber k used, the linear coefficient of attenuation μ, as well as the surface roughness σ of the lenses. The focusing properties are also influenced by the form fidelity of the CRL and the homogeneity of the lens material. To achieve a μm-sized beam the surface roughness and deviations from the paraboloid shape should be less than 1 μm. Depending on the energy range, different lens materials are available. In our energy range of interest for precision polarimetry of 6–30 keV, beryllium lenses are most commonly used. Beryllium has the advantage of low absorption and the lens fabrication process is mature. Other lens materials include diamond, polymers and silicon. Diamond lenses have been developed for their excellent high thermal conductivity and low thermal expansion. However, the absorption compared to beryllium is higher and the processing is not yet as developed as for beryllium lenses. Polymer lenses are characterized by their excellent shape accuracy and low surface roughness. However, these materials have a lower transmission due to their chemical composition. Microstructured silicon lenses were developed for nanofocusing but suffer from a small effective aperture and therefore intensity losses at current x-ray sources [23].
In this work, CRLs made of different materials are evaluated for their suitability for polarization microscopy. The challenge is that the crystallinity of common lens materials can change the polarization purity of the beam due to accidental Bragg reflections inside the lens material [24]. Even angularly well separated reflections can lead to small polarization changes due to the long tails of their rocking curves. We compare four different lens materials for our CRLs: single crystalline diamond lenses [25], polycrystalline beryllium lenses [22], amorphous lenses made from SU-8 [26], and glassy carbon. Finally, the performance of the polarimeter is shown by studying polarization changes upon transmission through a beryllium foil.
2. Experimental methods
An x-ray polarization microscope was realized at beamline P01 of the synchrotron PETRA III (DESY) in Hamburg. Due to the x-ray beam's small divergence of nominally 18.8 μrad × 25.9 μrad (V × H, FWHM) and the high photon flux of  ph/s per 2 eV bandwidth, the beam line is very suitable for high-resolution x-ray polarimetry. Figure 2 shows the schematic setup of the polarization microscope.
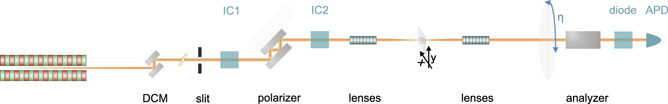
Figure 2. Scheme of the experimental setup of the polarization sensitive microscope at P01. The incoming radiation from the left is polarized by a channel-cut crystal and afterward focused by a first CRL. The polarization change of a sample can be analyzed in the focused beam in the μm range. Behind the sample, the beam is recollimated by a second CRL and the polarization is analyzed by a second channel-cut crystal in crossed position.
Download figure:
Standard image High-resolution imageWe use a Si(111) double crystal monochromator (DCM) for tuning the photon energy to E = 12.914 keV. At this energy, the π-component of the incoming radiation is suppressed by a four-reflection Si(800) channel-cut crystal due to the Bragg angle of 45° at this energy. The intensity before and behind the polarizer can be monitored by ionization chambers IC1 and IC2. Behind the polarizer the focusing and recollimating CRLs can separately be moved into the beam. In order to keep the high flux at the analyzer, we chose a focal length of  m for each CRL. Behind the CRLs the polarization of the radiation can be analyzed by a second four-reflection Si(800) channel-cut crystal. To this end, the analyzer crystal can be rotated around the diffraction plane of the first polarizer crystal (η-circle) from the full transmission to the extinction position, as shown in figure 2. The extinction position is the position of the polarimeter at which the diffraction plane of the polarizer is perpendicular to that of the analyzer. To cover the entire dynamic range of 11 orders of magnitude, a photodiode for higher count rates and stack of single-photon counting APD's (avalanche photodiodes) for lower count rates are used for measuring the intensity behind the analyzer.
2.1. Focal size
The different lens materials were processed by various fabrication methods and, therefore, have different surface roughness which affect the achievable focal size of the beam. Four different lens materials were examined: beryllium lenses (RXOPTICS GmbH & Co KG), diamond lenses (S. Antipov, PALM Scientific), SU-8 lenses (A. Last, KIT) and glassy carbon lenses (I. Uschmann, processed by HEMA Formenbau + Kunstoffverarbeitung GmbH). Beryllium lenses are manufactured by a pressing technique and achieve a surface roughness of 0.1 μm [22]. SU-8 is a negative polymer photoresist. Lenses are fabricated by x-ray lithography allowing a surface roughness of 0.013 μm [27]. The glassy carbon lenses were manufactured by electrical discharge machining. The resulting surface roughness was 5 μm. The available diamond lenses were fabricated by ultrafast laser ablation and achieve a surface roughness of 1 μm [28]. Using the knife-edge method, we tested the focusing capabilities of the different lens materials when only the first CRL was placed in the beam. Two 2 mm tungsten blades were used for knife-edge scans of the beam size in the optimal focal distance, one blade for the horizontal and one for the vertical direction. For the determination of the focal size, the knife edge is moved through the focus in 3 μm steps. Assuming a Gaussian beam profile, the measured intensity behind the knife edge represents an error function. Its derivative was used to determine the size of the focus as characterized by its full width at half maximum (FWHM). Table 1 compares the results achieved for the four different CRLs.
Table 1. Measured vertical (Fv) and horizontal (Fh) focal sizes (FWHM) for the different CRLs. The size of the beam was restricted to the different apertures of the lenses by a pair of slits behind the monochromator. f denotes the theoretical focal lengths. For the number of individual lenses in each CRL and their radius of curvature, please refer to table 2.
| Material | Fv (μm) | Fh (μm) | Slit size (mm) | f (m) |
|---|---|---|---|---|
| Be O-30 H | 7.4 ± 0.6 | 31.5 ± 0.2 | 0.43 | 6.1 |
| SU-8 | 7.2 ± 0.5 | 28.4 ± 0.5 | 0.5 | 5.6 |
| Diamond | 10.0 ± 0.7 | 30.7 ± 0.1 | 0.43 | 5.7 |
| Glassy carbon | 21.6 ± 1.8 | 34.2 ± 0.1 | 0.67 | 5.9 |
The focal size is limited by the x-ray source size (367 μm (FWHM) in horizontal and 26 μm (FWHM) in vertical direction), the source-lens distance of 81.59 m and the focal lengths of the lenses. The obtained focal size is reasonably comparable with the expected size of 30 μm in horizontal direction and significantly higher than the expected size of 2.4 μm in the vertical direction. The last deviation is mainly due to the deterioration of the x-ray beam property in the vertical direction by the DCM. The smallest foci are achieved with the beryllium and the SU-8 lenses. The surface roughness of the diamond and the glassy carbon lenses resulting from the manufacturing process (respectively laser ablation and electric discharge machining, EDM) most likely is the reason for their larger foci. Laser ablation induces internal damage in the bulk of the diamond leading to random conversion of diamond into carbon. Therefore, the effective density profile of the lens deviates from the design values. In the case of glassy carbon lenses, errors in the form fidelity in the parabolic apex of the lenses lead to an additional broadening.
2.2. Polarization purity
In order to determine the influence of the lenses on the polarization purity of the polarimeter, the purity of the polarimeter without lenses has to be determined first. The polarization purity of the polarimeter is determined by rotating the analyzer crystal around the diffraction plane of the polarizer crystal (η-circle). At each position the rocking curve of the analyzer crystal can be measured. The integrated intensity of the rocking curves (transmission as a function of Bragg angle θB of the crystal set) in each η-position of the analyzer crystal can be described by Malus' law:

In the vicinity of the extinction position Malus' law can be approximated by a parabola,

implying that the polarization purity can also be determined from the dependence of the peak intensity of the rocking curve on η [8]. Accordingly, the analyzer is adjusted to the peak of the Si(800) rocking curve and subsequently rotated on the η-circle close to the extinction position. The performance of the polarimeter strongly depends on the presence of excited Umweg reflections. The beamsize was restricted to 0.5 mm × 0.5 mm by a slit in front of the polarizer for the measurement. Thanks to the small divergence of the x-ray beam of the beamline and a precise azimuthal orientation of the analyzer as well as the polarizer crystal (better than 0.05°), a polarization purity of (1.4 ± 0.9) × 10−11 is obtained, which actually sets a new record.
The next step in the characterization of the polarization microscope is to measure the influence of the lenses on the performance of the polarimeter. To this end both CRLs were inserted between polarizer and analyzer crystal in a focusing-recollimation setup. Table 2 and figure 3 display the achieved polarization purities for the different materials in comparison.
Table 2. Achieved polarization purities δ0 for the different lenses with the transmission T, the lens apex radius R, and the number N of single lens elements per stack.
| Material | δ0 | T | R (μm) | N |
|---|---|---|---|---|
| No lenses | (1.4 ± 0.9) × 10−11 | — | — | — |
| Be O-30-H | (6.9 ± 0.2) × 10−9 | 0.93 | 50 | 2 |
| SU-8 | (3.3 ± 1.5) × 10−11 | 0.64 | 129 | 14 |
| Diamond | (3.1 ± 0.7) × 10−10 | 0.82 | 100 | 2 |
| Glassy carbon | (1.9 ± 0.1) × 10−9 | 0.63 | 125 | 6 |
aSU-8 lenses are 1D lenses, so 2 × 7 1D lenses have to be stacked together in perpendicular alignment for a focusing in horizontal and vertical direction.

Figure 3. Intensity suppression near the extinction position for the different lenses in comparison. A measurement time of 50 s per data point was chosen for the etascans without lenses and with SU-8 lenses. The acquisition time for the other measurement curves was 1 s per data point. The photon number in the extinction position was 0.15 cps, for the measurement without lenses.
Download figure:
Standard image High-resolution imageThe best result is achieved with the SU-8 lenses. No influence on the degree of polarization purity can be seen within the error margins; the slightly poorer numbers are in fact due to the lower count rate with the lenses in the beam. Beryllium leads to the largest change in the degree of polarization purity. Bragg reflections from small crystallites are the most obvious reason for the deterioration of δ0 [24]. In contrast, the diamond lenses work very well in combination with the x-ray polarimeter. However, their effect on the polarization varies strongly with the orientation of the lenses. In the future, a careful alignment of the lenses in the stack may further improve their performance. The influence of the glassy carbon lenses on the polarization is presently determined by their focusing quality, which in turn is limited by shape fidelity and a large surface roughness. The recollimation of the beam did not work properly and so the degree of polarization purity is determined by the residual divergence of the beam and not by the material itself.
2.3. Polarization microscopy
Finally, we present a first high-sensitivity polarization microscopy experiment with the SU-8 lenses. To this end, we scanned a PF-60 beryllium foil of 500 μm thickness through the focused and polarized beam (see figure 2). The step size was 20 μm and 5 μm in horizontal and vertical directions, respectively. Figure 4 shows the result of the measurement.

Figure 4. Scan of a 500 μm thick beryllium PF60-foil through the focus of the polarized beam between polarizer and analyzer. The diagram shows the intensity difference between the measurement with and without sample on a logarithmic scale. The focus size of the beam was 7.2 μm vertically and 28.4 μm horizontally.
Download figure:
Standard image High-resolution image
The intensity behind the analyzer changes by more than 2.5 orders of magnitude across the scanned sample. The size of the areas with the largest polarization change varies over the scanned area and are unevenly distributed. This suggests that the polarization changes are related to the crystallite size in the material. Beryllium is available in different metallurgic grades. The fabrication process determines the crystallite size and the content of impurities. PF-60 stands for powder foil. It is processed via hot pressing and hot-rolling of Be powder [29]. PF-60 has a beryllium content of 99.0%. The grain size in PF-60 varies significantly. The average size is 25 μm ± 14 μm [29]. As can be seen in figure 4, the areas of polarization change show similar sizes. We therefore conclude that the polarization changes result most probably from small crystallites which are accidentally satisfying the Bragg condition. Compared to high-resolution x-ray polarimetry, scanning high-sensitivity polarization microscopy makes it possible to view the polarization changes with spatial resolution, making it easier to draw conclusions about their origin.
3. Discussion
In this work we have succeeded in the realization of a highly sensitive x-ray microscope with a polarization sensitivity better than 10−10 and spatial resolution of 7.2 μm in vertical and 28 μm in horizontal direction, limited by the size of the focused beam. At the same time, we improved the degree of linear polarization purity of x-ray polarimeters to the new record value of (1.4 ± 0.9) × 10−11. From the tested lens materials, the polymer lenses manufactured by x-ray lithography have proven to be the most suitable. They show the expected focusing properties, while maintaining the polarization purity of the beam.
The findings of this work are another decisive step toward the realization of an experiment for the detection of vacuum birefringence, the original motive why we studied polarization microscopy. In this experiment it is planned to observe the vacuum birefringence with high intensity lasers [30] at the HED (high energy density science) endstation at the European XFEL (x-ray free electron laser) in Schenefeld. We project to focus a high-intensity optical laser pulse (300 TW) into an ultra-high vacuum. This leads to the quantum electrodynamical effect that the vacuum fluctuations interact with the strong electromagnetic field. Temporally and spatially superimposed linear polarized x-ray pulses are used to probe the interaction region. The resulting ellipticity of the x-ray laser pulse scales with the intensity of the optical laser pulse in the focus region and with the photon energy of the x-ray probe pulse. The expected ellipticity signal for a x-ray probe energy of 12.914 keV and laser intensities of 1021 W cm−2 is 10−12 [31]. In order to measure such an extremely small ellipticity signal, it is necessary to match the width of the x-ray pulse to the focus size of the optical laser pulse (ω0 = 1 μm) for intensity reasons. The results of this work have improved the feasibility of the experiment in two ways. For the first time, it has been possible to focus and recollimate x-rays without changing the polarization (within the limits of measurement accuracy). Second, a degree of polarization purity has been measured that is half an order of magnitude better than previously achieved purities (δ0 = 8 × 10⁻¹¹ at 6.456 keV [32]), at twice the photon energy.
High-sensitive polarization microscopy opens up many more possible applications. It enables e.g. the investigation of much smaller samples in spectroscopic polarimetry and nuclear resonant scattering. In addition, a new method has been established that makes minute changes of the polarization visible on a μm scale and thus has the potential to lead to new insights in many disciplines, including pump–probe setups for ultrafast time-dependent studies [33]. This could be e.g. the studies of phase transitions of materials, and optical induced ultrafast changes of polarization properties by Cotton Mouton- and Kerr effect or the investigation of strong magnetic fields in plasmas via Faraday rotation [34]. As a first demonstration, we have shown that commercially available beryllium, which is the favorite material for x-ray optics due to its high transmission, is not suitable for highly sensitive x-ray polarization microscopy. Instead, nanocrystalline or amorphous beryllium would be a possibility to use also beryllium as lens material in high sensitive x-ray polarization microscopy.
The new ultra-low-emittance sources (APS-U, PETRA IV) will improve the efficiency, polarization purity and spatial resolution of the high-precision x-ray scanning microscope due to the better horizontal divergence and smaller source size. Furthermore, the focus size can be improved by increasing the number of lenses such that a resolution on the sub-μm-scale and polarization purities of 10−12 are possible in principle.
Acknowledgments
This work was partly carried out with the support of the Karlsruhe Nano Micro Facility (KNMFi, www.knmf.kit.edu), a Helmholtz Research Infrastructure at Karlsruhe Institute of Technology (KIT, www.kit.edu). This work was funded by the Deutsche Forschungsgemeinschaft (DFG) under Grant No. 416700351 and the Free State of Thuringia in the framework of Forschergruppe 2017FGR0074. The authors thank Rafael Celestre for measuring the surface roughness of the glassy carbon lenses.
Data availability statement
The data that support the findings of this study are available upon reasonable request from the authors.